• Trade
  • Markets
  • Copy
  • Contests
  • News
  • 24/7
  • Calendar
  • Q&A
  • Chats
Trending
Screeners
SYMBOL
LAST
BID
ASK
HIGH
LOW
NET CHG.
%CHG.
SPREAD
SPX
S&P 500 Index
6818.46
6818.46
6818.46
6861.30
6801.50
-8.95
-0.13%
--
DJI
Dow Jones Industrial Average
48383.64
48383.64
48383.64
48679.14
48285.67
-74.40
-0.15%
--
IXIC
NASDAQ Composite Index
23107.37
23107.37
23107.37
23345.56
23012.00
-87.79
-0.38%
--
USDX
US Dollar Index
97.960
98.040
97.960
98.070
97.740
+0.010
+ 0.01%
--
EURUSD
Euro / US Dollar
1.17441
1.17449
1.17441
1.17686
1.17262
+0.00047
+ 0.04%
--
GBPUSD
Pound Sterling / US Dollar
1.33699
1.33709
1.33699
1.34014
1.33546
-0.00008
-0.01%
--
XAUUSD
Gold / US Dollar
4303.02
4303.43
4303.02
4350.16
4285.08
+3.63
+ 0.08%
--
WTI
Light Sweet Crude Oil
56.358
56.388
56.358
57.601
56.233
-0.875
-1.53%
--

Community Accounts

Signal Accounts
--
Profit Accounts
--
Loss Accounts
--
View More

Become a signal provider

Sell trading signals to earn additional income

View More

Guide to Copy Trading

Get started with ease and confidence

View More

Signal Accounts for Members

All Signal Accounts

Best Return
  • Best Return
  • Best P/L
  • Best MDD
Past 1W
  • Past 1W
  • Past 1M
  • Past 1Y

All Contests

  • All
  • Trump Updates
  • Recommend
  • Stocks
  • Cryptocurrencies
  • Central Banks
  • Featured News
Top News Only
Share

New York Fed Accepts $2.601 Billion Of $2.601 Billion Submitted To Reverse Repo Facility On Dec 15

Share

Turkey: Shoots Down A Drone In The Black Sea Using F-16 Fighter Jets

Share

Goldman Sachs Says They Believe That The Copper Price Is Vulnerable To An Ai-Linked Price Correction

Share

Goldman Sachs Upgrades 2026 Copper Price Forecast To $11400 From $10,650

Share

Attempts By Ukrainian Troops To Advance From The South-West To Outskirts Of Kupiansk Are Being Thwarted

Share

Russian Troops Control All Of Kupiansk - IFX Cites Russian Military

Share

On Monday (December 15), The South Korean Won Ultimately Rose 0.60% Against The US Dollar, Closing At 1468.91 Won. The Won Was On An Upward Trend Throughout The Day, Rising Significantly At 17:00 Beijing Time And Reaching A Daily High Of 1463.04 Won At 17:36

Share

Health Ministry: Israeli Forces Kill Palestinian Teen In West Bank

Share

New York Federal Reserve President Williams: Over Time, The Size Of Reserves Could Grow From $2.9 Trillion

Share

New York Fed President Williams: AI Valuations Are High, But There Is A Real Driving Factor

Share

New York Federal Reserve President Williams: The Job Market Is In Very Good Shape

Share

New York Fed President Williams: 'Very Supportive' Of USA Central Bank's Decision To Cut Interest Rates Last Week

Share

New York Fed President Williams: 'Too Early To Say' What Central Bank Should Do At January Meeting

Share

New York Fed President Williams: Strong Markets Part Of Reason Why Economy Will Grow Robustly In 2026

Share

New York Fed President Williams: What Constitutes Ample Reserves Will Change Over Time

Share

New York Fed President Williams: Market Valuations 'Elevated,' But There Are Reasons For Pricing

Share

New York Fed President Williams: Ample Reserves System Working Very Well

Share

New York Fed President Williams: Some Signs That Parts Of Underlying Economy Not As Strong As GDP Data Suggests

Share

New York Fed President Williams: Expects Coming Job Data Will Show Gradual Cooling

Share

Ukraine President Zelenskiy: Monitoring Of Ceasefire Should Be Part Of Security Guarantees

TIME
ACT
FCST
PREV
Japan Tankan Small Manufacturing Outlook Index (Q4)

A:--

F: --

P: --

Japan Tankan Large Non-Manufacturing Outlook Index (Q4)

A:--

F: --

P: --

Japan Tankan Large Manufacturing Outlook Index (Q4)

A:--

F: --

P: --

Japan Tankan Small Manufacturing Diffusion Index (Q4)

A:--

F: --

P: --

Japan Tankan Large-Enterprise Capital Expenditure YoY (Q4)

A:--

F: --

P: --

U.K. Rightmove House Price Index YoY (Dec)

A:--

F: --

P: --

China, Mainland Industrial Output YoY (YTD) (Nov)

A:--

F: --

P: --

China, Mainland Urban Area Unemployment Rate (Nov)

A:--

F: --

P: --

Saudi Arabia CPI YoY (Nov)

A:--

F: --

P: --

Euro Zone Industrial Output YoY (Oct)

A:--

F: --

P: --

Euro Zone Industrial Output MoM (Oct)

A:--

F: --

P: --

Canada Existing Home Sales MoM (Nov)

A:--

F: --

P: --

Canada National Economic Confidence Index

A:--

F: --

P: --

Canada New Housing Starts (Nov)

A:--

F: --

P: --
U.S. NY Fed Manufacturing Employment Index (Dec)

A:--

F: --

P: --

U.S. NY Fed Manufacturing Index (Dec)

A:--

F: --

P: --

Canada Core CPI YoY (Nov)

A:--

F: --

P: --

Canada Manufacturing Unfilled Orders MoM (Oct)

A:--

F: --

P: --

U.S. NY Fed Manufacturing Prices Received Index (Dec)

A:--

F: --

P: --

U.S. NY Fed Manufacturing New Orders Index (Dec)

A:--

F: --

P: --

Canada Manufacturing New Orders MoM (Oct)

A:--

F: --

P: --

Canada Core CPI MoM (Nov)

A:--

F: --

P: --

Canada Trimmed CPI YoY (SA) (Nov)

A:--

F: --

P: --

Canada Manufacturing Inventory MoM (Oct)

A:--

F: --

P: --

Canada CPI YoY (Nov)

A:--

F: --

P: --

Canada CPI MoM (Nov)

A:--

F: --

P: --

Canada CPI YoY (SA) (Nov)

A:--

F: --

P: --

Canada Core CPI MoM (SA) (Nov)

A:--

F: --

P: --

Canada CPI MoM (SA) (Nov)

A:--

F: --

P: --

Federal Reserve Board Governor Milan delivered a speech
U.S. NAHB Housing Market Index (Dec)

A:--

F: --

P: --

Australia Composite PMI Prelim (Dec)

--

F: --

P: --

Australia Services PMI Prelim (Dec)

--

F: --

P: --

Australia Manufacturing PMI Prelim (Dec)

--

F: --

P: --

Japan Manufacturing PMI Prelim (SA) (Dec)

--

F: --

P: --

U.K. 3-Month ILO Employment Change (Oct)

--

F: --

P: --

U.K. Unemployment Claimant Count (Nov)

--

F: --

P: --

U.K. Unemployment Rate (Nov)

--

F: --

P: --

U.K. 3-Month ILO Unemployment Rate (Oct)

--

F: --

P: --

U.K. Average Weekly Earnings (3-Month Average, Including Bonuses) YoY (Oct)

--

F: --

P: --

U.K. Average Weekly Earnings (3-Month Average, Excluding Bonuses) YoY (Oct)

--

F: --

P: --

France Services PMI Prelim (Dec)

--

F: --

P: --

France Composite PMI Prelim (SA) (Dec)

--

F: --

P: --

France Manufacturing PMI Prelim (Dec)

--

F: --

P: --

Germany Services PMI Prelim (SA) (Dec)

--

F: --

P: --

Germany Manufacturing PMI Prelim (SA) (Dec)

--

F: --

P: --

Germany Composite PMI Prelim (SA) (Dec)

--

F: --

P: --

Euro Zone Composite PMI Prelim (SA) (Dec)

--

F: --

P: --

Euro Zone Services PMI Prelim (SA) (Dec)

--

F: --

P: --

Euro Zone Manufacturing PMI Prelim (SA) (Dec)

--

F: --

P: --

U.K. Services PMI Prelim (Dec)

--

F: --

P: --

U.K. Manufacturing PMI Prelim (Dec)

--

F: --

P: --

U.K. Composite PMI Prelim (Dec)

--

F: --

P: --

Euro Zone ZEW Economic Sentiment Index (Dec)

--

F: --

P: --

Germany ZEW Current Conditions Index (Dec)

--

F: --

P: --

Germany ZEW Economic Sentiment Index (Dec)

--

F: --

P: --

Euro Zone Trade Balance (Not SA) (Oct)

--

F: --

P: --

Euro Zone ZEW Current Conditions Index (Dec)

--

F: --

P: --

Euro Zone Trade Balance (SA) (Oct)

--

F: --

P: --

Euro Zone Total Reserve Assets (Nov)

--

F: --

P: --

U.K. Inflation Rate Expectations

--

F: --

P: --

Q&A with Experts
    • All
    • Chatrooms
    • Groups
    • Friends
    Connecting
    .
    .
    .
    Type here...
    Add Symbol or Code

      No matching data

      All
      Trump Updates
      Recommend
      Stocks
      Cryptocurrencies
      Central Banks
      Featured News
      • All
      • Russia-Ukraine Conflict
      • Middle East Flashpoint
      • All
      • Russia-Ukraine Conflict
      • Middle East Flashpoint
      Search
      Products

      Charts Free Forever

      Chats Q&A with Experts
      Screeners Economic Calendar Data Tools
      Membership Features
      Data Warehouse Market Trends Institutional Data Policy Rates Macro

      Market Trends

      Market Sentiment Order Book Forex Correlations

      Top Indicators

      Charts Free Forever
      Markets

      News

      News Analysis 24/7 Columns Education
      From Institutions From Analysts
      Topics Columnists

      Latest Views

      Latest Views

      Trending Topics

      Top Columnists

      Latest Update

      Signals

      Copy Rankings Latest Signals Become a signal provider AI Rating
      Contests
      Brokers

      Overview Brokers Assessment Rankings Regulators News Claims
      Broker listing Forex Brokers Comparison Tool Live Spread Comparison Scam
      Q&A Complaint Scam Alert Videos Tips to Detect Scam
      More

      Business
      Events
      Careers About Us Advertising Help Center

      White Label

      Data API

      Web Plug-ins

      Affiliate Program

      Awards Institution Evaluation IB Seminar Salon Event Exhibition
      Vietnam Thailand Singapore Dubai
      Fans Party Investment Sharing Session
      FastBull Summit BrokersView Expo
      Recent Searches
        Top Searches
          Markets
          News
          Analysis
          User
          24/7
          Economic Calendar
          Education
          Data
          • Names
          • Latest
          • Prev

          View All

          No data

          Scan to Download

          Faster Charts, Chat Faster!

          Download App
          English
          • English
          • Español
          • العربية
          • Bahasa Indonesia
          • Bahasa Melayu
          • Tiếng Việt
          • ภาษาไทย
          • Français
          • Italiano
          • Türkçe
          • Русский язык
          • 简中
          • 繁中
          Open Account
          Search
          Products
          Charts Free Forever
          Markets
          News
          Signals

          Copy Rankings Latest Signals Become a signal provider AI Rating
          Contests
          Brokers

          Overview Brokers Assessment Rankings Regulators News Claims
          Broker listing Forex Brokers Comparison Tool Live Spread Comparison Scam
          Q&A Complaint Scam Alert Videos Tips to Detect Scam
          More

          Business
          Events
          Careers About Us Advertising Help Center

          White Label

          Data API

          Web Plug-ins

          Affiliate Program

          Awards Institution Evaluation IB Seminar Salon Event Exhibition
          Vietnam Thailand Singapore Dubai
          Fans Party Investment Sharing Session
          FastBull Summit BrokersView Expo

          Circle applies for US trust bank charter to manage its USDC reserve

          Cointelegraph
          1inch / Tether
          -1.92%
          Vaulta / Tether
          -1.25%
          AAVE / Tether
          -1.46%
          Fusionist / Tether
          -2.51%

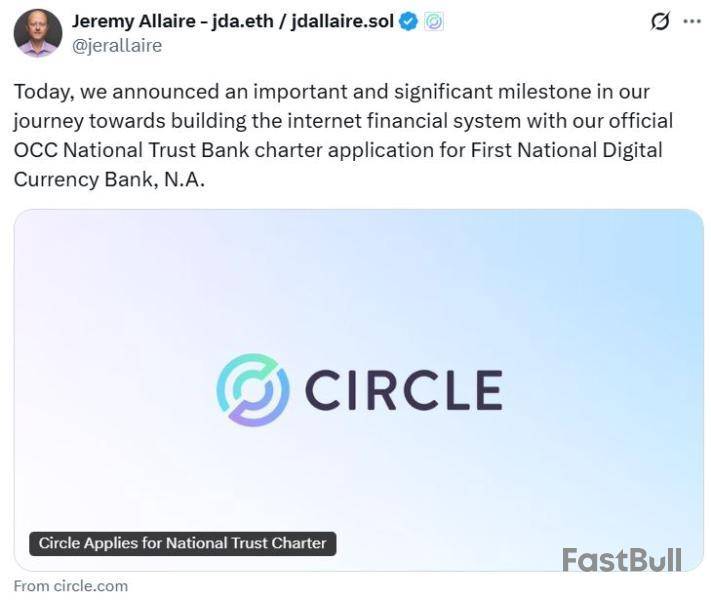
          Stablecoin issuer Circle has applied to establish a national trust bank in the United States that, among other duties, would oversee the firm’s USDC reserve on behalf of its US issuer.

          If the application is approved by the US Office of the Comptroller of the Currency (OCC), Circle’s First National Digital Currency Bank would be authorized to operate as a federally regulated trust institution, Circle said in a statement on Monday.

          Circles Digital Bank also hopes to strengthen the infrastructure that “supports the issuance and circulation” of USDC and offer digital asset custody services to institutional customers, the stablecoin issuer added.

          National Trust Banks can’t accept cash deposits or issue loans. However, they can offer custodial services and operate nationally under the oversight of the OCC, rather than having to apply for individual state-based money transmitter licenses or specific digital currency licenses, according to law firm Dave Wright Tremaine.

          GENIUS Act compliance

          Circle said a federally regulated trust charter would also help it meet requirements under the proposed GENIUS Act, which passed the US Senate on June 17 and moved to the House of Representatives, where it will face another vote before possibly becoming law.

          Circle co-founder and CEO Jeremy Allaire said Circle is taking “proactive steps to further strengthen our USDC infrastructure” and “align with emerging US regulation for the issuance and operation of dollar-denominated payment stablecoins.”

          National Trust Bank applications to the OCC are subject to a 30-day comment period, and the regulator usually decides to approve or reject within 120 days after receipt of a complete application.

          Other crypto firms also eye bank charters

          Circle isn’t the only crypto firm hoping to create a national trust bank under the oversight of the OCC.

          Eleanor Terrett, the host of the Crypto in America podcast, said in an X post on Monday that there are several other crypto firms, including the digital currency wing of financial services giant Fidelity, that are applying for a national bank charter license from the OCC.

          Circle has been considering a bank charter since at least 2022 and was also named in The Wall Street Journal report on April 21 as one of several crypto firms considering applying for a bank charter or license.

          Anchorage Trust Company became the first crypto firm to receive a license from the OCC in January 2021, converting into Anchorage Digital Bank.

          Circles’ stock trades flat

          Circle Internet Group (CRCL) shares have traded flat in the last trading session, rising 0.48% to $181, Google Finance data shows. In after-hours trading, the stock dropped 1.30% to $178.

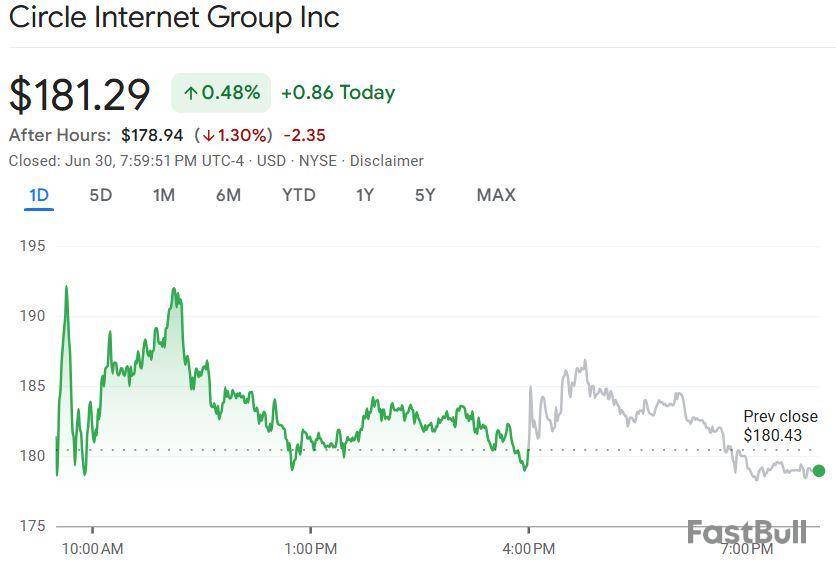
          After going public, Circle stock made a strong entry into the market on June 5, climbing 167% during its first trading session on the New York Stock Exchange.

          Risk Warnings and Disclaimers
          You understand and acknowledge that there is a high degree of risk involved in trading. Following any strategies or investment methods may lead to potential losses. The content on the site is provided by our contributors and analysts for information purposes only. You are solely responsible for determining whether any trading assets, securities, strategy, or any other product is suitable for investing based on your own investment objectives and financial situation.
          Add to Favorites
          Share

          Ripple Price Prediction As XRP EVM Ledger Goes Live

          Coinpedia
          1inch / Tether
          -1.92%
          Vaulta / Tether
          -1.25%
          AAVE / Tether
          -1.46%
          Fusionist / Tether
          -2.51%
          Risk Warnings and Disclaimers
          You understand and acknowledge that there is a high degree of risk involved in trading. Following any strategies or investment methods may lead to potential losses. The content on the site is provided by our contributors and analysts for information purposes only. You are solely responsible for determining whether any trading assets, securities, strategy, or any other product is suitable for investing based on your own investment objectives and financial situation.
          Add to Favorites
          Share

          Benchmark sets Metaplanet price target at 46% above market valuation, projecting continued growth

          The Block
          1inch / Tether
          -1.92%
          Vaulta / Tether
          -1.25%
          AAVE / Tether
          -1.46%
          Fusionist / Tether
          -2.51%
          Risk Warnings and Disclaimers
          You understand and acknowledge that there is a high degree of risk involved in trading. Following any strategies or investment methods may lead to potential losses. The content on the site is provided by our contributors and analysts for information purposes only. You are solely responsible for determining whether any trading assets, securities, strategy, or any other product is suitable for investing based on your own investment objectives and financial situation.
          Add to Favorites
          Share

          Bitcoin Price Holds Steady — Bullish Monthly Structure Suggests Rally Continuation

          NewsBTC
          1inch / Tether
          -1.92%
          Vaulta / Tether
          -1.25%
          AAVE / Tether
          -1.46%
          Fusionist / Tether
          -2.51%

          Bitcoin price started trading in a range below the $108,800 zone. BTC is now consolidating and might aim for a move above the $108,000 resistance.

          • Bitcoin started a downside correction from the $108,800 zone.
          • The price is trading below $107,500 and the 100 hourly Simple moving average.
          • There is a bearish trend line forming with resistance at $107,400 on the hourly chart of the BTC/USD pair (data feed from Kraken).
          • The pair could start a fresh increase if it stays above the $105,500 zone.

          Bitcoin Price Eyes Fresh Gains

          Bitcoin price started a fresh increase above the $105,500 zone. BTC gained pace and was able to climb above the $106,500 and $107,200 levels to enter a positive zone.

          The bulls pushed the price above the $108,000 resistance and the price tested the $108,800 zone. A high was formed at $108,792 and the price recently corrected gains. There was a move below the $107,500 level. A low was formed at $106,800 and the price is now consolidating losses.

          There was a recovery above the 23.6% Fib retracement level of the downward move from the $108,792 swing high to the $106,800 low. Bitcoin is now trading below $107,500 and the 100 hourly Simple moving average.

          On the upside, immediate resistance is near the $107,400 level. There is also a bearish trend line forming with resistance at $107,400 on the hourly chart of the BTC/USD pair. The first key resistance is near the $108,000 level and the 50% Fib level of the downward move from the $108,792 swing high to the $106,800 low.

          A close above the $108,000 resistance might send the price further higher. In the stated case, the price could rise and test the $108,800 resistance level. Any more gains might send the price toward the $110,000 level.

          More Losses In BTC?

          If Bitcoin fails to rise above the $108,000 resistance zone, it could start another decline. Immediate support is near the $106,800 level. The first major support is near the $106,500 level.

          The next support is now near the $105,500 zone. Any more losses might send the price toward the $105,000 support in the near term. The main support sits at $103,500, below which BTC might gain bearish momentum.

          Technical indicators:

          Hourly MACD – The MACD is now losing pace in the bearish zone.

          Hourly RSI (Relative Strength Index) – The RSI for BTC/USD is now below the 50 level.

          Major Support Levels – $106,800, followed by $106,500.

          Major Resistance Levels – $108,000 and $108,800.

          Risk Warnings and Disclaimers
          You understand and acknowledge that there is a high degree of risk involved in trading. Following any strategies or investment methods may lead to potential losses. The content on the site is provided by our contributors and analysts for information purposes only. You are solely responsible for determining whether any trading assets, securities, strategy, or any other product is suitable for investing based on your own investment objectives and financial situation.
          Add to Favorites
          Share

          Dogecoin Under Pressure: Only Top 10 Coin Where Loss-Taking Exceeds Profit

          NewsBTC
          1inch / Tether
          -1.92%
          Vaulta / Tether
          -1.25%
          AAVE / Tether
          -1.46%
          Fusionist / Tether
          -2.51%

          On-chain data shows Dogecoin is the only cryptocurrency among the top 10 where investors are currently realizing more losses than profits.

          Dogecoin Investors Realized $124 Million In Loss Over The Last 24 Hours

          In a new post on X, the on-chain analytics firm Glassnode has shared how the major cryptocurrencies compare against each other in terms of the Realized Loss and Realized Profit metrics.

          These indicators measure, as their names already imply, the amount of loss/profit that the investors on a given network are realizing through their transactions right now.

          The metrics work by going through the transfer history of each coin being sold to see what price it was moved at prior to this. If this previous value is less than the price that the coin’s now being sold at, then the token’s sale is leading to profit realization. On the other hand, it being higher suggests loss realization.

          The Realized Profit sums up the difference between the two prices involved in all sales of the former type, while the Realized Loss does the same for the latter ones.

          Now, here is the table shared by the analytics firm that shows how the 24-hour values of the two metrics currently stack up for the top 10 coins by market cap:

          Dogecoin Realized Profit/Loss

          As is visible above, the scale of the Realized Loss and Realized Profit differs greatly between the different assets, but one pattern is consistent: the latter outweighs the former, implying a trend of net profit-taking from the investors.

          One asset, however, doesn’t fit the mold: Dogecoin. The 24-hour Realized Loss for the memecoin stands at around $132 million, while the Realized Profit is much lower with a value of just $5 million.

          As such, it would appear that while the participants in the rest of the sector have been harvesting gains, DOGE holders have been panic capitulating at a loss instead.

          Among these top coins, the investors of Bitcoin have realized the largest profit, with the indicator’s value sitting at a whopping $1.3 billion. The Realized Loss is also restricted to just $33 million for the number one cryptocurrency, indicating selling has been heavily lopsided toward profit-taking.

          Things are more balanced for Ethereum, the digital asset ranked number two. Its Realized Loss of $18.4 million is roughly half that of its Realized Profit of $35.2 million.

          The fact that profit realization is so dominant for the likes of Bitcoin, however, might actually be a bearish sign. Historically, such market conditions have made tops more likely. A dominance of loss-taking, on the other hand, can facilitate reversals to the upside. As such, while not a given, Dogecoin may not be in a bad position, at least in this regard.

          DOGE Price

          Dogecoin touched the $0.170 mark during the weekend, but the memecoin has seen a retrace under $0.165 to kick off the week.

          Risk Warnings and Disclaimers
          You understand and acknowledge that there is a high degree of risk involved in trading. Following any strategies or investment methods may lead to potential losses. The content on the site is provided by our contributors and analysts for information purposes only. You are solely responsible for determining whether any trading assets, securities, strategy, or any other product is suitable for investing based on your own investment objectives and financial situation.
          Add to Favorites
          Share

          Harmony Price Prediction 2025, 2026-2030: Is ONE Crypto A Good Investment?

          Coinpedia
          1inch / Tether
          -1.92%
          Vaulta / Tether
          -1.25%
          AAVE / Tether
          -1.46%
          Fusionist / Tether
          -2.51%

          Story Highlights

          • Harmony with a potential surge could go as high as $0.0413 by the end of 2025.
          • ONE crypto could reach a high of $9.739 by the end of 2030.
          • The current price of Harmony is [liveprice sym="ONE"].

          Altcoins have seen tremendous growth over the past three years, with many innovative projects entering the market to address blockchain challenges. One standout project is Harmony, which utilizes the “Effective Proof-of-Stake (EPoS)” consensus mechanism to enhance scalability and transaction speed.

          As Harmony gears up for significant upgrades and collaborations, its native token, ONE, could see a substantial rise in value. Curious about how high ONE could go in 2025 and beyond? Stay tuned as we dive into its price predictions and potential future milestones!

          Table of contents

          • Story Highlights
          • ONE Crypto Price Prediction 2025
          • Harmony Price Prediction 2026-2030
          • Market Analysis
          • FAQs

          Overview

          Cryptocurrency[cryptocurrency_name sym="ONE"]
          Token[cryptocurrency_symbol sym="ONE"]
          Price [liveprice sym="ONE"] [24hr_change sym="ONE"]
          Market Cap[marketcap sym="ONE"]
          Circulating Supply[circulating_supply sym="ONE"]
          Trading Supply[trading_volume sym="ONE"]
          All-time High$0.38 in October 2021
          All-time Low$0.0012 in March 2020

          ONE Crypto Price Prediction 2025

          By the end of 2025, ONE might become the top DeFi token in the market and might enter the top 20 cryptocurrencies list. If the network works on an instant transaction system, then it may blow a high at $0.0413.

          That said, with not many developments, ONE coin might trade at $0.0330. Conversely, if new regulations pop up in the coming years, the coin may entangle and drop even to $0.0248.

          Year2025
          Potential Low ($)0.0248
          Average Price ($)0.033
          Potential High ($)0.0413

          Harmony Price Prediction 2026-2030

          YearPotential LowAverage PricePotential High
          2026$0.1245$0.2364$0.5823
          2027$0.3231$0.4543$1.4050
          2028$0.8384$0.8731$3.3902
          2029$1.1753$2.6781$5.1806
          2030$3.6440$5.2250$9.7399

          Market Analysis

          Firm Name2025
          Wallet Investor$0.000280
          priceprediction.net$0.031000
          DigitalCoinPrice$0.039800

          *The targets mentioned above are the average targets set by the respective firms.

          CoinPedia’s Harmony Price Predictions:

          The constant upgrades and partnerships will give a massive boost to the price of Harmony . According to Coinpedia’s formulated Harmony ONE price prediction. With bullish market sentiments, ONE’s price may skyrocket to $0.0413 by the end of the year 2025.

          On the downside, future market fluctuation and increased competition may adversely affect Harmony’s price, which may result in a collapse of the coin’s price to $0.0248, with an average of $0.033.

          Year2025
          Potential Low ($)0.0248
          Average Price ($)0.033
          Potential High ($)0.0413

          Read More: Read our in-depth Dash price prediction!

          FAQs

          Is Harmony a good investment?

          Yes, if you are planning for the long term Harmony looks promising. As the team is planning for expansion and more security upgrades.

          Which consensus mechanism does Harmony use?

          The Harmony network uses the Effective Proof-of-Stake consensus mechanism. 

          How to buy Harmony ?

          Harmony is available across popular platforms such as Binance, Coinbase, Huobi, and more. 

          What is the price of 1 Harmony crypto?

          At the time of publishing, the value of 1 ONE token was $0.009577.

          Risk Warnings and Disclaimers
          You understand and acknowledge that there is a high degree of risk involved in trading. Following any strategies or investment methods may lead to potential losses. The content on the site is provided by our contributors and analysts for information purposes only. You are solely responsible for determining whether any trading assets, securities, strategy, or any other product is suitable for investing based on your own investment objectives and financial situation.
          Add to Favorites
          Share

          Tezos Price Prediction 2025, 2026 – 2030: How High Will XTZ Price Go?

          Coinpedia
          1inch / Tether
          -1.92%
          Vaulta / Tether
          -1.25%
          AAVE / Tether
          -1.46%
          Fusionist / Tether
          -2.51%
          Risk Warnings and Disclaimers
          You understand and acknowledge that there is a high degree of risk involved in trading. Following any strategies or investment methods may lead to potential losses. The content on the site is provided by our contributors and analysts for information purposes only. You are solely responsible for determining whether any trading assets, securities, strategy, or any other product is suitable for investing based on your own investment objectives and financial situation.
          Add to Favorites
          Share
          FastBull
          Copyright © 2025 FastBull Ltd

          728 RM B 7/F GEE LOK IND BLDG NO 34 HUNG TO RD KWUN TONG KLN HONG KONG

          TelegramInstagramTwitterfacebooklinkedin
          App Store Google Play Google Play
          Products
          Charts

          Chats

          Q&A with Experts
          Screeners
          Economic Calendar
          Data
          Tools
          Membership
          Features
          Function
          Markets
          Copy Trading
          Latest Signals
          Contests
          News
          Analysis
          24/7
          Columns
          Education
          Company
          Careers
          About Us
          Contact Us
          Advertising
          Help Center
          Feedback
          User Agreement
          Privacy Policy
          Business

          White Label

          Data API

          Web Plug-ins

          Poster Maker

          Affiliate Program

          Risk Disclosure

          The risk of loss in trading financial instruments such as stocks, FX, commodities, futures, bonds, ETFs and crypto can be substantial. You may sustain a total loss of the funds that you deposit with your broker. Therefore, you should carefully consider whether such trading is suitable for you in light of your circumstances and financial resources.

          No decision to invest should be made without thoroughly conducting due diligence by yourself or consulting with your financial advisors. Our web content might not suit you since we don't know your financial conditions and investment needs. Our financial information might have latency or contain inaccuracy, so you should be fully responsible for any of your trading and investment decisions. The company will not be responsible for your capital loss.

          Without getting permission from the website, you are not allowed to copy the website's graphics, texts, or trademarks. Intellectual property rights in the content or data incorporated into this website belong to its providers and exchange merchants.

          Not Logged In

          Log in to access more features

          FastBull Membership

          Not yet

          Purchase

          Become a signal provider
          Help Center
          Customer Service
          Dark Mode
          Price Up/Down Colors

          Log In

          Sign Up

          Position
          Layout
          Fullscreen
          Default to Chart
          The chart page opens by default when you visit fastbull.com