Markets
News
Analysis
User
24/7
Economic Calendar
Education
Data
- Names
- Latest
- Prev


Signal Accounts for Members
All Signal Accounts
All Contests


U.K. Trade Balance Non-EU (SA) (Oct)A:--
F: --
P: --
U.K. Trade Balance (Oct)A:--
F: --
P: --
U.K. Services Index MoMA:--
F: --
P: --
U.K. Construction Output MoM (SA) (Oct)A:--
F: --
P: --
U.K. Industrial Output YoY (Oct)A:--
F: --
P: --
U.K. Trade Balance (SA) (Oct)A:--
F: --
P: --
U.K. Trade Balance EU (SA) (Oct)A:--
F: --
P: --
U.K. Manufacturing Output YoY (Oct)A:--
F: --
P: --
U.K. GDP MoM (Oct)A:--
F: --
P: --
U.K. GDP YoY (SA) (Oct)A:--
F: --
P: --
U.K. Industrial Output MoM (Oct)A:--
F: --
P: --
U.K. Construction Output YoY (Oct)A:--
F: --
P: --
France HICP Final MoM (Nov)A:--
F: --
P: --
China, Mainland Outstanding Loans Growth YoY (Nov)A:--
F: --
P: --
China, Mainland M2 Money Supply YoY (Nov)A:--
F: --
P: --
China, Mainland M0 Money Supply YoY (Nov)A:--
F: --
P: --
China, Mainland M1 Money Supply YoY (Nov)A:--
F: --
P: --
India CPI YoY (Nov)A:--
F: --
P: --
India Deposit Gowth YoYA:--
F: --
P: --
Brazil Services Growth YoY (Oct)A:--
F: --
P: --
Mexico Industrial Output YoY (Oct)A:--
F: --
P: --
Russia Trade Balance (Oct)A:--
F: --
P: --
Philadelphia Fed President Henry Paulson delivers a speech
Canada Building Permits MoM (SA) (Oct)A:--
F: --
P: --
Canada Wholesale Sales YoY (Oct)A:--
F: --
P: --
Canada Wholesale Inventory MoM (Oct)A:--
F: --
P: --
Canada Wholesale Inventory YoY (Oct)A:--
F: --
P: --
Canada Wholesale Sales MoM (SA) (Oct)A:--
F: --
P: --
Germany Current Account (Not SA) (Oct)A:--
F: --
P: --
U.S. Weekly Total Rig CountA:--
F: --
P: --
U.S. Weekly Total Oil Rig CountA:--
F: --
P: --
Japan Tankan Large Non-Manufacturing Diffusion Index (Q4)--
F: --
P: --
Japan Tankan Small Manufacturing Outlook Index (Q4)--
F: --
P: --
Japan Tankan Large Non-Manufacturing Outlook Index (Q4)--
F: --
P: --
Japan Tankan Large Manufacturing Outlook Index (Q4)--
F: --
P: --
Japan Tankan Small Manufacturing Diffusion Index (Q4)--
F: --
P: --
Japan Tankan Large Manufacturing Diffusion Index (Q4)--
F: --
P: --
Japan Tankan Large-Enterprise Capital Expenditure YoY (Q4)--
F: --
P: --
U.K. Rightmove House Price Index YoY (Dec)--
F: --
P: --
China, Mainland Industrial Output YoY (YTD) (Nov)--
F: --
P: --
China, Mainland Urban Area Unemployment Rate (Nov)--
F: --
P: --
Saudi Arabia CPI YoY (Nov)--
F: --
P: --
Euro Zone Industrial Output YoY (Oct)--
F: --
P: --
Euro Zone Industrial Output MoM (Oct)--
F: --
P: --
Canada Existing Home Sales MoM (Nov)--
F: --
P: --
Euro Zone Total Reserve Assets (Nov)--
F: --
P: --
U.K. Inflation Rate Expectations--
F: --
P: --
Canada National Economic Confidence Index--
F: --
P: --
Canada New Housing Starts (Nov)--
F: --
P: --
U.S. NY Fed Manufacturing Employment Index (Dec)--
F: --
P: --
U.S. NY Fed Manufacturing Index (Dec)--
F: --
P: --
Canada Core CPI YoY (Nov)--
F: --
P: --
Canada Manufacturing Unfilled Orders MoM (Oct)--
F: --
P: --
Canada Manufacturing New Orders MoM (Oct)--
F: --
P: --
Canada Core CPI MoM (Nov)--
F: --
P: --
Canada Manufacturing Inventory MoM (Oct)--
F: --
P: --
Canada CPI YoY (Nov)--
F: --
P: --
Canada CPI MoM (Nov)--
F: --
P: --
Canada CPI YoY (SA) (Nov)--
F: --
P: --
Canada Core CPI MoM (SA) (Nov)--
F: --
P: --


No matching data
Latest Views
Latest Views
Trending Topics
Top Columnists
Latest Update
White Label
Data API
Web Plug-ins
Affiliate Program
View All

No data
The Cardano price may be preparing for a powerful rally toward $1.7, as new indicators suggest a potential recovery. A leading crypto analyst has identified multiple bullish catalysts that could drive ADA’s momentum and help propel the cryptocurrency to this bullish target.
Institutional Interest To Fuel Cardano Price Recovery
According to a recent technical analysis by a pseudonymous TradingView analyst, ‘Risk_Adj_Return,’ the Cardano price is suddenly showing signs of recovery after a period of sluggish performance. This seemingly bullish turnaround has sparked predictions of a potential surge to $1.7.
According to the analyst’s report, several factors have been fueling ADA’s recovery. Despite its downtrend, large spot purchases have been observed, hinting at growing interest from institutional investors. The analyst also mentioned that political developments from key figures, such as US President Donald Trump, could spark further bullish sentiment for Cardano.
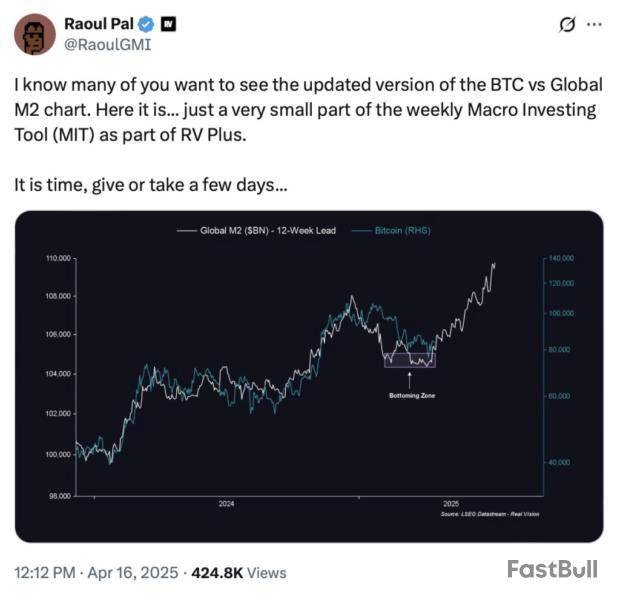
Although many of the present institutional buy-ins for Cardano have been followed by sell-offs, possibly from short-term traders, the sheer volume suggests that major players are closely watching the market. Part of this renewed institutional interest is attributed to the US Federal Reserve (FED) and broader macroeconomic signals.
Investors may be hoping for a shift in monetary policy or clear signs of easing inflation in the upcoming FOMC meeting, as this could boost risk assets like ADA. Any alignment between the Cardano price action and the FED decision could become a significant catalyst for upside momentum.
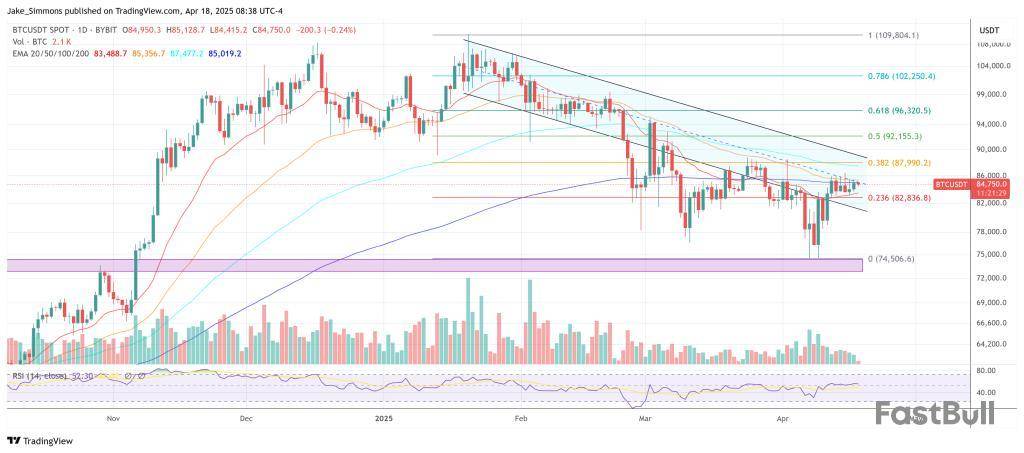
In his Cardano price chart, the TradingView analyst highlighted a bullish long trade setup on the 4-hour timeframe, utilizing the Heikin-Ashi candles. The trading strategy is supported by multiple take-profit levels, with the entry point marked near Cardano’s current price range. A clear stop loss has also been placed just below the local support to manage downside risks.
The trade plan involves three key take-profit levels: $0.73, $0.96, and $1.21. These targets align with previous resistance zones, allowing traders to potentially lock in gains before ADA reaches its ultimate upside target of $1.74.
ADA Breakout Unlikely Amid US Trade Tensions
The Cardano price is showing signs of strength, according to a market expert, ‘AMCrypto’, who notes that it is holding firm at a critical ascending support trendline on the 4-hour chart. After a recent decline, ADA bounced off the trendline, maintaining the bullish structure of an Ascending Triangle.
Currently trading around $0.61, Cardano still faces resistance at $0.67. A confirmed close above this threshold could signal a breakout, potentially propelling its price toward the $0.73 – $0.75 range.
However, despite these bullish technicals, macroeconomic uncertainty remains a key obstacle to ADA’s breakout potential. The ongoing US-China trade war tensions continue to fuel market volatility, creating headwinds for a sustained rally. The current market decline and instability fueled by this trade war have also kept many investors on the sidelines as they await stability.
Amid looming market uncertainties, XRP holders remain optimistic about the token’s performance in the coming months, as historical data from CryptoRank reveals several consecutive Julys of gains in XRP’s monthly returns.
This comes amid an unstable market condition witnessed across the global crypto space, with prices of major cryptocurrencies showing mixed signals and many returning to previous lows.
Although XRP has maintained resilience around the $2 mark despite macroeconomic pressures, the fourth-largest cryptocurrency has remained in the red zone, posting a nearly 2% decline in its price since the previous day. The coin is trading around $2.07 as of press time, according to data from CoinMarketCap.
Investors bank on XRP’s July momentum
The data shows that XRP began its July profit streak five years ago in 2020, despite recording a relatively poor annual return of 18.2%. Even while facing significant lows that year due to regulatory backlashes stemming from the SEC’s lawsuit, XRP stood out in July 2020 with a notable 48.1% surge.
That strong July performance was replicated in the following years, resulting in a five-year profit streak in XRP’s July returns.
While the momentum continued, the size of the gains varied, with 2021 recording a 6.91% return, and 2022, 2023, and 2024 yielding 14.6%, 47.6%, and 31.2% gains respectively.
Although the broader crypto market is showing early signs of a bear market cycle, investors are wondering whether 2025 will be the year XRP breaks its July profit streak—or continues the trend.
CryptoRank">
Meanwhile, there is growing speculation that XRP could post another double-digit gain this July, especially since four out of its last five July returns have met that mark. Investors are eyeing the opportunity to maximize profits if history repeats itself.
Beyond historical performance, many investors and top analysts have maintained bullish stances on XRP’s outlook.
Recent developments, including the launch of Ripple’s stablecoin and the debut of a U.S.-based XRP ETF, have reignited investor confidence in the once-distressed cryptocurrency.
According to a recent CryptoQuant Quicktake post, Bitcoin (BTC) may be close to completing its price correction for the current market cycle. The premier cryptocurrency appears primed for positive movement in 2025, despite lingering macroeconomic uncertainty.
Bitcoin Looks Ready To Reverse Trend
In a Quicktake post, CryptoQuant contributor Crypto Dan highlighted that BTC is currently undergoing a correction phase similar to the one observed in 2024. The analyst noted that the amount of BTC held for less than one week to one month can serve as an indicator of how “overheated” the crypto market is.
For context, in markets with high speculative activity – such as crypto – price pullbacks tend to be significant. In contrast, markets with lower speculation, like gold, typically experience shallower corrections.
Crypto Dan shared the following chart showing three major phases of the crypto market – a market rally (red arrow), an increase in the ratio of BTC held for less than one week to one month (green pattern), and a subsequent correction (yellow arrow).
He explained that this pattern has played out twice during the current bull market, with both instances showing similarly elevated levels of short-term BTC holdings, suggesting a comparable degree of market overheating.
This ratio has now reached a cycle low, highlighted in the yellow-box region of the chart. Notably, this same region also marked the bottom of the 2024 market cycle.
If the pattern mirrors its behaviour from 2024, it could indicate that the current cycle has also bottomed out. Crypto Dan explained:
In other words, the overheating is now resolved, and although we may need to wait a little longer, with the progress of macroeconomic issues, 2025 is likely to show a positive movement.
Adding to the optimism, a separate post on X by crypto analyst Titan of Crypto also points to a possible shift in momentum. The analyst noted that BTC recently formed a golden cross on the daily chart – a bullish signal that often suggests a trend reversal is underway.
For the uninitiated, a golden cross occurs when Bitcoin’s 50-day moving average crosses above its 200-day moving average, signalling a potential long-term bullish trend. It’s widely seen as a buy signal by traders, indicating growing upward momentum.
BTC Futures Sentiment Index Signals Caution
Despite these bullish signals, not all analysts are convinced. Fellow CryptoQuant contributor abramchart recently observed that BTC’s futures sentiment index has continued to decline since February, suggesting a more cautious outlook among derivatives traders.
Adding to the leading digital asset’s woes, a recent report suggested that China may be preparing to sell a large amount of confiscated BTC, which may increase selling pressure and potentially suppress prices in the short term. At press time, BTC trades at $84,766, down 0.1% in the past 24 hours.
A swirl of bullish proclamations is ricocheting across X as macro‑minded influencers argue that a fresh expansion in “Global M2” money supply will trigger a near‑instant rally in Bitcoin—yet a veteran market analyst is warning that the data underpinning those calls is little more than a mirage.
The latest wave of optimism was set in motion when Real Vision co‑founder Raoul Pal published an updated overlay of Bitcoin versus Global M2—an aggregate of every major country’s broad money supply converted to US‑dollar terms—and told followers, “It is time, give or take a few days.”
Other accounts also shared similar charts. One asserted that Bitcoin “continues to mirror Global M2 with its classic 12‑week lag,” predicting “aggressive upside likely kicks off next week… $74.5 K looks like it was the bottom,” while other self-proclaimed crypto guru promised a new all‑time high “within weeks.”
Bitcoin Vs. M2: Is A Price Explosion Really Coming?
The viral charts drew immediate fire from TXMC (@TXMCtrades). In a lengthy thread he argued that computing a daily or even weekly Global M2 series is “goofy and frankly a scam” because “the United States is only updating M2 on a weekly basis and all others are monthly.” He continued:
“You are looking at basically 30 out of 31 days of FX fluctuations with a static once‑monthly global aggregate multiplied behind it… China, USA, and Japan have even updated into March. The rest are still on February values during a time when the dollar has been tanking hard… You’re looking at an M2‑weighted inverse dollar exchange rate 95% of the time. Be better at math!”
TXMC noted that China now accounts for roughly 46 percent of the putative Global M2 and is “the ONLY major country whose broad money supply is above its post‑covid peak in dollar terms,” a dynamic that “goes straight up” because Beijing is “trying to ease out of an ongoing multi‑year debt deflation.” By contrast, US M2 “is below its 2022 peak… and growing at the slowest pace since Bitcoin’s birth excluding 2022‑24 when it was negative y/y.”
Beyond the cadence mismatch, he blasted the practice of applying “random #‑week offsets” to force a visual correlation between Global M2 and Bitcoin. “These charts are over‑fitted junk using extremely recent history as a thesis for why they should correlate,” he said, adding that while assets can be “directionally sympathetic on a monthly basis… the main critiques relate to presenting a daily/weekly metric using monthly data… AND using over‑fitted offsets of that data to try to forecast the future for a content audience.”
The broadside prompted a rebuttal from YouTuber Colin Talks Crypto (@ColinTCrypto), who claimed that key central banks do in fact provide higher‑frequency figures. “China M2 updates daily—not monthly,” he wrote, attaching what he said were current charts through April 17 2025. “Japan’s M2 also updates daily… Since about half of your post relies on ‘China data being slow and outdated’… your post’s main argument weakens greatly at this point.”
TXMC swiftly countered that assertion, insisting “there is no daily M2” and that any high‑frequency series is merely “a projection of a 1‑2 month old value using real‑time FX values.” The sudden April “pop” in Global M2, he maintained, is nothing more than the dollar’s sharp slide translated mechanically into larger dollar‑denominated money stocks. “Because Global M2 doesn’t actually exist, it is an abstraction of money that lives solely in a chart formula,” he wrote. “It treats all broad aggregates around the world as the same pool of eligible capital and introduces a heap of noise via foreign exchange rates… this is how the sausage is actually made and it’s not sexy.”
At press time, BTC traded at $84,750.
As Bitcoin continues to trade sideways below the $85,000 mark as of April 18, the latest data from on-chain analytics firm Glassnode shows the asset recording significant unrealized losses for short-term holders.
While these short-term holders remain underwater with substantial unrealized losses, the data also indicates that long-term holders are still broadly in profit. However, mounting unrealized losses are putting even these seasoned holders at risk of losing their gains.
Unrealized losses represent the total amount of losses held across all Bitcoin in circulation, calculated from the difference between the average acquisition cost and the current market value.
Bear market already?
As the crypto market moves with caution amid debates about the sustainability of the recent bull run, the rise in unrealized loss per percent drawdown has captured the attention of both retail and institutional investors.
According to the data, repeated price corrections across the broader crypto market have not yet signaled sustainable bullish momentum. Meanwhile, Bitcoin appears to be following a historical bearish pattern observed in previous cycles.
Glassnode revealed that the unrealized losses faced by short-term holders are a direct response to the recent market dips.
Glassnode">
Although these corrections are not as sharp as those in earlier cycles that triggered full-blown bear markets, the resemblance in pattern has sparked speculation that a bearish phase may already be underway.
For long-term holders, the data painted a mixed picture. While they remain largely in profit, they are now vulnerable to absorbing losses if downward momentum persists.
Notably, the increasing number of top Bitcoin buyers maturing into long-term holders could help the market withstand deeper drawdowns.
Although this key metric has historically aligned with bear market confirmations, it alone does not officially define one. Despite these bearish indicators, Bitcoin whales and major investment firms have not slowed down in their accumulation efforts.
US Senator Elizabeth Warren warned that if President Donald Trump eventually moves to fire Federal Reserve Chair Jerome Powell, it could undermine investor confidence in the integrity of US capital markets and trigger a financial crash.
During an appearance on CNBC, the Massachusetts Senator said the President does not have the legal authority to remove Powell from his position. Moreover, removing Powell would weaken the financial infrastructure of the US, Warren added:
"If interest rates in the United States are subject to a president who just wants to wave his magic wand, this doesn't distinguish us from any other two-bit dictatorship," Warren continued.
President Trump has repeatedly called for Powell's termination, citing the chairman's hesitancy to lower interest rates. Lower interest rates are usually considered a positive catalyst for risk-on asset prices, including cryptocurrencies, and could reverse the market downturn brought on by the trade war and current macroeconomic pressures.
Trump's feud with the Federal Reserve chairman
Trump criticized Powell for not cutting interest rates and called for his termination again in an April 17 Truth Social post, which inflamed speculation that he would follow through on threats and find a way to remove the chairman.
Senator Rick Scott echoed Trump's calls to remove Powell. "It’s time to clean house of everyone working at the Federal Reserve who isn’t on board with helping the American people and fighting for their best interests," Scott wrote in an opinion piece published on Fox News.
The Trump administration has repeatedly stated that lowering interest rates is a top priority. Market analyst and investor Anthony Pompliano recently speculated that Trump deliberately crashed financial markets to force lower interest rates.
At the time, Pompliano cited a reduction in the yield of the 10-year US Treasury Bond to just 4%. The 10-year bond yield has climbed back up to 4.3% since then.
The new BitMart listing for Bigcoin (BIG) has the potential to boost its market price. Listing on a well-known exchange increases accessibility and trading volume, bringing more liquidity to the BIG token. Typically, listings can attract both attention and a new user base, potentially driving a short-term price spike as traders explore the new opportunity. The pairing with USDT makes trading easier for a broader audience, aligning with Bigcoin's goal to become widely recognized. This event may serve as a pivotal moment for Bigcoin’s market presence. source
BitMart@BitMartExchangeApr 18, 2025#BitMart is thrilled to announce the primary listing of Bigcoin(BIG)@satoshibigmoto
Bigcoin aims to become the most recognized coin on the planet by combining the proven emission mechanics of Bitcoin with viral, community-driven incentives
Trading pair: $BIG/USDT… pic.twitter.com/pfaF0VNmah
White Label
Data API
Web Plug-ins
Poster Maker
Affiliate Program
The risk of loss in trading financial instruments such as stocks, FX, commodities, futures, bonds, ETFs and crypto can be substantial. You may sustain a total loss of the funds that you deposit with your broker. Therefore, you should carefully consider whether such trading is suitable for you in light of your circumstances and financial resources.
No decision to invest should be made without thoroughly conducting due diligence by yourself or consulting with your financial advisors. Our web content might not suit you since we don't know your financial conditions and investment needs. Our financial information might have latency or contain inaccuracy, so you should be fully responsible for any of your trading and investment decisions. The company will not be responsible for your capital loss.
Without getting permission from the website, you are not allowed to copy the website's graphics, texts, or trademarks. Intellectual property rights in the content or data incorporated into this website belong to its providers and exchange merchants.
Not Logged In
Log in to access more features

FastBull Membership
Not yet
Purchase
Log In
Sign Up