• Trade
  • Markets
  • Copy
  • Contests
  • News
  • 24/7
  • Calendar
  • Q&A
  • Chats
Trending
Screeners
SYMBOL
LAST
BID
ASK
HIGH
LOW
NET CHG.
%CHG.
SPREAD
SPX
S&P 500 Index
6853.38
6853.38
6853.38
6861.30
6847.07
+25.97
+ 0.38%
--
DJI
Dow Jones Industrial Average
48583.67
48583.67
48583.67
48679.14
48557.21
+125.63
+ 0.26%
--
IXIC
NASDAQ Composite Index
23298.22
23298.22
23298.22
23345.56
23265.18
+103.06
+ 0.44%
--
USDX
US Dollar Index
97.850
97.930
97.850
98.070
97.810
-0.100
-0.10%
--
EURUSD
Euro / US Dollar
1.17533
1.17540
1.17533
1.17596
1.17262
+0.00139
+ 0.12%
--
GBPUSD
Pound Sterling / US Dollar
1.33916
1.33923
1.33916
1.33961
1.33546
+0.00209
+ 0.16%
--
XAUUSD
Gold / US Dollar
4327.55
4327.96
4327.55
4350.16
4294.68
+28.16
+ 0.65%
--
WTI
Light Sweet Crude Oil
56.884
56.914
56.884
57.601
56.789
-0.349
-0.61%
--

Community Accounts

Signal Accounts
--
Profit Accounts
--
Loss Accounts
--
View More

Become a signal provider

Sell trading signals to earn additional income

View More

Guide to Copy Trading

Get started with ease and confidence

View More

Signal Accounts for Members

All Signal Accounts

Best Return
  • Best Return
  • Best P/L
  • Best MDD
Past 1W
  • Past 1W
  • Past 1M
  • Past 1Y

All Contests

  • All
  • Trump Updates
  • Recommend
  • Stocks
  • Cryptocurrencies
  • Central Banks
  • Featured News
Top News Only
Share

The Nasdaq Golden Dragon China Index Fell 0.9% In Early Trading

Share

The S&P 500 Opened 32.78 Points Higher, Or 0.48%, At 6860.19; The Dow Jones Industrial Average Opened 136.31 Points Higher, Or 0.28%, At 48594.36; And The Nasdaq Composite Opened 134.87 Points Higher, Or 0.58%, At 23330.04

Share

Miran: Goods Inflation Could Be Settling In At A Higher Level Than Was Normal Before The Pandemic, But That Will Be More Than Offset By Housing Disinflation

Share

Miran, Who Dissented In Favor Of A Larger Cut At Last Fed Meeting, Repeats Keeping Policy Too Tight Will Lead To Job Losses

Share

Miran: Does Not Think Higher Goods Inflation Is Mostly From Tariffs, But Acknowledges Does Not Have A Full Explanation For It

Share

Toronto Stock Index .GSPTSE Rises 67.16 Points, Or 0.21 Percent, To 31594.55 At Open

Share

Miran: Excluding Housing And Non-Market Based Items, Core Pce Inflation May Be Below 2.3%, “Within Noise” Of The Fed's 2% Target

Share

Polish State Assets Minister Balczun Says Jsw Needs Over USD 830 Million Financing To Keep Liquidity For A Year

Share

Miran: Prices Are “Once Again Stable” And Monetary Policy Should Reflect That

Share

Fed's Miran: Current Excess Inflation Is Not Reflective Of Underlying Supply And Demand In The Economy

Share

Portugal Treasury Puts 2026 Net Financing Needs At 13 Billion Euros, Up From 10.8 Billion In 2025

Share

Portugal Treasury Expects 2026 Net Financing Needs At 29.4 Billion Euros, Up From 25.8 Billion In 2025

Share

Bank Of America Says With Indonesia's Smelter Now Ramping Up, It Expects Aluminium Supply Growth To Accelerate To 2.6% Year On Year In 2026

Share

Bank Of America Expects A Deficit In Aluminium Next Year And Sees Prices Pushing Above $3000/T

Share

Fed Data - USA Effective Federal Funds Rate At 3.64 Percent On 12 December On $102 Billion In Trades Versus 3.64 Percent On $99 Billion On 11 December

Share

Brazil's Petrobras Says No Impact Seen On Oil, Petroleum Products Output As Workers Start Planned Strike

Share

Statement: US Travel Group Warns New Proposed Trump Administration Requirements For Foreign Tourists To Provide Social Media Histories Could Mean Millions Of People Opting Not To Visit

Share

Blackrock: Kerry White Will Become Head Of Citi Investment Management At Citi Wealth

Share

Blackrock: Rob Jasminski, Head Of Citi Investment Management, Has Joined With Team

Share

Blackrock: Effective Dec 15, Citi Investment Management Employees Will Join Blackrock

TIME
ACT
FCST
PREV
Japan Tankan Small Manufacturing Outlook Index (Q4)

A:--

F: --

P: --

Japan Tankan Large Non-Manufacturing Outlook Index (Q4)

A:--

F: --

P: --

Japan Tankan Large Manufacturing Outlook Index (Q4)

A:--

F: --

P: --

Japan Tankan Small Manufacturing Diffusion Index (Q4)

A:--

F: --

P: --

Japan Tankan Large Manufacturing Diffusion Index (Q4)

A:--

F: --

P: --

Japan Tankan Large-Enterprise Capital Expenditure YoY (Q4)

A:--

F: --

P: --

U.K. Rightmove House Price Index YoY (Dec)

A:--

F: --

P: --

China, Mainland Industrial Output YoY (YTD) (Nov)

A:--

F: --

P: --

China, Mainland Urban Area Unemployment Rate (Nov)

A:--

F: --

P: --

Saudi Arabia CPI YoY (Nov)

A:--

F: --

P: --

Euro Zone Industrial Output YoY (Oct)

A:--

F: --

P: --

Euro Zone Industrial Output MoM (Oct)

A:--

F: --

P: --

Canada Existing Home Sales MoM (Nov)

A:--

F: --

P: --

Canada National Economic Confidence Index

A:--

F: --

P: --

Canada New Housing Starts (Nov)

A:--

F: --

P: --
U.S. NY Fed Manufacturing Employment Index (Dec)

A:--

F: --

P: --

U.S. NY Fed Manufacturing Index (Dec)

A:--

F: --

P: --

Canada Core CPI YoY (Nov)

A:--

F: --

P: --

Canada Manufacturing Unfilled Orders MoM (Oct)

A:--

F: --

P: --

U.S. NY Fed Manufacturing Prices Received Index (Dec)

A:--

F: --

P: --

U.S. NY Fed Manufacturing New Orders Index (Dec)

A:--

F: --

P: --

Canada Manufacturing New Orders MoM (Oct)

A:--

F: --

P: --

Canada Core CPI MoM (Nov)

A:--

F: --

P: --

Canada Trimmed CPI YoY (SA) (Nov)

A:--

F: --

P: --

Canada Manufacturing Inventory MoM (Oct)

A:--

F: --

P: --

Canada CPI YoY (Nov)

A:--

F: --

P: --

Canada CPI MoM (Nov)

A:--

F: --

P: --

Canada CPI YoY (SA) (Nov)

A:--

F: --

P: --

Canada Core CPI MoM (SA) (Nov)

A:--

F: --

P: --

Canada CPI MoM (SA) (Nov)

A:--

F: --

P: --

Federal Reserve Board Governor Milan delivered a speech
U.S. NAHB Housing Market Index (Dec)

--

F: --

P: --

Australia Composite PMI Prelim (Dec)

--

F: --

P: --

Australia Services PMI Prelim (Dec)

--

F: --

P: --

Australia Manufacturing PMI Prelim (Dec)

--

F: --

P: --

Japan Manufacturing PMI Prelim (SA) (Dec)

--

F: --

P: --

U.K. 3-Month ILO Employment Change (Oct)

--

F: --

P: --

U.K. Unemployment Claimant Count (Nov)

--

F: --

P: --

U.K. Unemployment Rate (Nov)

--

F: --

P: --

U.K. 3-Month ILO Unemployment Rate (Oct)

--

F: --

P: --

U.K. Average Weekly Earnings (3-Month Average, Including Bonuses) YoY (Oct)

--

F: --

P: --

U.K. Average Weekly Earnings (3-Month Average, Excluding Bonuses) YoY (Oct)

--

F: --

P: --

France Services PMI Prelim (Dec)

--

F: --

P: --

France Composite PMI Prelim (SA) (Dec)

--

F: --

P: --

France Manufacturing PMI Prelim (Dec)

--

F: --

P: --

Germany Services PMI Prelim (SA) (Dec)

--

F: --

P: --

Germany Manufacturing PMI Prelim (SA) (Dec)

--

F: --

P: --

Germany Composite PMI Prelim (SA) (Dec)

--

F: --

P: --

Euro Zone Composite PMI Prelim (SA) (Dec)

--

F: --

P: --

Euro Zone Services PMI Prelim (SA) (Dec)

--

F: --

P: --

Euro Zone Manufacturing PMI Prelim (SA) (Dec)

--

F: --

P: --

U.K. Services PMI Prelim (Dec)

--

F: --

P: --

U.K. Manufacturing PMI Prelim (Dec)

--

F: --

P: --

U.K. Composite PMI Prelim (Dec)

--

F: --

P: --

Euro Zone ZEW Economic Sentiment Index (Dec)

--

F: --

P: --

Germany ZEW Current Conditions Index (Dec)

--

F: --

P: --

Germany ZEW Economic Sentiment Index (Dec)

--

F: --

P: --

Euro Zone Trade Balance (Not SA) (Oct)

--

F: --

P: --

Euro Zone ZEW Current Conditions Index (Dec)

--

F: --

P: --

Euro Zone Trade Balance (SA) (Oct)

--

F: --

P: --

U.S. Retail Sales MoM (Excl. Automobile) (SA) (Oct)

--

F: --

P: --

Q&A with Experts
    • All
    • Chatrooms
    • Groups
    • Friends
    Connecting
    .
    .
    .
    Type here...
    Add Symbol or Code

      No matching data

      All
      Trump Updates
      Recommend
      Stocks
      Cryptocurrencies
      Central Banks
      Featured News
      • All
      • Russia-Ukraine Conflict
      • Middle East Flashpoint
      • All
      • Russia-Ukraine Conflict
      • Middle East Flashpoint
      Search
      Products

      Charts Free Forever

      Chats Q&A with Experts
      Screeners Economic Calendar Data Tools
      Membership Features
      Data Warehouse Market Trends Institutional Data Policy Rates Macro

      Market Trends

      Market Sentiment Order Book Forex Correlations

      Top Indicators

      Charts Free Forever
      Markets

      News

      News Analysis 24/7 Columns Education
      From Institutions From Analysts
      Topics Columnists

      Latest Views

      Latest Views

      Trending Topics

      Top Columnists

      Latest Update

      Signals

      Copy Rankings Latest Signals Become a signal provider AI Rating
      Contests
      Brokers

      Overview Brokers Assessment Rankings Regulators News Claims
      Broker listing Forex Brokers Comparison Tool Live Spread Comparison Scam
      Q&A Complaint Scam Alert Videos Tips to Detect Scam
      More

      Business
      Events
      Careers About Us Advertising Help Center

      White Label

      Data API

      Web Plug-ins

      Affiliate Program

      Awards Institution Evaluation IB Seminar Salon Event Exhibition
      Vietnam Thailand Singapore Dubai
      Fans Party Investment Sharing Session
      FastBull Summit BrokersView Expo
      Recent Searches
        Top Searches
          Markets
          News
          Analysis
          User
          24/7
          Economic Calendar
          Education
          Data
          • Names
          • Latest
          • Prev

          View All

          No data

          Scan to Download

          Faster Charts, Chat Faster!

          Download App
          English
          • English
          • Español
          • العربية
          • Bahasa Indonesia
          • Bahasa Melayu
          • Tiếng Việt
          • ภาษาไทย
          • Français
          • Italiano
          • Türkçe
          • Русский язык
          • 简中
          • 繁中
          Open Account
          Search
          Products
          Charts Free Forever
          Markets
          News
          Signals

          Copy Rankings Latest Signals Become a signal provider AI Rating
          Contests
          Brokers

          Overview Brokers Assessment Rankings Regulators News Claims
          Broker listing Forex Brokers Comparison Tool Live Spread Comparison Scam
          Q&A Complaint Scam Alert Videos Tips to Detect Scam
          More

          Business
          Events
          Careers About Us Advertising Help Center

          White Label

          Data API

          Web Plug-ins

          Affiliate Program

          Awards Institution Evaluation IB Seminar Salon Event Exhibition
          Vietnam Thailand Singapore Dubai
          Fans Party Investment Sharing Session
          FastBull Summit BrokersView Expo

          Cardano Price Breaks Key Resistance, Targets $1.20 Amid Governance Boost?

          Coinpedia
          Realio Network / Tether
          -3.52%
          1inch / Tether
          -2.20%
          Vaulta / Tether
          -2.51%
          AAVE / Tether
          +1.64%

          Cardano price is showing renewed strength, rising 4.06% in the past 24 hours to $0.9587 and gaining nearly 19% over the week. With a $34.12 billion market cap, the trading volume has sunk 40% to $3.51 billion as profit-taking sets in. Wondering why is Cardano making buzz again? And how far will ADA price go in the short term? Read this analysis for all details.

          What’s Driving ADA Price Higher?

          Governance momentum: The Cardano Foundation has approved ₳605k ($571k) to subsidize a content-delivery network for developers. Thereby, signaling faster and more efficient decentralized decision-making. Projects like Eternl and Vespr wallets already use this infrastructure, which could drive broader dApp adoption and network utility.

          ETF speculation: Grayscale has filed Delaware trust registrations for a potential ADA ETF. Which vouches its strategy before launching its Bitcoin and Ethereum trusts. Although SEC approval is uncertain, the move highlights rising institutional interest, with Grayscale’s Smart Contract Fund already allocating 20% to ADA.

          Cardano Price Analysis

          ADA price has cleared the $0.84–$0.89 resistance band, which was supported by a 14-day RSI at 71.45 and a positive MACD histogram of +0.0167. This breakout invalidates a multi-month descending channel that had capped price since mid-2022. Historically, similar patterns have preceded major rallies, including the 3,000% move during 2020–2021.

          ADA Price Analysis 16-8-25

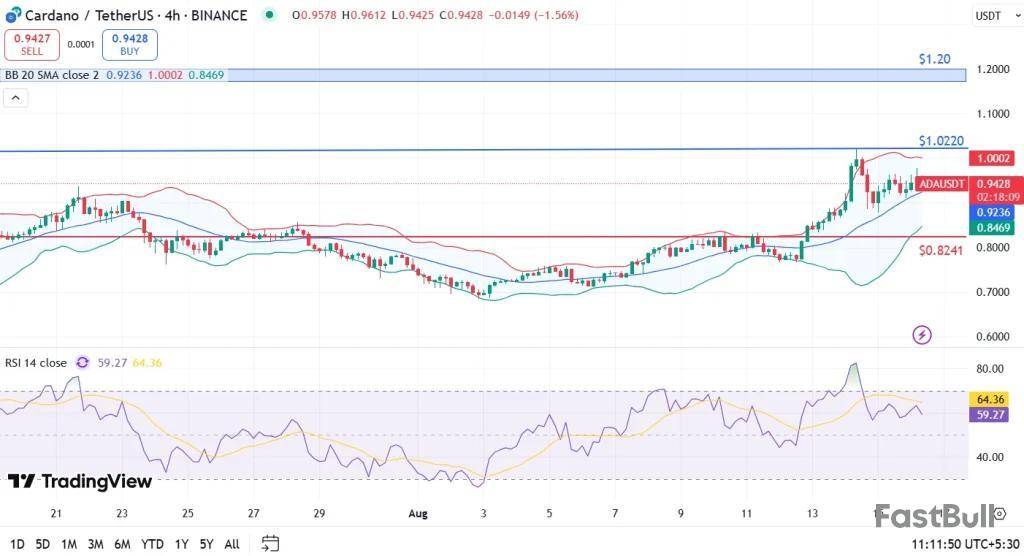
          That being said, the immediate upside target for ADA price sits at $1.02. In line with short-term Fibonacci levels, with $1.20 as an extended objective if momentum holds. The current price action on the 4-hour chart shows ADA consolidating at $0.9428, just below the resistance after hitting a daily high of $0.9753. Support has formed at $0.8241, which now serves as a key invalidation level.

          Despite bullish momentum, a declining intraday trading volume indicates some caution among traders. A failure to hold above $0.90 could invite a pullback toward the mid-$0.80s before any further rally.

          FAQs

          What is Cardano’s next resistance level?

          Key resistance lies at $1.02, with an extended target near $1.20 if bullish momentum continues.

          How low can the ADA price fall?

          The major support sits at $0.82–$0.84. A breakdown below this could weaken the uptrend.

          What could drive ADA’s price in the coming weeks?

          Network upgrades, ETF speculation, and developer adoption of new governance initiatives are likely catalysts.

          Risk Warnings and Disclaimers
          You understand and acknowledge that there is a high degree of risk involved in trading. Following any strategies or investment methods may lead to potential losses. The content on the site is provided by our contributors and analysts for information purposes only. You are solely responsible for determining whether any trading assets, securities, strategy, or any other product is suitable for investing based on your own investment objectives and financial situation.
          Add to Favorites
          Share

          Bitcoin Holds Steady While Hash Rate Climbs to ATH; $125K Target Imminent After a Breakout

          Coinpedia
          Realio Network / Tether
          -3.52%
          1inch / Tether
          -2.20%
          Vaulta / Tether
          -2.51%
          AAVE / Tether
          +1.64%

          Bitcoin’s price has entered a consolidation phase, holding steady after its strong rally to new highs earlier this year. This “pause” is typical after big rallies, as traders take profits and new catalysts are awaited. Consolidation phases often precede major breakouts, making this a crucial period for both short-term traders and long-term holders. While traders debate whether the next move will be upward or downward, another critical metric is quietly surging: the Bitcoin network hash rate has been setting new all-time highs. This divergence between price and network strength has caught the attention of analysts and long-term investors alike.

          Hash Rate Soars to Record Levels

          In contrast to the sideways price action, Bitcoin’s hash rate continues to climb, reaching unprecedented levels. The hash rate measures the computational power securing the network—essentially the combined strength of all miners. A rising hash rate means more miners are dedicating resources, improving security and showing confidence in Bitcoin’s long-term profitability.

          Historically, surging hash rate has often followed periods of price growth, as higher BTC prices attract new mining investment. Importantly, miners tend to think long-term, so continued growth in hash rate during price consolidation signals underlying optimism in Bitcoin’s future value.

          Historical Perspective: Price Leads, Hash Rate Follows

          Looking back, Bitcoin’s hash rate and price show a strong correlation—often above 70% on multi-year scales. However, the relationship isn’t perfectly aligned:

          • Price usually leads, as higher profitability encourages new miners to join.
          • Hash rate lags due to the time required to set up equipment and infrastructure.
          • Divergences happen, such as during the 2021 China mining ban, which caused a sharp hash rate drop despite strong prices.

          Still, whenever the hash rate kept climbing during price consolidation (e.g., 2019–2020), it was often a precursor to major bull runs.

          What This Means for Bitcoin Today

          The current setup—sideways price with record-high hash rate—can be interpreted as follows:

          • Network Fundamentals Stronger than Ever: Bitcoin is more secure and resilient with each high hash rate.
          • Miner Confidence Signals Long-Term Bullishness: Miners wouldn’t pour capital into hardware and electricity if they expected sustained price weakness.
          • Potential Breakout Ahead: Historically, similar divergences have preceded major upward price movements.

          Bitcoin Price Analysis: Will BTC Price Rise Back to $130K?

          Although the price faces a minor correction, breaking the local support, the token remains within the pattern. Bitcoin bulls are leaving no stone unturned in defending the pivotal support around $116,500. Currently, the price has rebounded from the lows below $117,000; however, a rise above a certain range could validate a rise above the bearish influence.

          BTC price

          As seen in the above chart, the BTC price continues to trade within a rising wedge, and the latest correction has dragged the levels below an important resistance zone between $120,000 and $120,800. The price is finding its support on the BMSB (Bull Market Support Band), which is formed by the 20-week SMA & 21-week EMA. During a bull market, the price is expected to remain above the support level; however, if it dips below the range, it is viewed as a buying opportunity.

          Meanwhile, the MACD indicates a decline in buying pressure, and the lines are trending toward a bearish crossover. Therefore, there is a huge possibility of the price breaking the wedge and testing the support at $115,200. However, this may result in a rebound as the miners are showing huge confidence in the Bitcoin price rally.

          Bitcoin’s current consolidation could be frustrating for short-term traders, but the surging hash rate tells a different story: the fundamentals are stronger than ever. If history repeats, this miner-driven show of confidence could be a leading indicator of the next breakout.

          Risk Warnings and Disclaimers
          You understand and acknowledge that there is a high degree of risk involved in trading. Following any strategies or investment methods may lead to potential losses. The content on the site is provided by our contributors and analysts for information purposes only. You are solely responsible for determining whether any trading assets, securities, strategy, or any other product is suitable for investing based on your own investment objectives and financial situation.
          Add to Favorites
          Share

          Fact Check: Is Google Getting Into Bitcoin Mining Through TeraWulf?

          Coinpedia
          Realio Network / Tether
          -3.52%
          1inch / Tether
          -2.20%
          Vaulta / Tether
          -2.51%
          AAVE / Tether
          +1.64%

          A headline is making waves in the crypto world as Google reportedly acquires an 8% stake in Bitcoin miner TeraWulf in a $3.7 billion deal. Many in the crypto community are claiming that Google has officially entered the Bitcoin mining space.

          So, what’s the truth behind the news? 

          Here’s a detailed, fact-checked breakdown.

          Where Did the News Come From?

          On August 14, 2025, multiple well-known news outlets and many social media users reported that Google had acquired an 8% equity stake in TeraWulf, a publicly traded Bitcoin mining and digital infrastructure company.

          Let’s break down exactly what happened, why it matters.

          What Actually Happened?

          1. The Deal’s Structure:

          In an official announcement from TeraWulf, a company that signed long-term deals with Fluidstack, an AI cloud platform, to provide over 200 megawatts (MW) of computing power from its Lake Mariner data center in New York, one of the largest AI/crypto infrastructure pivots ever seen.

          Google is not directly buying Bitcoin mining hardware or operating mines.

          Instead, Google is providing a $1.8 billion financial backstop to help Fluidstack pay for its colocation agreements and capital needs. In exchange, Google receives warrants (rights to buy shares) for about 41 million TeraWulf shares—equaling around 8% of the company if fully exercised.

          Why Is the Stake Important?

          The deal instantly makes Google a top institutional player in the emerging overlap of AI computation and crypto infrastructure.

          TeraWulf’s pivot reflects an industry-wide move from pure mining toward diversified high-profit workloads like AI training, which use the same power and cooling resources as crypto mining.

          Summary Table: Coinpedia’s Evidence

          ClaimCoinpedia’s Evidence & Facts
          Google acquired 8% of BTC miner TeraWulf in $ a $3.7B deal✅ True; via warrants, as part of a $1.8B financial backstop for AI/HPC project
          Google paid $3.7 billion directly for the TeraWulf stake❌ False; this is the total project value, not the direct investment for shares
          Deal is for Bitcoin mining expansion❌ False; focus is high-performance AI hosting—not expanding Bitcoin mining

          Conclusion

          Google’s 8% stake in TeraWulf came not from a direct crypto buyout, but as part of a high-stakes bet on the explosive intersection of AI and digital infrastructure.

          The main focus of this partnership is on high-powered AI computing and hosting, not on increasing TeraWulf’s BTC mining operations.

          Risk Warnings and Disclaimers
          You understand and acknowledge that there is a high degree of risk involved in trading. Following any strategies or investment methods may lead to potential losses. The content on the site is provided by our contributors and analysts for information purposes only. You are solely responsible for determining whether any trading assets, securities, strategy, or any other product is suitable for investing based on your own investment objectives and financial situation.
          Add to Favorites
          Share

          What Are Ripple Whales Doing During This XRP Price Dip?

          CryptoPotato
          Realio Network / Tether
          -3.52%
          1inch / Tether
          -2.20%
          Vaulta / Tether
          -2.51%
          AAVE / Tether
          +1.64%

          TL;DR

          120 million $XRP bought up by whales on the dip! pic.twitter.com/pU8BKXKRKx

          — Ali (@ali_charts) August 15, 2025

          Whales are among the most significant players in the cryptocurrency markets, as their moves are usually substantial and impactful. After all, they have the ability to shake the underlying assets with massive purchases or sales.

          XRP investors could be hopeful in this regard as Ripple whales seem to be determined to acquire as much of the token’s circulating supply as possible, according to the most recent data.

          As Ali Martinez shared, they accumulated over $360 million worth of XRP during the most recent dip. However, that’s not all, as they have been on a buying spree for the past few weeks. Asreportedbefore, they had purchased another 320 million XRP (valued at roughly $1 billion) in the span of just three days.

          Such substantial acquisitions not only reduce the circulating supply but could also serve as an example to smaller investors that might follow suit and jump on the XRP bandwagon.

          The price of Ripple’s token has calmed in the past few weeks after going through an explosive July. At the time, itsoaredfrom under $2.30 to mark a new all-time high in the middle of the month at over $3.65 before it slumped back down toward $2.70.

          However, the past ten days or so have been less volatile as XRP has found itself in a tight range between $3.00 and $3.30. It tested the lower boundary on a couple of occasions in the past 36 hours, but the bulls stepped up and managed to defend it.

          According to Martinez, the upper boundary is at $3.26, and a break above it could send the asset flying to a new all-time high of $3.90.

          $XRP consolidates in a triangle! A break above $3.26 could send it to $3.90. pic.twitter.com/9MmLhcofSF

          — Ali (@ali_charts) August 15, 2025

          Risk Warnings and Disclaimers
          You understand and acknowledge that there is a high degree of risk involved in trading. Following any strategies or investment methods may lead to potential losses. The content on the site is provided by our contributors and analysts for information purposes only. You are solely responsible for determining whether any trading assets, securities, strategy, or any other product is suitable for investing based on your own investment objectives and financial situation.
          Add to Favorites
          Share

          Bitcoin Price Unshaken Even as Trump-Putin Peace Meeting Fails

          CryptoPotato
          Realio Network / Tether
          -3.52%
          1inch / Tether
          -2.20%
          Vaulta / Tether
          -2.51%
          AAVE / Tether
          +1.64%

          The greatly anticipated meeting at the highest levels between the presidents of the United States and Russia failed to reach a conclusion regarding a ceasefire between Ukraine and the world’s largest country by landmass.

          Nevertheless, Trump said both parties made some good progress on a few points, while Putin categorized the meeting as a “starting point.”

          This was the first time in almost a decade that the Russian leader set foot on US soil when he attended the UN General Assembly in New York City and met then-President Obama.

          “There were many, many points that we agreed on … I would say a couple of big ones that we haven’t quite got there, but we’ve made some headway,” Trump said at a joint press conference.

          Putin said the relationship between the two Great Powers has deteriorated to the “lowest point since the Cold War,” but noted that these talks can be considered a “starting point” for improving it.

          Before the meeting, Ukrainian President Volodymyr Zelenskyy expressed disappointment that his country would not be represented, as many feared that a potential deal could compromise its sovereignty.

          “Ukraine is ready to work as productively as possible to bring the war to an end, and we count on a strong position from America … A meeting of leaders is needed – at the very least, Ukraine, America, and the Russian side.”

          Given the potential significance of the meeting, many expertsanticipated a volatile crypto market, especially since it took place after Wall Street had closed for the day.

          However, this wasn’t the case. Bitcoin’s price had slipped ahead of the meeting to just under $117,000 but stopped its nosedive even as both parties failed to reach a peace conclusion. As of press time, BTC has neared $118,000 once again.

          The cryptocurrency was impacted a lot more by the hot PPI data that came out the day before, as itdroppedfrom itsall-time high of $124,500to under $118,000 within hours.

          Risk Warnings and Disclaimers
          You understand and acknowledge that there is a high degree of risk involved in trading. Following any strategies or investment methods may lead to potential losses. The content on the site is provided by our contributors and analysts for information purposes only. You are solely responsible for determining whether any trading assets, securities, strategy, or any other product is suitable for investing based on your own investment objectives and financial situation.
          Add to Favorites
          Share

          Lemmy The Bat (LBAI) - XT.COM Listing - 17 Aug 2025

          CoinMarketCal
          Realio Network / Tether
          -3.52%
          1inch / Tether
          -2.20%
          Vaulta / Tether
          -2.51%
          AAVE / Tether
          +1.64%

          Lemmy The Bat will get listed on XT.COM, a global crypto exchange. New listings often bring in new buyers, which can push the LBAI price up, at least for a short time. If there is strong interest from XT.COM’s users, the price may jump in the first hours or days. However, after the first excitement, prices may drop if traders sell for quick profit. Listings are usually big news for smaller tokens. Watch trading volume closely. More info here: source.

          XT Exchange #BeyondTrade
          @XTexchange

          New Listing #XTListing @lbai_lemmy

          #XT will list $LBAI (Lemmy The Bat).

          Deposit: 12:00 on August 16, 2025 (UTC)

          Trading: 12:00 on August 17, 2025 (UTC)

          Withdrawal: 12:00 on August 18, 2025 (UTC)

          Get ready for trading ️https://t.co/NK8mgwoj07 pic.twitter.com/BQU3IyOTXM

          Aug 16, 2025
          Risk Warnings and Disclaimers
          You understand and acknowledge that there is a high degree of risk involved in trading. Following any strategies or investment methods may lead to potential losses. The content on the site is provided by our contributors and analysts for information purposes only. You are solely responsible for determining whether any trading assets, securities, strategy, or any other product is suitable for investing based on your own investment objectives and financial situation.
          Add to Favorites
          Share

          Flare (FLR) - FAssets V1.2 Launch - 20 Aug 2025

          CoinMarketCal
          Realio Network / Tether
          -3.52%
          1inch / Tether
          -2.20%
          Vaulta / Tether
          -2.51%
          AAVE / Tether
          +1.64%

          Flare is launching FAssets V1.2 after finishing a strong security check. Updates like this can help the price go up, because they show trust and growth. If the new version works well, more developers and users may use Flare. However, during the upgrade, some features will stop for about 8 hours, which could cause short-term worries. If the upgrade goes without problems, the price could move higher. But if there are bugs, some traders may lose trust. Read more here: source.

          Flare ️
          @FlareNetworks

          We are preparing to launch FAssets v1.2 on Songbird next week.

          This launch is part of our multi-layered security process. We've completed the @zellic_io audit and have high confidence in the code's robustness based on internal reviews. The final Zellic audit report is…

          Aug 15, 2025
          Risk Warnings and Disclaimers
          You understand and acknowledge that there is a high degree of risk involved in trading. Following any strategies or investment methods may lead to potential losses. The content on the site is provided by our contributors and analysts for information purposes only. You are solely responsible for determining whether any trading assets, securities, strategy, or any other product is suitable for investing based on your own investment objectives and financial situation.
          Add to Favorites
          Share
          FastBull
          Copyright © 2025 FastBull Ltd

          728 RM B 7/F GEE LOK IND BLDG NO 34 HUNG TO RD KWUN TONG KLN HONG KONG

          TelegramInstagramTwitterfacebooklinkedin
          App Store Google Play Google Play
          Products
          Charts

          Chats

          Q&A with Experts
          Screeners
          Economic Calendar
          Data
          Tools
          Membership
          Features
          Function
          Markets
          Copy Trading
          Latest Signals
          Contests
          News
          Analysis
          24/7
          Columns
          Education
          Company
          Careers
          About Us
          Contact Us
          Advertising
          Help Center
          Feedback
          User Agreement
          Privacy Policy
          Business

          White Label

          Data API

          Web Plug-ins

          Poster Maker

          Affiliate Program

          Risk Disclosure

          The risk of loss in trading financial instruments such as stocks, FX, commodities, futures, bonds, ETFs and crypto can be substantial. You may sustain a total loss of the funds that you deposit with your broker. Therefore, you should carefully consider whether such trading is suitable for you in light of your circumstances and financial resources.

          No decision to invest should be made without thoroughly conducting due diligence by yourself or consulting with your financial advisors. Our web content might not suit you since we don't know your financial conditions and investment needs. Our financial information might have latency or contain inaccuracy, so you should be fully responsible for any of your trading and investment decisions. The company will not be responsible for your capital loss.

          Without getting permission from the website, you are not allowed to copy the website's graphics, texts, or trademarks. Intellectual property rights in the content or data incorporated into this website belong to its providers and exchange merchants.

          Not Logged In

          Log in to access more features

          FastBull Membership

          Not yet

          Purchase

          Become a signal provider
          Help Center
          Customer Service
          Dark Mode
          Price Up/Down Colors

          Log In

          Sign Up

          Position
          Layout
          Fullscreen
          Default to Chart
          The chart page opens by default when you visit fastbull.com