Markets
News
Analysis
User
24/7
Economic Calendar
Education
Data
- Names
- Latest
- Prev


Signal Accounts for Members
All Signal Accounts
All Contests


Japan Tankan Small Manufacturing Outlook Index (Q4)A:--
F: --
P: --
Japan Tankan Large Non-Manufacturing Outlook Index (Q4)A:--
F: --
P: --
Japan Tankan Large Manufacturing Outlook Index (Q4)A:--
F: --
P: --
Japan Tankan Small Manufacturing Diffusion Index (Q4)A:--
F: --
P: --
Japan Tankan Large Manufacturing Diffusion Index (Q4)A:--
F: --
P: --
Japan Tankan Large-Enterprise Capital Expenditure YoY (Q4)A:--
F: --
P: --
U.K. Rightmove House Price Index YoY (Dec)A:--
F: --
P: --
China, Mainland Industrial Output YoY (YTD) (Nov)A:--
F: --
P: --
China, Mainland Urban Area Unemployment Rate (Nov)A:--
F: --
P: --
Saudi Arabia CPI YoY (Nov)A:--
F: --
P: --
Euro Zone Industrial Output YoY (Oct)A:--
F: --
P: --
Euro Zone Industrial Output MoM (Oct)A:--
F: --
P: --
Canada Existing Home Sales MoM (Nov)A:--
F: --
P: --
Canada National Economic Confidence IndexA:--
F: --
P: --
Canada New Housing Starts (Nov)A:--
F: --
U.S. NY Fed Manufacturing Employment Index (Dec)A:--
F: --
P: --
U.S. NY Fed Manufacturing Index (Dec)A:--
F: --
P: --
Canada Core CPI YoY (Nov)A:--
F: --
P: --
Canada Manufacturing Unfilled Orders MoM (Oct)A:--
F: --
P: --
U.S. NY Fed Manufacturing Prices Received Index (Dec)A:--
F: --
P: --
U.S. NY Fed Manufacturing New Orders Index (Dec)A:--
F: --
P: --
Canada Manufacturing New Orders MoM (Oct)A:--
F: --
P: --
Canada Core CPI MoM (Nov)A:--
F: --
P: --
Canada Trimmed CPI YoY (SA) (Nov)A:--
F: --
P: --
Canada Manufacturing Inventory MoM (Oct)A:--
F: --
P: --
Canada CPI YoY (Nov)A:--
F: --
P: --
Canada CPI MoM (Nov)A:--
F: --
P: --
Canada CPI YoY (SA) (Nov)A:--
F: --
P: --
Canada Core CPI MoM (SA) (Nov)A:--
F: --
P: --
Canada CPI MoM (SA) (Nov)A:--
F: --
P: --
Federal Reserve Board Governor Milan delivered a speech
U.S. NAHB Housing Market Index (Dec)--
F: --
P: --
Australia Composite PMI Prelim (Dec)--
F: --
P: --
Australia Services PMI Prelim (Dec)--
F: --
P: --
Australia Manufacturing PMI Prelim (Dec)--
F: --
P: --
Japan Manufacturing PMI Prelim (SA) (Dec)--
F: --
P: --
U.K. 3-Month ILO Employment Change (Oct)--
F: --
P: --
U.K. Unemployment Claimant Count (Nov)--
F: --
P: --
U.K. Unemployment Rate (Nov)--
F: --
P: --
U.K. 3-Month ILO Unemployment Rate (Oct)--
F: --
P: --
U.K. Average Weekly Earnings (3-Month Average, Including Bonuses) YoY (Oct)--
F: --
P: --
U.K. Average Weekly Earnings (3-Month Average, Excluding Bonuses) YoY (Oct)--
F: --
P: --
France Services PMI Prelim (Dec)--
F: --
P: --
France Composite PMI Prelim (SA) (Dec)--
F: --
P: --
France Manufacturing PMI Prelim (Dec)--
F: --
P: --
Germany Services PMI Prelim (SA) (Dec)--
F: --
P: --
Germany Manufacturing PMI Prelim (SA) (Dec)--
F: --
P: --
Germany Composite PMI Prelim (SA) (Dec)--
F: --
P: --
Euro Zone Composite PMI Prelim (SA) (Dec)--
F: --
P: --
Euro Zone Services PMI Prelim (SA) (Dec)--
F: --
P: --
Euro Zone Manufacturing PMI Prelim (SA) (Dec)--
F: --
P: --
U.K. Services PMI Prelim (Dec)--
F: --
P: --
U.K. Manufacturing PMI Prelim (Dec)--
F: --
P: --
U.K. Composite PMI Prelim (Dec)--
F: --
P: --
Euro Zone ZEW Economic Sentiment Index (Dec)--
F: --
P: --
Germany ZEW Current Conditions Index (Dec)--
F: --
P: --
Germany ZEW Economic Sentiment Index (Dec)--
F: --
P: --
Euro Zone Trade Balance (Not SA) (Oct)--
F: --
P: --
Euro Zone ZEW Current Conditions Index (Dec)--
F: --
P: --
Euro Zone Trade Balance (SA) (Oct)--
F: --
P: --
U.S. Retail Sales MoM (Excl. Automobile) (SA) (Oct)--
F: --
P: --


No matching data
Latest Views
Latest Views
Trending Topics
Top Columnists
Latest Update
White Label
Data API
Web Plug-ins
Affiliate Program
View All

No data
Brighthouse Financial, Inc. BHF reported second-quarter 2025 adjusted earnings of $3.43 per share, which missed the Zacks Consensus Estimate by 27%. The bottom line declined 38.4% year over year.
The lower-than-expected results for the quarter were due to a combination of reduced premiums and lower net investment income, partially offset by a decline in total expenses.
Behind the Headlines
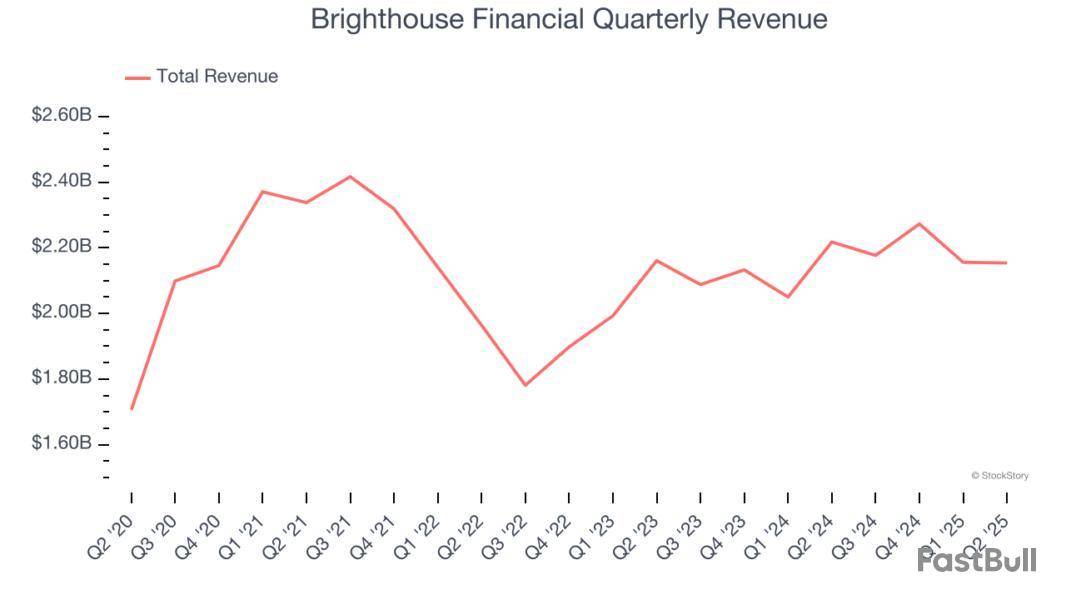
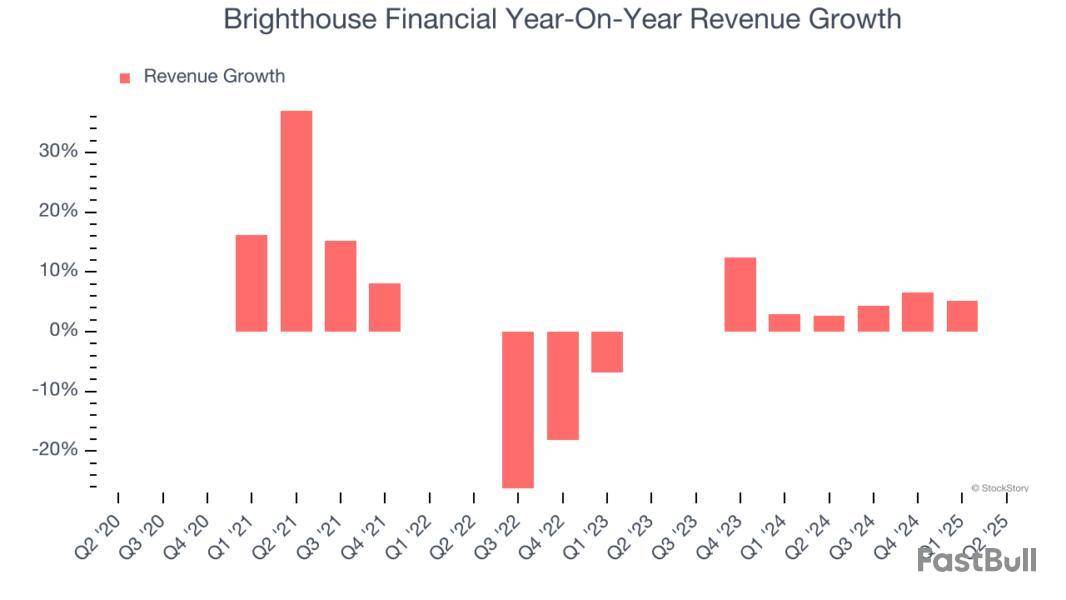
Total operating revenues of $2.2 billion decreased 2.9% year over year, due to lower universal life and investment-type product policy fees and net investment income. The top line missed the consensus estimate by 2.1%.
Brighthouse Financial, Inc. Price, Consensus and EPS Surprise
Brighthouse Financial, Inc. price-consensus-eps-surprise-chart | Brighthouse Financial, Inc. Quote
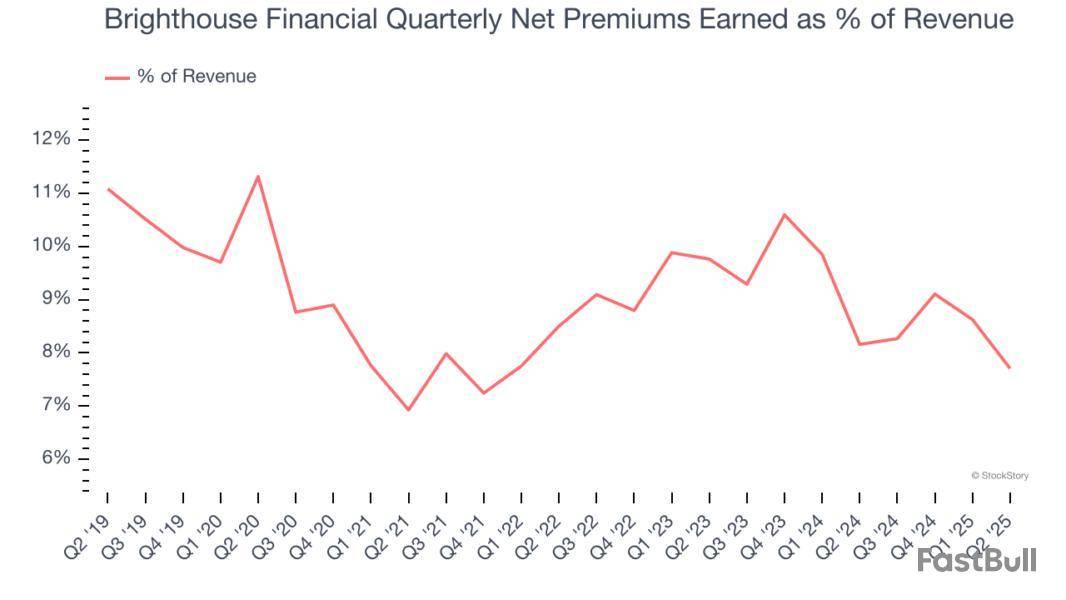
Premiums of $166 million decreased 8.3% year over year. The Zacks consensus Estimate was $200 million, and our estimate was $248.8 million.
Adjusted net investment income was $1.3 billion in the quarter under review, down 1.8% year over year, primarily due to lower income from alternative investments. The investment income yield was 4.28%.
Total expenses were $778 million, which dropped nearly 45% from $1.4 billion year over year. Our estimate was $1.7 billion. Corporate expenses, pretax, were $202 million, inching up 1% year over year.
Quarterly Segmental Update of BHF
Annuities recorded an adjusted operating income of $332 million, which remained flat year over year. Annuity sales increased 8.4% year over year to $2.6 billion, mainly supported by stronger fixed annuity sales, partially offset by a decline in Shield Level Annuity sales.
Life’s adjusted operating loss was $26 million against earnings of $42 million in the year-ago reported quarter. It reflects a lower underwriting margin and lower net investment income. Life insurance sales increased 17.8% quarter over quarter to $33 million, reflecting growth of the company's life insurance suite.
Adjusted operating loss at Run-off was $83 million, wider than the year-ago loss of $30 million. It reflects reduced net investment income and a weaker underwriting margin, partially offset by decreased expenses.
Corporate & Other recorded an adjusted operating loss of $25 million against earnings of $2 million in the year-ago quarter, reflecting a decline in net investment income and a reduced tax benefit.
Financial Update of BHF
Cash and cash equivalents for the reported quarter were $5.5 billion, up 24.7% year over year.
In the quarter under review, shareholders’ equity was $5.7 billion, which increased 37% year over year.
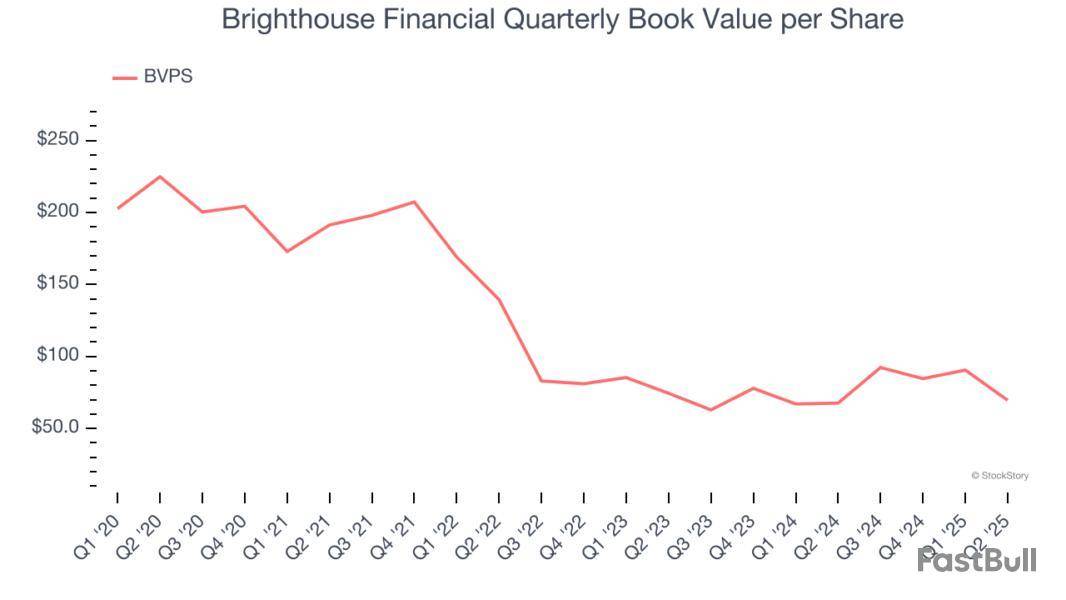
Book value per share, excluding accumulated other comprehensive income, was $144.09 as of June 30, 2025, up 12.3% year over year.
Statutory combined total adjusted capital was $5.6 billion as of June 30, 2025, up 3.7% year over year.
As of June 30, 2025, the estimated combined risk-based capital ratio was in the range of 405-425%%.
Brighthouse Financial’s Share Buyback Program
Brighthouse Financial bought back shares worth $43 million in the second quarter of 2025, taking the year-to-date tally to $102 million.
Zacks Rank
Brighthouse Financial currently carries a Zacks Rank #3 (Hold). You can see the complete list of today’s Zacks #1 Rank (Strong Buy) stocks here.
Performance of Other Life Insurers
Here are three stocks in the Life Insurance space that have already reported earnings for this quarter: Reinsurance Group of America, Incorporated RGA, Voya Financial, Inc. VOYA, Lincoln National Corporation LNC
Reinsurance Group of America reported second-quarter 2025 adjusted operating earnings of $4.72 per share, which missed the Zacks Consensus Estimate by 15.4%. Though it witnesseda solid performance in Canada, Europe, the Middle East and Africa (EMEA) and Asia/Pacific segments, it was offset by weakness in the U.S. and Latin America segments.Reinsurance Group’s operating revenues of $5.6 billion improved 9.6% year over year, driven by higher net premiums, investment income, net of related expenses and other revenues.
Voya Financial reported second-quarter 2025 adjusted operating earnings of $2.4 per share, which beat the Zacks Consensus Estimate by 14.8%, driven by accretion from the OneAmerica business, favorable capital markets, and net inflows across the operations.Voya’sadjusted operating revenues amounted to $356 million, up 9.8% year over year.
Lincoln National reported second-quarter adjusted earnings per share of $2.36, which surpassed the Zacks Consensus Estimate by 23.6%, thanks to higher insurance premiums, strong annuity deposits and solid Group Protection performance.Lincoln’s adjusted operating revenues grew 4.4% year over year to $4.7 billion.
This article originally published on Zacks Investment Research (zacks.com).
Zacks Investment Research
(13:14 GMT) Brighthouse Financial Price Target Cut to $65.00/Share From $70.00 by Barclays
Insurance and annuity provider Brighthouse Financial missed Wall Street’s revenue expectations in Q2 CY2025, with sales falling 2.9% year on year to $2.15 billion. Its non-GAAP profit of $3.43 per share was 21.8% below analysts’ consensus estimates.
Is now the time to buy Brighthouse Financial? Find out by accessing our full research report, it’s free.
Brighthouse Financial (BHF) Q2 CY2025 Highlights:
“I am pleased that we ended the quarter with an estimated combined RBC ratio that was within our target range of 400% to 450% in normal market conditions,” said Eric Steigerwalt, president and CEO, Brighthouse Financial.
Company Overview
Spun off from MetLife in 2017 to focus specifically on retail financial products, Brighthouse Financial provides annuity contracts and life insurance products designed to help individuals protect wealth, generate income, and transfer assets.
Revenue Growth
Insurers earn revenue three ways. The core insurance business itself, often called underwriting and represented in the income statement as premiums earned, is one way. Investment income from investing the “float” (premiums collected upfront not yet paid out as claims) in assets such as fixed-income assets and equities is the second way. Fees from various sources such as policy administration, annuities, or other value-added services is the third.
Unfortunately, Brighthouse Financial’s 2.2% annualized revenue growth over the last five years was sluggish. This fell short of our benchmarks and is a rough starting point for our analysis.
Long-term growth is the most important, but within financials, a half-decade historical view may miss recent interest rate changes and market returns. Brighthouse Financial’s annualized revenue growth of 5.8% over the last two years is above its five-year trend, but we were still disappointed by the results.
This quarter, Brighthouse Financial missed Wall Street’s estimates and reported a rather uninspiring 2.9% year-on-year revenue decline, generating $2.15 billion of revenue.
Net premiums earned made up 8.6% of the company’s total revenue during the last five years, meaning Brighthouse Financial is well diversified and has a variety of income streams driving its overall growth. Nevertheless, net premiums earned is critical to analyze for insurers because they’re considered a higher-quality, more recurring revenue source by investors.
Unless you’ve been living under a rock, it should be obvious by now that generative AI is going to have a huge impact on how large corporations do business. While Nvidia and AMD are trading close to all-time highs, we prefer a lesser-known (but still profitable) stock benefiting from the rise of AI. Click here to access our free report one of our favorites growth stories.
Book Value Per Share (BVPS)
Insurance companies are balance sheet businesses, collecting premiums upfront and paying out claims over time. The float – premiums collected but not yet paid out – are invested, creating an asset base supported by a liability structure. Book value captures this dynamic by measuring:
BVPS is essentially the residual value for shareholders.
We therefore consider BVPS very important to track for insurers and a metric that sheds light on business quality because it reflects long-term capital growth and is harder to manipulate than more commonly-used metrics like EPS.
Brighthouse Financial’s BVPS declined at a 20.9% annual clip over the last five years. On a two-year basis, BVPS fell at a slower pace, dropping by 3.3% annually from $74.40 to $69.57 per share.
Over the next 12 months, Consensus estimates call for Brighthouse Financial’s BVPS to grow by 159% to $146.30, elite growth rate.
Key Takeaways from Brighthouse Financial’s Q2 Results
We struggled to find many positives in these results. Its net premiums earned missed and its EPS fell short of Wall Street’s estimates. Overall, this quarter could have been better. The stock remained flat at $45.75 immediately following the results.
Brighthouse Financial’s earnings report left more to be desired. Let’s look forward to see if this quarter has created an opportunity to buy the stock. What happened in the latest quarter matters, but not as much as longer-term business quality and valuation, when deciding whether to invest in this stock. We cover that in our actionable full research report which you can read here, it’s free.
White Label
Data API
Web Plug-ins
Poster Maker
Affiliate Program
The risk of loss in trading financial instruments such as stocks, FX, commodities, futures, bonds, ETFs and crypto can be substantial. You may sustain a total loss of the funds that you deposit with your broker. Therefore, you should carefully consider whether such trading is suitable for you in light of your circumstances and financial resources.
No decision to invest should be made without thoroughly conducting due diligence by yourself or consulting with your financial advisors. Our web content might not suit you since we don't know your financial conditions and investment needs. Our financial information might have latency or contain inaccuracy, so you should be fully responsible for any of your trading and investment decisions. The company will not be responsible for your capital loss.
Without getting permission from the website, you are not allowed to copy the website's graphics, texts, or trademarks. Intellectual property rights in the content or data incorporated into this website belong to its providers and exchange merchants.
Not Logged In
Log in to access more features

FastBull Membership
Not yet
Purchase
Log In
Sign Up