

Markets
News
Analysis
User
24/7
Economic Calendar
Education
Data
- Names
- Latest
- Prev


Signal Accounts for Members
All Signal Accounts
All Contests
 Japan Tankan Small Manufacturing Outlook Index (Q4)
A:--
F: --
P: --
Japan Tankan Large Non-Manufacturing Outlook Index (Q4)A:--
F: --
P: --
Japan Tankan Large Manufacturing Outlook Index (Q4)A:--
F: --
P: --
Japan Tankan Small Manufacturing Diffusion Index (Q4)A:--
F: --
P: --
Japan Tankan Large Manufacturing Diffusion Index (Q4)A:--
F: --
P: --
Japan Tankan Large-Enterprise Capital Expenditure YoY (Q4)A:--
F: --
P: --
 U.K. Rightmove House Price Index YoY (Dec)
A:--
F: --
P: --
 China, Mainland Industrial Output YoY (YTD) (Nov)
A:--
F: --
P: --
China, Mainland Urban Area Unemployment Rate (Nov)A:--
F: --
P: --
 Saudi Arabia CPI YoY (Nov)
A:--
F: --
P: --
 Euro Zone Industrial Output YoY (Oct)
A:--
F: --
P: --
Euro Zone Industrial Output MoM (Oct)A:--
F: --
P: --
 Canada Existing Home Sales MoM (Nov)
A:--
F: --
P: --
Canada National Economic Confidence IndexA:--
F: --
P: --
Canada New Housing Starts (Nov)A:--
F: --
 U.S. NY Fed Manufacturing Employment Index (Dec)
A:--
F: --
P: --
U.S. NY Fed Manufacturing Index (Dec)A:--
F: --
P: --
Canada Core CPI YoY (Nov)A:--
F: --
P: --
Canada Manufacturing Unfilled Orders MoM (Oct)A:--
F: --
P: --
U.S. NY Fed Manufacturing Prices Received Index (Dec)A:--
F: --
P: --
U.S. NY Fed Manufacturing New Orders Index (Dec)A:--
F: --
P: --
Canada Manufacturing New Orders MoM (Oct)A:--
F: --
P: --
Canada Core CPI MoM (Nov)A:--
F: --
P: --
Canada Trimmed CPI YoY (SA) (Nov)A:--
F: --
P: --
Canada Manufacturing Inventory MoM (Oct)A:--
F: --
P: --
Canada CPI YoY (Nov)A:--
F: --
P: --
Canada CPI MoM (Nov)A:--
F: --
P: --
Canada CPI YoY (SA) (Nov)A:--
F: --
P: --
Canada Core CPI MoM (SA) (Nov)A:--
F: --
P: --
Canada CPI MoM (SA) (Nov)A:--
F: --
P: --
Federal Reserve Board Governor Milan delivered a speech U.S. NAHB Housing Market Index (Dec)--
F: --
P: --
 Australia Composite PMI Prelim (Dec)
--
F: --
P: --
Australia Services PMI Prelim (Dec)--
F: --
P: --
Australia Manufacturing PMI Prelim (Dec)--
F: --
P: --
Japan Manufacturing PMI Prelim (SA) (Dec)--
F: --
P: --
U.K. 3-Month ILO Employment Change (Oct)--
F: --
P: --
U.K. Unemployment Claimant Count (Nov)--
F: --
P: --
U.K. Unemployment Rate (Nov)--
F: --
P: --
U.K. 3-Month ILO Unemployment Rate (Oct)--
F: --
P: --
U.K. Average Weekly Earnings (3-Month Average, Including Bonuses) YoY (Oct)--
F: --
P: --
U.K. Average Weekly Earnings (3-Month Average, Excluding Bonuses) YoY (Oct)--
F: --
P: --
 France Services PMI Prelim (Dec)
--
F: --
P: --
France Composite PMI Prelim (SA) (Dec)--
F: --
P: --
France Manufacturing PMI Prelim (Dec)--
F: --
P: --
 Germany Services PMI Prelim (SA) (Dec)
--
F: --
P: --
Germany Manufacturing PMI Prelim (SA) (Dec)--
F: --
P: --
Germany Composite PMI Prelim (SA) (Dec)--
F: --
P: --
Euro Zone Composite PMI Prelim (SA) (Dec)--
F: --
P: --
Euro Zone Services PMI Prelim (SA) (Dec)--
F: --
P: --
Euro Zone Manufacturing PMI Prelim (SA) (Dec)--
F: --
P: --
U.K. Services PMI Prelim (Dec)--
F: --
P: --
U.K. Manufacturing PMI Prelim (Dec)--
F: --
P: --
U.K. Composite PMI Prelim (Dec)--
F: --
P: --
Euro Zone ZEW Economic Sentiment Index (Dec)--
F: --
P: --
Germany ZEW Current Conditions Index (Dec)--
F: --
P: --
Germany ZEW Economic Sentiment Index (Dec)--
F: --
P: --
Euro Zone Trade Balance (Not SA) (Oct)--
F: --
P: --
Euro Zone ZEW Current Conditions Index (Dec)--
F: --
P: --
Euro Zone Trade Balance (SA) (Oct)--
F: --
P: --
U.S. Retail Sales MoM (Excl. Automobile) (SA) (Oct)--
F: --
P: --

No matching data
Latest Views
Latest Views
Trending Topics
Top Columnists
Latest Update
White Label
Data API
Web Plug-ins
Affiliate Program
View All
No data


As the Q1 earnings season comes to a close, it’s time to take stock of this quarter’s best and worst performers in the life insurance industry, including Brighthouse Financial and its peers.
Life insurance companies collect premiums from policyholders in exchange for providing a future death benefit or retirement income stream. Interest rates matter for the sector (and make it cyclical), with higher rates allowing insurers to reinvest their fixed-income portfolios at more attractive yields and vice versa. Additionally, favorable demographic shifts, such as an aging population, are driving strong demand for retirement products while AI and data analytics offer significant opportunities to improve underwriting accuracy and operational efficiency. Conversely, the industry faces headwinds from persistent competition from agile insurtechs that threaten traditional distribution models.
The 15 life insurance stocks we track reported a softer Q1. As a group, revenues missed analysts’ consensus estimates by 3.1%.
While some life insurance stocks have fared somewhat better than others, they have collectively declined. On average, share prices are down 2.1% since the latest earnings results.
Spun off from MetLife in 2017 to focus specifically on retail financial products, Brighthouse Financial provides annuity contracts and life insurance products designed to help individuals protect wealth, generate income, and transfer assets.
Brighthouse Financial reported revenues of $2.16 billion, up 5.2% year on year. This print fell short of analysts’ expectations by 5.3%. Overall, it was a disappointing quarter for the company with a significant miss of analysts’ net premiums earned and book value per share estimates.
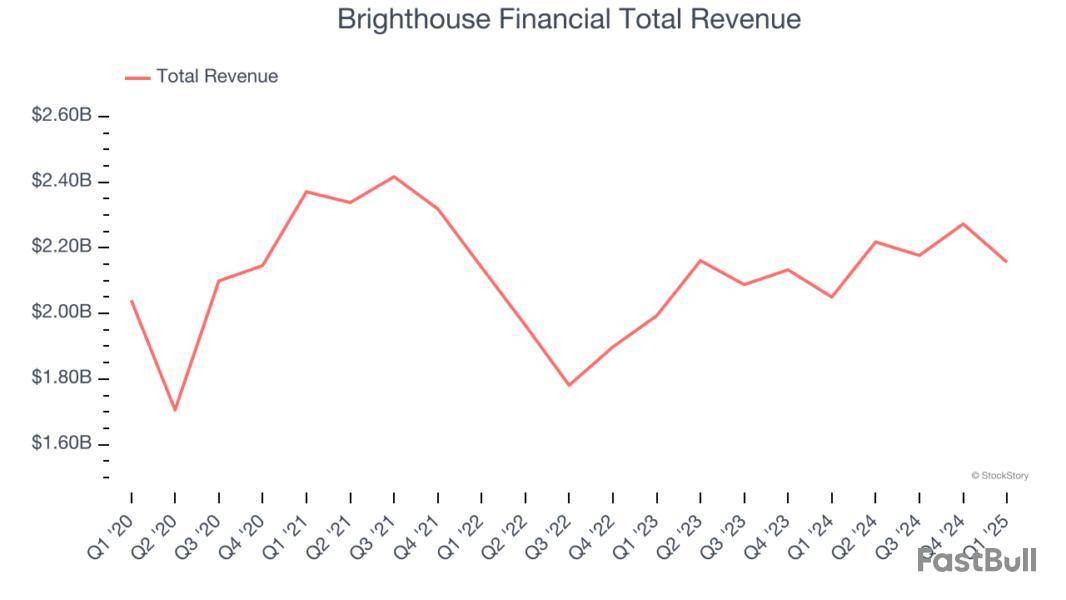
Unsurprisingly, the stock is down 12.2% since reporting and currently trades at $50.85.
Read our full report on Brighthouse Financial here, it’s free.
Spun off from insurance giant AIG in 2022 to focus on the growing retirement market, Corebridge Financial provides retirement solutions, annuities, life insurance, and institutional risk management products in the United States.
Corebridge Financial reported revenues of $4.74 billion, down 19.1% year on year, outperforming analysts’ expectations by 7.9%. The business had a satisfactory quarter.
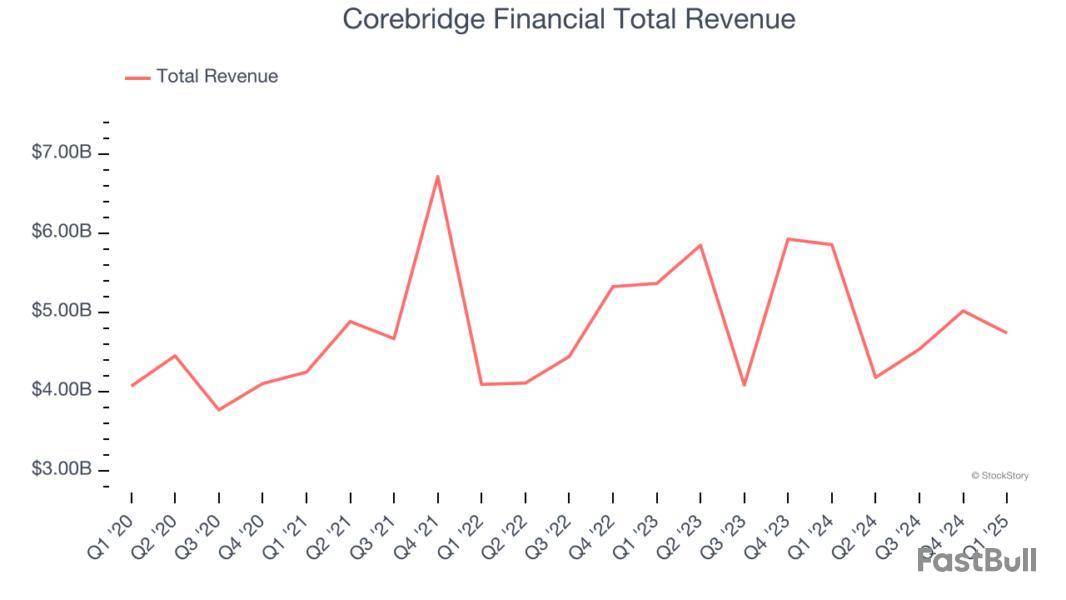
Corebridge Financial delivered the biggest analyst estimates beat among its peers. The market seems happy with the results as the stock is up 7% since reporting. It currently trades at $35.26.
Is now the time to buy Corebridge Financial? Access our full analysis of the earnings results here, it’s free.
Weakest Q1: Equitable Holdings
Tracing its roots back to 1859 as one of America's oldest financial institutions, Equitable Holdings provides retirement planning, asset management, and life insurance products through its two main franchises, Equitable and AllianceBernstein.
Equitable Holdings reported revenues of $3.78 billion, up 4% year on year, falling short of analysts’ expectations by 5.7%. It was a disappointing quarter as it posted a significant miss of analysts’ EPS estimates.
As expected, the stock is down 1.3% since the results and currently trades at $52.93.
Read our full analysis of Equitable Holdings’s results here.
Founded in 1959 and serving approximately 677,000 policyholders who rely on its financial protection products, F&G Annuities & Life provides fixed annuities, life insurance, and pension risk transfer solutions to retail and institutional clients.
F&G Annuities & Life reported revenues of $930 million, down 40.7% year on year. This number missed analysts’ expectations by 36.9%. It was a disappointing quarter as it also recorded a significant miss of analysts’ net premiums earned estimates and a significant miss of analysts’ EPS estimates.
F&G Annuities & Life had the weakest performance against analyst estimates and slowest revenue growth among its peers. The stock is down 13.5% since reporting and currently trades at $31.04.
Read our full, actionable report on F&G Annuities & Life here, it’s free.
Founded in 1905 by a group of Fort Wayne, Indiana businessmen who named the company after Abraham Lincoln, Lincoln National Corporation provides insurance, retirement plans, and wealth management products through its subsidiaries, operating under four main segments: Annuities, Life Insurance, Group Protection, and Retirement Plan Services.
Lincoln Financial Group reported revenues of $4.69 billion, up 2.2% year on year. This print was in line with analysts’ expectations. Zooming out, it was a slower quarter as it logged a significant miss of analysts’ book value per share estimates and EPS in line with analysts’ estimates.
The stock is up 1.6% since reporting and currently trades at $34.55.
Read our full, actionable report on Lincoln Financial Group here, it’s free.
Market Update
As a result of the Fed’s rate hikes in 2022 and 2023, inflation has come down from frothy levels post-pandemic. The general rise in the price of goods and services is trending towards the Fed’s 2% goal as of late, which is good news. The higher rates that fought inflation also didn't slow economic activity enough to catalyze a recession. So far, soft landing. This, combined with recent rate cuts (half a percent in September 2024 and a quarter percent in November 2024) have led to strong stock market performance in 2024. The icing on the cake for 2024 returns was Donald Trump’s victory in the U.S. Presidential Election in early November, sending major indices to all-time highs in the week following the election. Still, debates around the health of the economy and the impact of potential tariffs and corporate tax cuts remain, leaving much uncertainty around 2025.


By Robert Teitelman
Markets: President Donald Trump said the European Union and Mexico would pay 30% tariffs by Aug. 1 and warned he'd hit Russia with "perhaps 100%" secondary tariffs unless it agreed to a Ukraine cease-fire in 50 days; the "secondary" refers to levies on countries buying Russian goods, namely China, India, and Brazil. June consumer prices edged up. Stocks rose after the U.S. approved Nvidia sales of H20 artificial-intelligence chips to China. Trump denied he was firing Fed Chair Jerome Powell. Bitcoin set new highs as Congress passed two crypto bills. On the week, the Dow industrials fell a mere 0.07%, the S&P 500 rose 0.6%, and the Nasdaq Composite 1.5%.
Companies: Amazon.com said its Prime Days had record sales; doubling the days to four helped. SpaceX is investing $2 billion in Elon Musk's xAI, and Musk said he wants Tesla shareholders to vote on backing the AI start-up. JPMorgan Chase and Citigroup kicked off 2Q earnings season by beating expectations. BlackRock fell after reporting that an Asian client redeemed $52 billion from its index funds. Meta Platforms settled its $8 billion shareholder suit over privacy issues after the first day of trial. Trade Desk joined the S&P 500, replacing Ansys, acquired by Synopsys.
Deals: Chevron sealed its $53 billion Hess deal after beating ExxonMobil in arbitration over a Guyana oil field...The Wall Street Journal reported two potential deals: Aquarian Holdings to buy Brighthouse Financial, and Union Pacific to buy Norfolk Southern.
To subscribe to Barron's, visit http://www.barrons.com/subscribe


Let’s dig into the relative performance of CNO Financial Group and its peers as we unravel the now-completed Q1 life insurance earnings season.
Life insurance companies collect premiums from policyholders in exchange for providing a future death benefit or retirement income stream. Interest rates matter for the sector (and make it cyclical), with higher rates allowing insurers to reinvest their fixed-income portfolios at more attractive yields and vice versa. Additionally, favorable demographic shifts, such as an aging population, are driving strong demand for retirement products while AI and data analytics offer significant opportunities to improve underwriting accuracy and operational efficiency. Conversely, the industry faces headwinds from persistent competition from agile insurtechs that threaten traditional distribution models.
The 15 life insurance stocks we track reported a softer Q1. As a group, revenues missed analysts’ consensus estimates by 3.1%.
While some life insurance stocks have fared somewhat better than others, they have collectively declined. On average, share prices are down 3.6% since the latest earnings results.
Rebranded from Conseco in 2010 to signal a fresh start after navigating financial challenges, CNO Financial Group develops and markets health insurance, annuities, and life insurance products primarily targeting middle-income pre-retirees and retirees.
CNO Financial Group reported revenues of $948.6 million, up 5.7% year on year. This print fell short of analysts’ expectations by 1.9%. Overall, it was a softer quarter for the company with a significant miss of analysts’ book value per share estimates and EPS in line with analysts’ estimates.
"Our first quarter results enable us to reaffirm our full-year 2025 and three-year return on equity guidance," said Gary C. Bhojwani, chief executive officer.
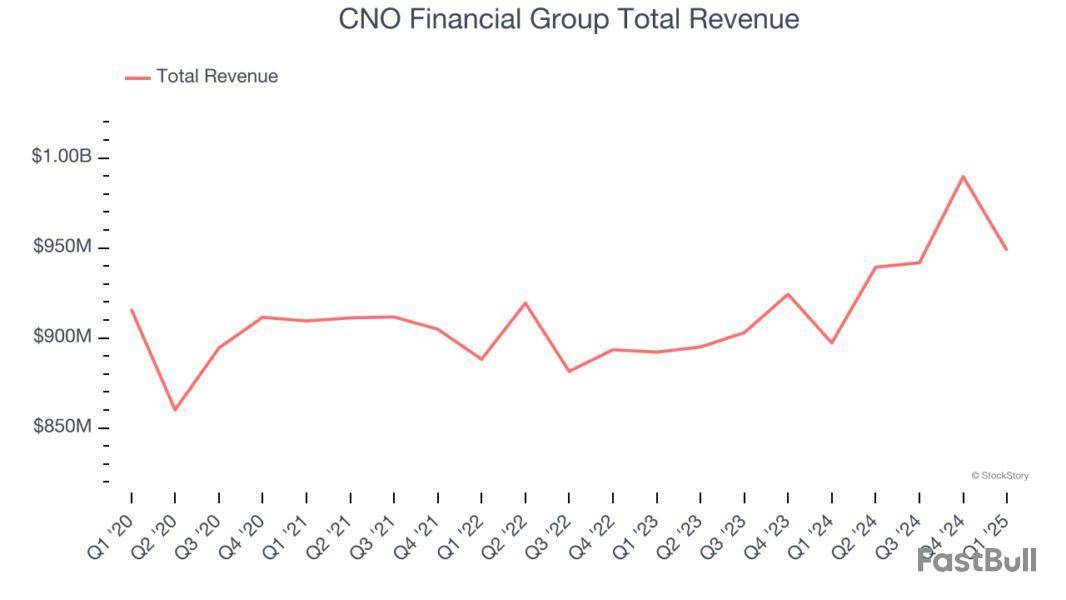
Unsurprisingly, the stock is down 8% since reporting and currently trades at $36.69.
Read our full report on CNO Financial Group here, it’s free.
Spun off from insurance giant AIG in 2022 to focus on the growing retirement market, Corebridge Financial provides retirement solutions, annuities, life insurance, and institutional risk management products in the United States.
Corebridge Financial reported revenues of $4.74 billion, down 19.1% year on year, outperforming analysts’ expectations by 7.9%. The business had a satisfactory quarter.

Corebridge Financial scored the biggest analyst estimates beat among its peers. The market seems happy with the results as the stock is up 5.5% since reporting. It currently trades at $34.75.
Is now the time to buy Corebridge Financial? Access our full analysis of the earnings results here, it’s free.
Weakest Q1: F&G Annuities & Life
Founded in 1959 and serving approximately 677,000 policyholders who rely on its financial protection products, F&G Annuities & Life provides fixed annuities, life insurance, and pension risk transfer solutions to retail and institutional clients.
F&G Annuities & Life reported revenues of $930 million, down 40.7% year on year, falling short of analysts’ expectations by 36.9%. It was a disappointing quarter as it posted a significant miss of analysts’ net premiums earned estimates and a significant miss of analysts’ EPS estimates.
F&G Annuities & Life delivered the weakest performance against analyst estimates and slowest revenue growth in the group. As expected, the stock is down 12.7% since the results and currently trades at $31.32.
Read our full analysis of F&G Annuities & Life’s results here.
Tracing its roots back to 1848 when financial security for workers was virtually non-existent, Unum Group provides workplace financial protection benefits including disability, life, accident, critical illness, dental and vision insurance primarily through employers.
Unum Group reported revenues of $3.30 billion, up 3% year on year. This result missed analysts’ expectations by 1%. Overall, it was a softer quarter as it also logged a significant miss of analysts’ book value per share estimates and a miss of analysts’ EPS estimates.
The stock is down 2.1% since reporting and currently trades at $80.43.
Read our full, actionable report on Unum Group here, it’s free.
Spun off from MetLife in 2017 to focus specifically on retail financial products, Brighthouse Financial provides annuity contracts and life insurance products designed to help individuals protect wealth, generate income, and transfer assets.
Brighthouse Financial reported revenues of $2.16 billion, up 5.2% year on year. This print lagged analysts' expectations by 5.3%. It was a disappointing quarter as it also produced a significant miss of analysts’ net premiums earned estimates and a significant miss of analysts’ book value per share estimates.
The stock is down 11.9% since reporting and currently trades at $51.
Read our full, actionable report on Brighthouse Financial here, it’s free.
Market Update
Thanks to the Fed’s rate hikes in 2022 and 2023, inflation has been on a steady path downward, easing back toward that 2% sweet spot. Fortunately (miraculously to some), all this tightening didn’t send the economy tumbling into a recession, so here we are, cautiously celebrating a soft landing. The cherry on top? Recent rate cuts (half a point in September 2024, a quarter in November) have propped up markets, especially after Trump’s November win lit a fire under major indices and sent them to all-time highs. However, there’s still plenty to ponder — tariffs, corporate tax cuts, and what 2025 might hold for the economy.
728 RM B 7/F GEE LOK IND BLDG NO 34 HUNG TO RD KWUN TONG KLN HONG KONG


White Label
Data API
Web Plug-ins
Poster Maker
Affiliate Program
The risk of loss in trading financial instruments such as stocks, FX, commodities, futures, bonds, ETFs and crypto can be substantial. You may sustain a total loss of the funds that you deposit with your broker. Therefore, you should carefully consider whether such trading is suitable for you in light of your circumstances and financial resources.
No decision to invest should be made without thoroughly conducting due diligence by yourself or consulting with your financial advisors. Our web content might not suit you since we don't know your financial conditions and investment needs. Our financial information might have latency or contain inaccuracy, so you should be fully responsible for any of your trading and investment decisions. The company will not be responsible for your capital loss.
Without getting permission from the website, you are not allowed to copy the website's graphics, texts, or trademarks. Intellectual property rights in the content or data incorporated into this website belong to its providers and exchange merchants.
Not Logged In
Log in to access more features

FastBull Membership
Not yet
Purchase


Log In
Sign Up


