Markets
News
Analysis
User
24/7
Economic Calendar
Education
Data
- Names
- Latest
- Prev


Signal Accounts for Members
All Signal Accounts
All Contests


U.K. Trade Balance Non-EU (SA) (Oct)A:--
F: --
P: --
U.K. Trade Balance (Oct)A:--
F: --
P: --
U.K. Services Index MoMA:--
F: --
P: --
U.K. Construction Output MoM (SA) (Oct)A:--
F: --
P: --
U.K. Industrial Output YoY (Oct)A:--
F: --
P: --
U.K. Trade Balance (SA) (Oct)A:--
F: --
P: --
U.K. Trade Balance EU (SA) (Oct)A:--
F: --
P: --
U.K. Manufacturing Output YoY (Oct)A:--
F: --
P: --
U.K. GDP MoM (Oct)A:--
F: --
P: --
U.K. GDP YoY (SA) (Oct)A:--
F: --
P: --
U.K. Industrial Output MoM (Oct)A:--
F: --
P: --
U.K. Construction Output YoY (Oct)A:--
F: --
P: --
France HICP Final MoM (Nov)A:--
F: --
P: --
China, Mainland Outstanding Loans Growth YoY (Nov)A:--
F: --
P: --
China, Mainland M2 Money Supply YoY (Nov)A:--
F: --
P: --
China, Mainland M0 Money Supply YoY (Nov)A:--
F: --
P: --
China, Mainland M1 Money Supply YoY (Nov)A:--
F: --
P: --
India CPI YoY (Nov)A:--
F: --
P: --
India Deposit Gowth YoYA:--
F: --
P: --
Brazil Services Growth YoY (Oct)A:--
F: --
P: --
Mexico Industrial Output YoY (Oct)A:--
F: --
P: --
Russia Trade Balance (Oct)A:--
F: --
P: --
Philadelphia Fed President Henry Paulson delivers a speech
Canada Building Permits MoM (SA) (Oct)A:--
F: --
P: --
Canada Wholesale Sales YoY (Oct)A:--
F: --
P: --
Canada Wholesale Inventory MoM (Oct)A:--
F: --
P: --
Canada Wholesale Inventory YoY (Oct)A:--
F: --
P: --
Canada Wholesale Sales MoM (SA) (Oct)A:--
F: --
P: --
Germany Current Account (Not SA) (Oct)A:--
F: --
P: --
U.S. Weekly Total Rig CountA:--
F: --
P: --
U.S. Weekly Total Oil Rig CountA:--
F: --
P: --
Japan Tankan Large Non-Manufacturing Diffusion Index (Q4)--
F: --
P: --
Japan Tankan Small Manufacturing Outlook Index (Q4)--
F: --
P: --
Japan Tankan Large Non-Manufacturing Outlook Index (Q4)--
F: --
P: --
Japan Tankan Large Manufacturing Outlook Index (Q4)--
F: --
P: --
Japan Tankan Small Manufacturing Diffusion Index (Q4)--
F: --
P: --
Japan Tankan Large Manufacturing Diffusion Index (Q4)--
F: --
P: --
Japan Tankan Large-Enterprise Capital Expenditure YoY (Q4)--
F: --
P: --
U.K. Rightmove House Price Index YoY (Dec)--
F: --
P: --
China, Mainland Industrial Output YoY (YTD) (Nov)--
F: --
P: --
China, Mainland Urban Area Unemployment Rate (Nov)--
F: --
P: --
Saudi Arabia CPI YoY (Nov)--
F: --
P: --
Euro Zone Industrial Output YoY (Oct)--
F: --
P: --
Euro Zone Industrial Output MoM (Oct)--
F: --
P: --
Canada Existing Home Sales MoM (Nov)--
F: --
P: --
Euro Zone Total Reserve Assets (Nov)--
F: --
P: --
U.K. Inflation Rate Expectations--
F: --
P: --
Canada National Economic Confidence Index--
F: --
P: --
Canada New Housing Starts (Nov)--
F: --
P: --
U.S. NY Fed Manufacturing Employment Index (Dec)--
F: --
P: --
U.S. NY Fed Manufacturing Index (Dec)--
F: --
P: --
Canada Core CPI YoY (Nov)--
F: --
P: --
Canada Manufacturing Unfilled Orders MoM (Oct)--
F: --
P: --
Canada Manufacturing New Orders MoM (Oct)--
F: --
P: --
Canada Core CPI MoM (Nov)--
F: --
P: --
Canada Manufacturing Inventory MoM (Oct)--
F: --
P: --
Canada CPI YoY (Nov)--
F: --
P: --
Canada CPI MoM (Nov)--
F: --
P: --
Canada CPI YoY (SA) (Nov)--
F: --
P: --
Canada Core CPI MoM (SA) (Nov)--
F: --
P: --


No matching data
Latest Views
Latest Views
Trending Topics
Top Columnists
Latest Update
White Label
Data API
Web Plug-ins
Affiliate Program
View All

No data
The Boston Beer Company, Inc. SAM is likely to register growth in its top line when it reports first-quarter 2025 results on April 24. In the first quarter, the company’s bottom line is expected to have declined year over year.
The Zacks Consensus Estimate for revenues is pegged at $432.3 million, implying a 1.5% increase from the prior-year quarter’s reported figure. The consensus mark for earnings has increased by a penny in the past seven days to 89 cents per share. This implies a decline of 14.4% from the year-ago quarter. (Find the latest EPS estimates and surprises on Zacks Earnings Calendar.)
The Boston Beer Company, Inc. Price, Consensus and EPS Surprise
The Boston Beer Company, Inc. price-consensus-eps-surprise-chart | The Boston Beer Company, Inc. Quote
In the last reported quarter, the company delivered a negative earnings surprise of 42.4%. SAM has a trailing four-quarter earnings surprise of 288.4%, on average.
Things to Know About SAM’s Q1 Earnings
Boston Beer has faced ongoing challenges, primarily due to the continued slowdown in the hard seltzer category and weakening demand for its Truly brand in the first quarter of 2025. As consumer preferences shift toward other beyond-beer options and more affordable premium light beers, Truly’s performance remains under pressure. The loss of novelty in the hard seltzer space, combined with heightened competition from emerging beverage categories, is weighing on demand.
Macroeconomic factors, including inflation and reduced discretionary spending, are also contributing to a shift in volume away from hard seltzers. These headwinds are expected to have impacted Boston Beer’s overall sales mix and place pressure on depletions in the near term.
In the last quarter of 2024, Boston Beer saw a slight drop in product shipments, mainly due to the continued weak performance of Truly Hard Seltzer. While this decline had a negative impact, it was partially balanced by solid growth in other brands like Twisted Tea, Sun Cruiser and Hard Mountain Dew.
In the first quarter of 2025, shipments are expected to be stronger than typical for the season, driven by planned inventory replenishment from wholesalers, particularly for high-performing brands. That said, consumer takeaway is likely to remain flat year over year. As a result, while reported shipment volumes may show an uptick, the underlying demand landscape remains uncertain, especially in a quarter that’s typically soft due to seasonal volume trends.
Despite these near-term challenges, Boston Beer is positioned for improved performance, supported by strong price realization and ongoing procurement savings, which are helping offset inflationary pressures. The company’s strategic pricing actions and cost optimization initiatives have led to margin improvement, a trend expected to continue.
SAM remains focused on strategic pricing, product innovation and brand development to strengthen its market position and drive operational performance. The company is expanding its presence in the Beyond Beer category, which continues to outpace the traditional beer market. With sustained growth in this segment, SAM expects the trend to persist in the coming years, further solidifying its competitive edge.
What the Zacks Model Unveils for SAM Stock
Our proven model does not conclusively predict an earnings beat for Boston Beer this time around. The combination of a positive Earnings ESP and a Zacks Rank #1 (Strong Buy), 2 (Buy) or 3 (Hold) increases the odds of an earnings beat. But that is not the case here.
Boston Beer currently has an Earnings ESP of -45.72% and a Zacks Rank #3. You can uncover the best stocks before they are reported with our Earnings ESP Filter.
Valuation Picture of SAM Stock
From a valuation perspective, Boston Beer stock is trading at a premium relative to historical and industry benchmarks. With a forward 12-month price-to-earnings of 22.26X, below the Beverages - Soft drinks industry’s average of 16.01X, the stock offers compelling value for investors seeking exposure to the sector.
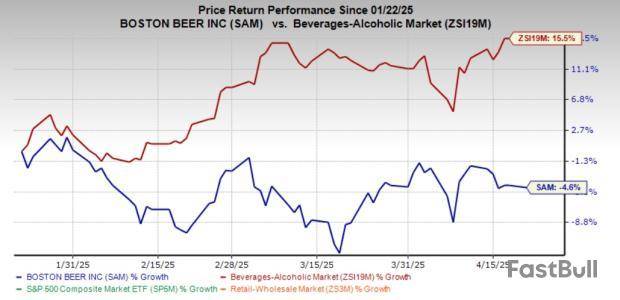
Boston Beer shares have shown a downward trend, losing 4.6% in the past three months against the industry’s growth of 15.5%.
Stocks With the Favorable Combination
Here are some companies that, according to our model, have the right combination of elements to beat on earnings this reporting cycle.
BJ's Wholesale Club Holdings, Inc. BJ currently has an Earnings ESP of +2.09% and a Zacks Rank of 2. You can see the complete list of today’s Zacks #1 Rank stocks here.
The Zacks Consensus Estimate for first-quarter fiscal 2025 earnings per share (EPS) is pegged at 91 cents, which implies a 7.1% increase year over year. The Zacks Consensus Estimate for BJ's Wholesale Club’s quarterly revenues is pegged at $5.2 billion, which indicates growth of 5.3% from the figure reported in the prior-year quarter. BJ delivered a trailing four-quarter earnings surprise of 12%, on average.
Freshpet FRPT currently has an Earnings ESP of +2.56% and a Zacks Rank of 3. The company is likely to register growth in the top line when it reports first-quarter 2025 numbers. The consensus mark for revenues is pegged at $262.3 million, which indicates an increase of 17.2% from the figure reported in the year-ago quarter.
The Zacks Consensus Estimate for Freshpet’s quarterly earnings per share of 13 cents implies a 38.1% decrease from the year-ago quarter. The consensus mark has remained stable in the past seven days. FRPT has a trailing four-quarter earnings surprise of 78.8%, on average.
Church & Dwight Co. CHD has an Earnings ESP of +0.66% and a Zacks Rank of 3 at present. CHD is likely to register top-line growth when it releases first-quarter 2025 results. The Zacks Consensus Estimate for its quarterly revenues is pegged at $1.51 billion, which implies growth of 0.5% from the figure reported in the year-ago quarter.
The consensus estimate for Church & Dwight’s quarterly earnings has remained unchanged in the past 30 days at 89 cents per share, implying a decline of 7.3% from the year-ago quarter’s number. CHD delivered an earnings surprise of 9.6%, on average, in the trailing four quarters.
This article originally published on Zacks Investment Research (zacks.com).
Zacks Investment Research
Helen of Troy Limited HELE is likely to register both top and bottom-line declines when it reports fourth-quarter fiscal 2025 earnings on April 24. The Zacks Consensus Estimate for quarterly revenues is pegged at $481.9 million, implying a 1.5% decrease from the prior-year quarter’s reported figure. The consensus mark for fiscal 2025 top line is pegged at $1.9 billion, which indicates a decline of 5.1% from the year-ago level.
The Zacks Consensus Estimate for quarterly earnings has moved down by a penny in the past seven days to $2.34 per share, indicating a 4.5% decline from the figure reported in the year-ago quarter. The consensus mark for fiscal 2025 earnings is pegged at $7.20 per share, implying a 19.2% decrease from the prior year’s reported figure.
HELE delivered a trailing four-quarter negative earnings surprise of 4.3%, on average. (Stay up-to-date with all quarterly releases: See Zacks Earnings Calendar.)
Helen of Troy Limited Price, Consensus and EPS Surprise
Helen of Troy Limited price-consensus-eps-surprise-chart | Helen of Troy Limited Quote
Factors Likely to Influence HELE’s Upcoming Results
Helen of Troy has been navigating a challenging macroeconomic environment characterized by reduced consumer and retailer demand. Consumers are facing financial constraints and prioritizing essential purchases over discretionary items. This has been impacting the company’s sales. Our model expects a 2.3% drop in organic volumes for the fiscal fourth quarter.
Helen of Troy’s Wellness segment is under pressure due to an unusually mild global illness season, with U.S. illness incidence at an eight-year low through December. This shift affected net sales by approximately $10 million in the fiscal third quarter and is expected to have hurt fiscal fourth-quarter sales by $15-$20 million. As a result, overall category performance is likely to have been under pressure in the to-be-reported quarter.
Helen of Troy has also been grappling with rising SG&A expenses. In the third quarter, the rise in the consolidated SG&A ratio was mainly due to elevated marketing expenses and unfavorable operating leverage. The persistence of any of these factors is a concern. Our model expects a 150-basis point expansion in adjusted SG&A (as a percentage of sales) to 33.8% for fiscal 2025.
Yet, the strength of Helen of Troy’s Leadership Brands continues to be a key pillar of support amid broader challenges. The company’s strategic focus on core operational excellence and portfolio refinement has helped stabilize performance. Its data-driven approach has been enhancing brand fundamentals, while international expansion and distribution optimization continue to drive reach and efficiency. Moreover, its global restructuring initiative, Project Pegasus, has been generating cost savings. These factors are likely to have offered some respite in the to-be-reported quarter’s performance.
Earnings Whispers for HELE
Our proven model does not conclusively predict an earnings beat for Helen of Troy this time. The combination of a positive Earnings ESP and a Zacks Rank #1 (Strong Buy), 2 (Buy) or 3 (Hold) increases the odds of an earnings beat, which is not the case here.
Helen of Troy currently has a Zacks Rank #4 (Sell) and an Earnings ESP of +0.57%. You can uncover the best stocks to buy or sell before they’re reported with our Earnings ESP Filter.
Some Stocks With the Favorable Combination
Here are some companies worth considering, as our model shows that these have the right combination of elements to beat on earnings this reporting cycle.
BJ's Wholesale Club Holdings, Inc. BJ currently has an Earnings ESP of +2.09% and a Zacks Rank of 2. You can see the complete list of today’s Zacks #1 Rank stocks here.
The Zacks Consensus Estimate for first quarter fiscal 2025 earnings per share (EPS) is pegged at 91 cents, which implies a 7.1% increase year over year. The consensus mark for BJ's Wholesale Club’s quarterly revenues is pegged at $5.2 billion, which indicates growth of 5.3% from the figure reported in the prior-year quarter. BJ delivered a trailing four-quarter earnings surprise of 12%, on average.
The Estée Lauder Companies Inc. EL currently has an Earnings ESP of +14.31% and a Zacks Rank of 3. The Zacks Consensus Estimate for third-quarter fiscal 2025 EPS is pegged at 30 cents, which implies a 69.1% decrease year over year.
The consensus mark for Estée Lauder Companies’ quarterly revenues is pegged at $3.5 billion, which indicates a 10.9% decrease from the figure reported in the prior-year quarter. EL delivered a trailing four-quarter earnings surprise of 101.9%, on average.
Freshpet, Inc. FRPT currently has an Earnings ESP of +2.56% and a Zacks Rank of 3. The Zacks Consensus Estimate for first quarter 2025 EPS is pegged at 13 cents, which implies a 38.1% decrease year over year.
The consensus mark for Freshpet’s quarterly revenues is pegged at $262.3 million, which indicates growth of 17.2% from the figure reported in the prior-year quarter. FRPT delivered a trailing four-quarter earnings surprise of 78.8%, on average.
This article originally published on Zacks Investment Research (zacks.com).
Zacks Investment Research
Medifast, Inc. MED is likely to register a decrease in both top and bottom lines when it reports first-quarter 2025 earnings on April 28, after market close. The Zacks Consensus Estimate for first-quarter revenues is pegged at $119.9 million, which indicates a 31.4% decline from the year-ago quarter’s reported figure.
Although the consensus mark for first-quarter bottom line has narrowed by 13 cents in the past 30 days to a loss of 7 cents, the projection indicates deterioration from 66 cents reported in the year-ago quarter. (Find the latest EPS estimates and surprises on Zacks Earnings Calendar.)
MED delivered a trailing four-quarter earnings surprise of 152.6%, on average. In the last reported quarter, the company surpassed the Zacks Consensus Estimate by a margin of 137%.
MEDIFAST INC Price, Consensus and EPS Surprise
MEDIFAST INC price-consensus-eps-surprise-chart | MEDIFAST INC Quote
Key Factors to Note Before MED’s Upcoming Earnings Release
Medifast continues to face a difficult macroeconomic environment, marked by mounting competitive pressures within the health and wellness industry, the disruptive impact of GLP-1 weight loss medications and a broader decline in consumer discretionary spending. These challenges are likely to have prevailed and clouded the company’s performance in the to-be-reported quarter.
On its fourth-quarter earnings call, management projected revenues between $100 million and $120 million for the first quarter of 2025, reflecting the sustained difficulties in attracting new customers and maintaining coach engagement. This downside can be attributed to evolving dynamics of the weight loss market, with the rapid uptake of GLP-1 therapies continuing to alter consumer preferences and behavior.
Medifast’s bottom line is also likely to have been negatively impacted in the first quarter. The company projected the bottom line to be between break-even and a loss of 50 cents. This guidance underscores the financial strain resulting from declining sales volumes, elevated customer acquisition costs and continued investment in strategic initiatives.
Despite the ongoing challenges, Medifast has been actively pursuing a range of strategic initiatives to reignite its growth momentum. The company has focused on broadening its product portfolio, diversifying customer acquisition strategies and enhancing the overall consumer experience. MED has been realizing benefits from its "Fuel for the Future" program, an enterprise-wide cost optimization initiative designed to improve operational efficiency. These strategic actions are likely to have provided some cushion against the broader pressures faced during the quarter under review.
What the Zacks Model Predicts for MED
Our proven model does not conclusively predict an earnings beat for Medifast this time around. The combination of a positive Earnings ESP and a Zacks Rank #1 (Strong Buy), 2 (Buy) or 3 (Hold) increases the odds of an earnings beat, which is not the case here. You can uncover the best stocks to buy or sell before they’re reported with our Earnings ESP Filter.
Medifast currently has a Zacks Rank #3 and an Earnings ESP of 0.00%.
Stocks With the Favorable Combination
Here are some companies which, according to our model, have the right combination of elements to beat on earnings this time around.
Sprouts Farmers Market, Inc. SFM currently has an Earnings ESP of +0.44% and a Zacks Rank of 1. You can see the complete list of today’s Zacks #1 Rank stocks here.
SFM's top line is anticipated to increase year over year when it reports first-quarter 2025 results. The Zacks Consensus Estimate for its quarterly revenues is pegged at $2.19 billion, which implies 16.3% growth from the year-ago quarter’s reported figure.
The company is expected to register an increase in the bottom line. The consensus estimate for Sprouts Farmers’ first-quarter earnings is pegged at $1.53 per share, indicating 36.6% growth from the year-ago quarter. SFM delivered a trailing four-quarter earnings surprise of 15.1%, on average.
BJ's Wholesale Club Holdings, Inc. BJ presently has an Earnings ESP of +2.09% and a Zacks Rank of 2. BJ's top line is anticipated to advance year over year when it reports first-quarter fiscal 2025 results. The Zacks Consensus Estimate for its quarterly revenues is pegged at $5.18 billion, which indicates a 5.3% increase from the year-ago quarter’s reported figure.
The company is expected to register growth in the bottom line. The consensus estimate for BJ's Wholesale Club’s fiscal first-quarter earnings is pegged at 91 cents per share, implying an increase of 7.1% from the year-ago quarter. BJ delivered a trailing four-quarter earnings surprise of 12%, on average.
Freshpet FRPT currently has an Earnings ESP of +2.56% and a Zacks Rank of 3. The company is likely to register top-line growth when it reports first-quarter 2025 numbers. The Zacks Consensus Estimate for Freshpet’s quarterly revenues is pegged at $262.3 million, which indicates nearly 17.2% growth from the prior-year quarter.
The company is expected to register a decrease in the bottom line. The consensus estimate for Freshpet’s first-quarter earnings is pegged at 13 cents per share, indicating a 38.1% decrease from the year-ago quarter. FRPT delivered a trailing four-quarter earnings surprise of 78.8%, on average.
This article originally published on Zacks Investment Research (zacks.com).
Zacks Investment Research
BJ's Wholesale Club Announces First Quarter Fiscal 2025 Earnings Conference Call Date
MARLBOROUGH, Mass.--(BUSINESS WIRE)--April 21, 2025--
BJ's Wholesale Club Holdings, Inc. , a leading operator of membership warehouse clubs, today announced that it will release financial results for the first quarter fiscal 2025 prior to the market open on Thursday, May 22, 2025 and will hold a conference call on the same day at 8:30 a.m. ET to discuss its financial performance.
The live audio webcast of the call can be accessed under the "Events & Presentations" section of the company's investor relations website at https://investors.bjs.com. The webcast replay will remain available for one year.
Participants may also dial (833) 470-1428 within the U.S. or +1 (929) 526-1599 outside the U.S. and reference conference ID 221377.
About BJ's Wholesale Club Holdings, Inc.
BJ's Wholesale Club Holdings, Inc. is a leading operator of membership warehouse clubs focused on delivering significant value to its members and serving a shared purpose: "We take care of the families who depend on us." The company provides a wide assortment of fresh foods, produce, a full-service deli, fresh bakery, household essentials and gas. In addition, BJ's offers the latest technology, home decor, small appliances, apparel, seasonal items and more to deliver unbeatable value to smart-saving families. Headquartered in Marlborough, Massachusetts, the company pioneered the warehouse club model in New England in 1984 and currently operates 254 clubs and 190 BJ's Gas(R) locations in 21 states. For more information, please visit us at www.BJs.com or on Facebook or Instagram.
View source version on businesswire.com: https://www.businesswire.com/news/home/20250421076594/en/
CONTACT: Investor contact:
Catherine Park
Vice President, Investor Relations
cpark@bjs.com
(774) 512-6744
Media contact:
Kirk Saville
Head of Corporate Communications
ksaville@bjs.com
(774) 512-5597
Joseph McGrail, Senior Vice President, Controller, on April 15, 2025, sold 2,100 shares in Bj's Wholesale Club Holdings for $251,454. Following the Form 4 filing with the SEC, McGrail has control over a total of 14,240 common shares of the company, with 14,240 shares held directly.
SEC Filing:
www.sec.gov/Archives/edgar/data/1531152/000153115225000042/xslF345X05/wk-form4_1744921070.xml
White Label
Data API
Web Plug-ins
Poster Maker
Affiliate Program
The risk of loss in trading financial instruments such as stocks, FX, commodities, futures, bonds, ETFs and crypto can be substantial. You may sustain a total loss of the funds that you deposit with your broker. Therefore, you should carefully consider whether such trading is suitable for you in light of your circumstances and financial resources.
No decision to invest should be made without thoroughly conducting due diligence by yourself or consulting with your financial advisors. Our web content might not suit you since we don't know your financial conditions and investment needs. Our financial information might have latency or contain inaccuracy, so you should be fully responsible for any of your trading and investment decisions. The company will not be responsible for your capital loss.
Without getting permission from the website, you are not allowed to copy the website's graphics, texts, or trademarks. Intellectual property rights in the content or data incorporated into this website belong to its providers and exchange merchants.
Not Logged In
Log in to access more features

FastBull Membership
Not yet
Purchase
Log In
Sign Up