• Trade
  • Markets
  • Copy
  • Contests
  • News
  • 24/7
  • Calendar
  • Q&A
  • Chats
Screeners
SYMBOL
LAST
ASK
BID
HIGH
LOW
NET CHG.
%CHG.
SPREAD
SPX
S&P 500 Index
6939.02
6939.02
6939.02
6964.08
6893.47
-29.99
-0.43%
--
DJI
Dow Jones Industrial Average
48892.46
48892.46
48892.46
49047.68
48459.88
-179.09
-0.36%
--
IXIC
NASDAQ Composite Index
23461.81
23461.81
23461.81
23662.25
23351.55
-223.30
-0.94%
--
USDX
US Dollar Index
96.990
97.070
96.990
96.990
96.150
+1.020
+ 1.06%
--
EURUSD
Euro / US Dollar
1.18491
1.18514
1.18491
1.19743
1.18491
-0.01211
-1.01%
--
GBPUSD
Pound Sterling / US Dollar
1.36835
1.36880
1.36835
1.38142
1.36788
-0.01258
-0.91%
--
XAUUSD
Gold / US Dollar
4894.49
4894.49
4894.49
5450.83
4682.14
-481.82
-8.96%
--
WTI
Light Sweet Crude Oil
65.427
65.456
65.427
65.832
63.409
+0.175
+ 0.27%
--

Community Accounts

Signal Accounts
--
Profit Accounts
--
Loss Accounts
--
View More

Become a signal provider

Sell trading signals to earn additional income

View More

Guide to Copy Trading

Get started with ease and confidence

View More

Signal Accounts for Members

All Signal Accounts

Best Return
  • Best Return
  • Best P/L
  • Best MDD
Past 1W
  • Past 1W
  • Past 1M
  • Past 1Y

All Contests

  • All
  • Trump Updates
  • Recommend
  • Stocks
  • Cryptocurrencies
  • Central Banks
  • Featured News
Top News Only
Share

India Budget: To Reduce Tcs Rate For Edu, Medical To 2%

Share

India's Nifty Psu Bank Index Extends Losses, Last Down 3%

Share

India Budget: Gross Borrowing Seen At 17.2 Trillion Rupees

Share

India Budget: Net Borrowing Seen At 11.7 Trillion Rupees

Share

India Budget: Net Tax Revenue Seen At 28.7 Trillion Rupees

Share

India Budget: Fy26 Fiscal Deficit Seen At 4.4% Of GDP

Share

India Budget: Debt To GDP Seen At 55.6 %

Share

India Budget: Provided 1.4 Trillion Rupees To States For 2026-27 As Finance Commission Grants

Share

India Budget: In 16Th Finance Commission Accepted Recommendation To Retain Devloutino At 41%

Share

India's Nifty 50 Index Erases Gains, Last Down 0.1%

Share

India Budget: Overall Investment Limit For All Prois Increatsed To 24% From 10%

Share

India Budget: To Increase Investment Limit For Individual Proi From 5% To 10%

Share

India Budget: To Restructure Power Finance Corp

Share

India Budget: Propose Outlay Of 200 Billion Rupees For Carbon Capture Over Next 5 Years

Share

Peru's January Consumer Prices +0.10%

Share

India Budget-India Raises Infrastructure Spending To Record 12.2 Trillion Rupees For 2026-27

Share

India Budget: To Promote Coastal Cargo Shipping

Share

India Budget: Propose To Set Up Infrastructure Risk Guarantee Fund

Share

India Budget: Propose To Top Up Self-Reliant India Fund With 20 Billion Rupees

Share

India Budget: Propose Three-Pronged Approach To Help Msmes Grow

TIME
ACT
FCST
PREV
U.K. M4 Money Supply (SA) (Dec)

A:--

F: --

P: --
Italy Unemployment Rate (SA) (Dec)

A:--

F: --

P: --

Euro Zone Unemployment Rate (Dec)

A:--

F: --

P: --

Euro Zone GDP Prelim QoQ (SA) (Q4)

A:--

F: --

P: --

Euro Zone GDP Prelim YoY (SA) (Q4)

A:--

F: --

P: --

Italy PPI YoY (Dec)

A:--

F: --

P: --

Mexico GDP Prelim YoY (Q4)

A:--

F: --

P: --

Brazil Unemployment Rate (Dec)

A:--

F: --

P: --

South Africa Trade Balance (Dec)

A:--

F: --

P: --

India Deposit Gowth YoY

A:--

F: --

P: --

Germany CPI Prelim YoY (Jan)

A:--

F: --

P: --

Germany CPI Prelim MoM (Jan)

A:--

F: --

P: --

Germany HICP Prelim YoY (Jan)

A:--

F: --

P: --

Germany HICP Prelim MoM (Jan)

A:--

F: --

P: --

U.S. Core PPI YoY (Dec)

A:--

F: --

P: --
U.S. Core PPI MoM (SA) (Dec)

A:--

F: --

P: --

U.S. PPI YoY (Dec)

A:--

F: --

P: --

U.S. PPI MoM (SA) (Dec)

A:--

F: --

P: --

Canada GDP MoM (SA) (Nov)

A:--

F: --

P: --

Canada GDP YoY (Nov)

A:--

F: --

P: --

U.S. PPI MoM Final (Excl. Food, Energy and Trade) (SA) (Dec)

A:--

F: --

P: --

U.S. PPI YoY (Excl. Food, Energy & Trade) (Dec)

A:--

F: --

P: --

U.S. Chicago PMI (Jan)

A:--

F: --

P: --
Canada Federal Government Budget Balance (Nov)

A:--

F: --

P: --

U.S. Weekly Total Oil Rig Count

A:--

F: --

P: --

U.S. Weekly Total Rig Count

A:--

F: --

P: --

China, Mainland NBS Manufacturing PMI (Jan)

A:--

F: --

P: --

China, Mainland NBS Non-manufacturing PMI (Jan)

A:--

F: --

P: --

China, Mainland Composite PMI (Jan)

A:--

F: --

P: --

South Korea Trade Balance Prelim (Jan)

A:--

F: --

P: --
Japan Manufacturing PMI Final (Jan)

--

F: --

P: --

South Korea IHS Markit Manufacturing PMI (SA) (Jan)

--

F: --

P: --

Indonesia IHS Markit Manufacturing PMI (Jan)

--

F: --

P: --

China, Mainland Caixin Manufacturing PMI (SA) (Jan)

--

F: --

P: --

Indonesia Trade Balance (Dec)

--

F: --

P: --

Indonesia Inflation Rate YoY (Jan)

--

F: --

P: --

Indonesia Core Inflation YoY (Jan)

--

F: --

P: --

India HSBC Manufacturing PMI Final (Jan)

--

F: --

P: --

Australia Commodity Price YoY (Jan)

--

F: --

P: --

Russia IHS Markit Manufacturing PMI (Jan)

--

F: --

P: --

Turkey Manufacturing PMI (Jan)

--

F: --

P: --

U.K. Nationwide House Price Index MoM (Jan)

--

F: --

P: --

U.K. Nationwide House Price Index YoY (Jan)

--

F: --

P: --

Germany Actual Retail Sales MoM (Dec)

--

F: --

P: --
Italy Manufacturing PMI (SA) (Jan)

--

F: --

P: --

South Africa Manufacturing PMI (Jan)

--

F: --

P: --

Euro Zone Manufacturing PMI Final (Jan)

--

F: --

P: --

U.K. Manufacturing PMI Final (Jan)

--

F: --

P: --

Brazil IHS Markit Manufacturing PMI (Jan)

--

F: --

P: --

Canada National Economic Confidence Index

--

F: --

P: --

Canada Manufacturing PMI (SA) (Jan)

--

F: --

P: --

U.S. IHS Markit Manufacturing PMI Final (Jan)

--

F: --

P: --

U.S. ISM Output Index (Jan)

--

F: --

P: --

U.S. ISM Inventories Index (Jan)

--

F: --

P: --

U.S. ISM Manufacturing Employment Index (Jan)

--

F: --

P: --

U.S. ISM Manufacturing New Orders Index (Jan)

--

F: --

P: --

U.S. ISM Manufacturing PMI (Jan)

--

F: --

P: --

South Korea CPI YoY (Jan)

--

F: --

P: --

Japan Monetary Base YoY (SA) (Jan)

--

F: --

P: --

Australia Building Permits MoM (SA) (Dec)

--

F: --

P: --

Q&A with Experts
    • All
    • Chatrooms
    • Groups
    • Friends
    Sanjeev Ku flag
    Sanjeev Ku
    cmp 77894 btc 81467 possible from here
    . sl 77861 deep sl 77274
    Ahmed Wahe flag
    GGGGG
    Sanjeev Ku flag
    Sanjeev Ku
    cmp 77894 btc 81467 possible from here
    77894 to 79145 now
    Nawhdir Øt flag
    Nawhdir Øt flag
    😂🤦🏻‍♂️🤦🏻‍♂️😂
    zenko flag
    zenko flag
    my morning is bright
    Dharmendra flag
    Hello bitcoin price
    ABU BAKKOR SIDDQUE flag
    How are you
    zenko flag
    Israel attacks Gaza again. There will be someone who rises higher.
    Nawhdir Øt flag
    Nawhdir Øt flag
    Nawhdir Øt flag
    In a small account, I bought at the end of ±75/76K. Even though it was close, it was closed.
    uttam don flag
    huh
    AYUSH flag
    Nawhdir Øt flag
    👍
    041378WLJD flag
    Hi traders 👋 I’m looking to connect with someone who can trade all symbols (forex, gold, indices, crypto). If you have real experience and opportunities, please DM me. 🤝📈
    3487443 flag
    BTC is about to hit rock bottom at 57k to 62k.
    mbah dukun flag
    @Pengunjung3487443 40 years old..
    Mankhush R flag
    3487443
    BTC is about to hit rock bottom at 57k to 62k.
    @Visitor3487443
    Type here...
    Add Symbol or Code

      No matching data

      All
      Trump Updates
      Recommend
      Stocks
      Cryptocurrencies
      Central Banks
      Featured News
      • All
      • Russia-Ukraine Conflict
      • Middle East Flashpoint
      • All
      • Russia-Ukraine Conflict
      • Middle East Flashpoint
      Search
      Products

      Charts Free Forever

      Chats Q&A with Experts
      Screeners Economic Calendar Data Tools
      Membership Features
      Data Warehouse Market Trends Institutional Data Policy Rates Macro

      Market Trends

      Market Sentiment Order Book Forex Correlations

      Top Indicators

      Charts Free Forever
      Markets

      News

      News Analysis 24/7 Columns Education
      From Institutions From Analysts
      Topics Columnists

      Latest Views

      Latest Views

      Trending Topics

      Top Columnists

      Latest Update

      Signals

      Copy Rankings Latest Signals Become a signal provider AI Rating
      Contests
      Brokers

      Overview Brokers Assessment Rankings Regulators News Claims
      Broker listing Forex Brokers Comparison Tool Live Spread Comparison Scam
      Q&A Complaint Scam Alert Videos Tips to Detect Scam
      More

      Business
      Events
      Careers About Us Advertising Help Center

      White Label

      Data API

      Web Plug-ins

      Affiliate Program

      Awards Institution Evaluation IB Seminar Salon Event Exhibition
      Vietnam Thailand Singapore Dubai
      Fans Party Investment Sharing Session
      FastBull Summit BrokersView Expo
      Recent Searches
        Top Searches
          Markets
          News
          Analysis
          User
          24/7
          Economic Calendar
          Education
          Data
          • Names
          • Latest
          • Prev

          View All

          No data

          Scan to Download

          Faster Charts, Chat Faster!

          Download App
          English
          • English
          • Español
          • العربية
          • Bahasa Indonesia
          • Bahasa Melayu
          • Tiếng Việt
          • ภาษาไทย
          • Français
          • Italiano
          • Türkçe
          • Русский язык
          • 简中
          • 繁中
          Open Account
          Search
          Products
          Charts Free Forever
          Markets
          News
          Signals

          Copy Rankings Latest Signals Become a signal provider AI Rating
          Contests
          Brokers

          Overview Brokers Assessment Rankings Regulators News Claims
          Broker listing Forex Brokers Comparison Tool Live Spread Comparison Scam
          Q&A Complaint Scam Alert Videos Tips to Detect Scam
          More

          Business
          Events
          Careers About Us Advertising Help Center

          White Label

          Data API

          Web Plug-ins

          Affiliate Program

          Awards Institution Evaluation IB Seminar Salon Event Exhibition
          Vietnam Thailand Singapore Dubai
          Fans Party Investment Sharing Session
          FastBull Summit BrokersView Expo

          Bitcoin's price may have seen 'deepest pullback' at $77K: Analyst

          Cointelegraph
          Brevis / Tether
          +18.68%
          HumidiFi / Tether
          +22.18%
          Midnight / USD Coin
          +6.56%
          HumidiFi / USD Coin
          +4.49%
          Midnight / Tether
          +4.45%

          Bitcoin’s fall of around 7% to $77,000 on Saturday might have marked the low of this cycle, according to Bitcoin analyst PlanC.

          It comes as other crypto analysts have been calling for further downside for Bitcoin (BTC) in the coming months.

          “Decent chance this will be the deepest pullback opportunity this Bitcoin bull run,” PlanC said in an X post on Saturday.

          PlanC compares Bitcoin’s fall to previous bear market cycles

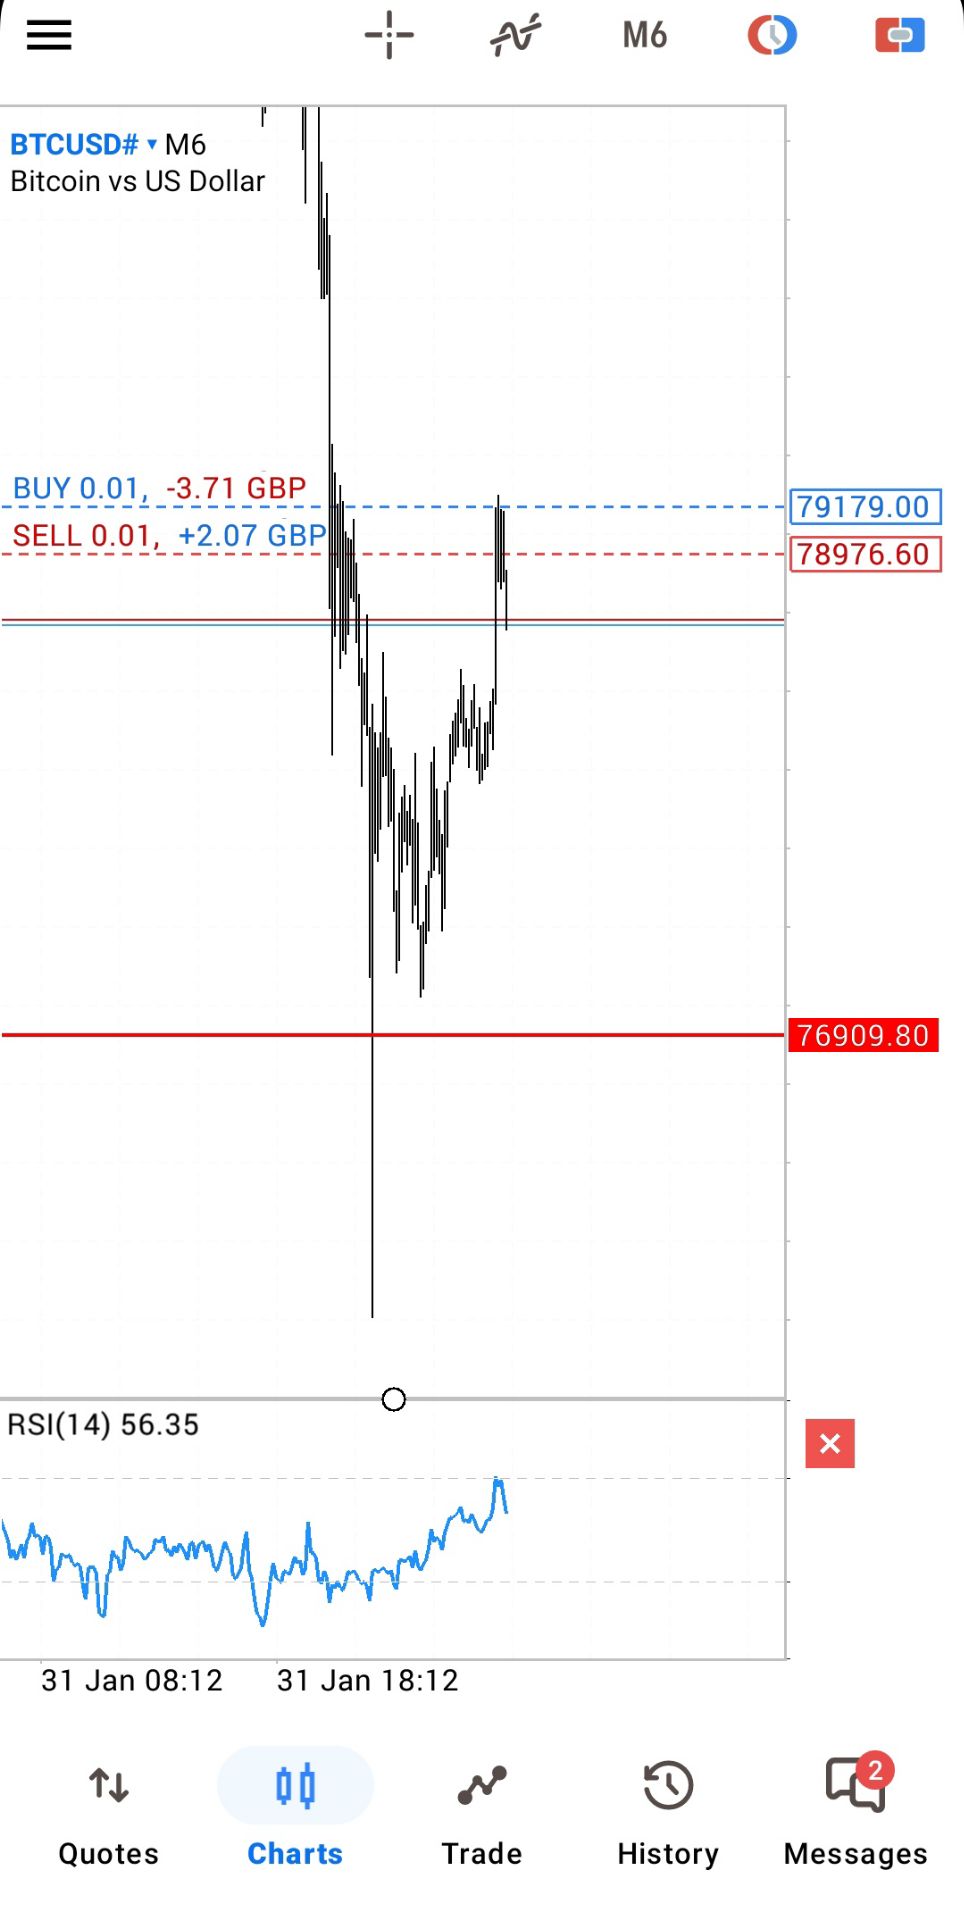
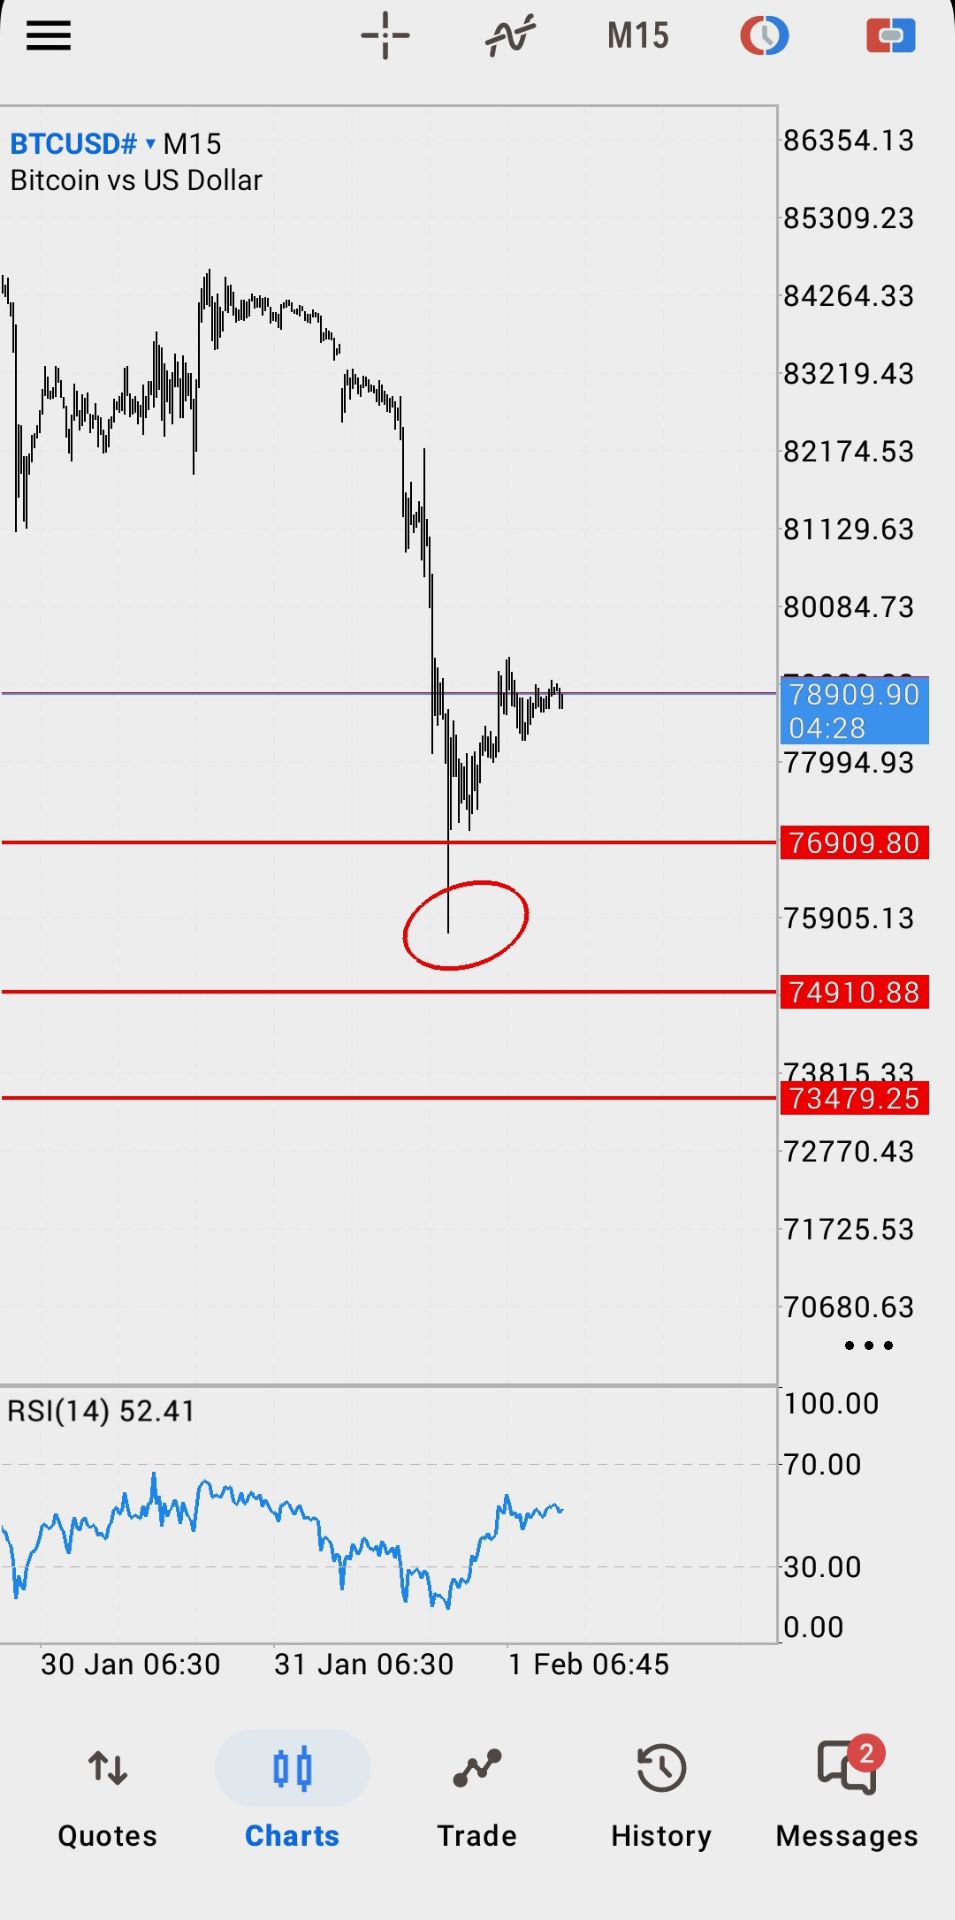
          Bitcoin fell 7% to around $77,000 on Saturday and has since slightly moved up to $78,690 at the time of publication, according to CoinMarketCap.

          The asset’s price is now down around 38% from its all-time high of $126,100, which it reached on Oct. 5. PlanC said the downtrend Bitcoin has experienced reminds him of past crashes like the 2018 bear market capitulation when Bitcoin fell to $3,000, the March 2020 crash when the asset fell to around $5,100, and the FTX and Luna collapses, which saw BTC dip to around $15,500 and $17,500 respectively.

          “There is a decent chance we are going through another major capitulation low as we speak,” PlanC said. “It seems like the ultimate low will be between $75,000 and $80,000,” he added.

          Meanwhile, Bitcoin advocate and financial accountant Rajat Soni said in an X post on Saturday that the drop down to $77,000 came during one of crypto’s more volatile parts of the week and warned traders against overreacting.

          “Never trust a weekend pump OR dump,” Soni said. “Bitcoin will make a comeback when you least expect it,” he added.

          Bitcoin $60K price level may still be in play

          However, some have been speculating that the downfall may go further.

          Veteran trader Peter Brandt recently predicted that Bitcoin could fall as low as $60,000 by the third quarter of 2026. 

          Crypto analyst Benjamin Cowen said Bitcoin’s market cycle low will likely come in early October, but “anticipates plenty of rallies will occur between now and then.”

          Meanwhile, Jurrien Timmer, Fidelity’s director of global macroeconomic research, said 2026 could be a “year off” for Bitcoin, with prices potentially falling to as low as $65,000.

          Risk Warnings and Disclaimers
          You understand and acknowledge that there is a high degree of risk involved in trading. Following any strategies or investment methods may lead to potential losses. The content on the site is provided by our contributors and analysts for information purposes only. You are solely responsible for determining whether any trading assets, securities, strategy, or any other product is suitable for investing based on your own investment objectives and financial situation.
          Add to Favorites
          Share

          SOL drops to $95 as Bitcoin, AI stocks and gold sell off: Will traders buy the dip?

          Cointelegraph
          Brevis / Tether
          +18.68%
          HumidiFi / Tether
          +22.18%
          Midnight / USD Coin
          +6.56%
          HumidiFi / USD Coin
          +4.49%
          Midnight / Tether
          +4.45%

          Key takeaways:

          • SOL fell to 2026 lows as tech sector layoffs and artificial intelligence revenue concerns hit markets.

          • Despite the bleak environment, Solana outpaced competitors with network fees jumping 81%, securing its vice-leadership.

          Solana’s native token, SOL (SOL), traded down to $100.30 on Saturday, reaching its lowest levels since April 2025. While the 18% price correction over 30 days took traders by surprise, the movement largely mirrored broader altcoin market capitalization trends. A 26% crash in silver prices on Friday further prompted cryptocurrency traders to brace for additional downside.

          SOL was able to reclaim the $102 level on Saturday, but sentiment remained weak after $165 million in leveraged bullish positions were forcefully liquidated. Sentiment worsened following escalating tensions in Iran and fears of an economic downturn after Amazon (AMZN US) announced 16,000 white-collar job cuts on Wednesday.

          Investors grew more risk-averse upon learning that OpenAI accounted for 45% of Microsoft’s (MSFT US) Azure cloud computing backlog. Additional tension stemmed from a Wall Street Journal report stating Nvidia (NVDA US) would no longer invest $100 billion in OpenAI. The ChatGPT maker is reportedly expected to face $14 billion in net losses in 2026, according to The Information.

          Despite the bleak socio-political environment, Solana onchain activity has outpaced its competitors, consolidating its position as the runner-up in network fees and Total Value Locked (TVL). Healthy onchain metrics provide a dual benefit to the native token: they increase staking returns to incentivize long-term holding while creating constant demand for data processing fees.

          Solana network fees jumped 81% above the trend over the past 30 days, according to Nansen data. Additionally, active addresses grew by 62%, and transactions soared to 2.29 billion. In comparison, the Ethereum ecosystem—including layer-2 solutions—totaled 623 million transactions, while Ethereum base layer fees grew by only 11%. Solana remained the clear leader in decentralized application (DApp) activity.

          Related: Active Solana addresses spike 115%, four in 10 merchants take Bitcoin–Month in Charts

          Demand for leveraged bullish positions on SOL vanished as traders sought safety in cash and short-term government bonds. Multi-billion dollar tech companies, including Unity (U US), AppLovin (APP US), Figma, and HubSpot (HUB US), faced price declines of 30% or more within 30 days. Gold, usually perceived as a safe haven, traded down 13% from its $5,600 all-time high reached on Thursday.

          The annualized funding rate on SOL perpetual futures plunged to -17%, meaning shorts (sellers) are paying to keep their positions open. This condition is unusual, rarely lasts long, and indicates an extreme lack of leverage appetite from bulls. The move coincided with political disputes regarding United States government funding.

          The US Senate approved a funding package on Friday, alongside a two-week stopgap measure to allow more time for government funding disputes over Department of Homeland Security funding following Democratic criticism of immigration enforcement. The US House of Representatives must vote on the final version on Monday.

          Solana spot exchange-traded funds (ETFs) saw $11 million in net outflows on Friday, according to CoinGlass. Meanwhile, listed companies using SOL as a corporate reserve strategy are under pressure. Forward Industries (FWDI US), Upexi (UPXI US), and Sharps Technology (STSS US) stocks traded 20% or more below their respective net asset values.

          SOL’s path to reclaiming bullish momentum depends largely on renewed confidence in global economic growth and reduced socio-political risks, which may not materialize in the short term.

          Risk Warnings and Disclaimers
          You understand and acknowledge that there is a high degree of risk involved in trading. Following any strategies or investment methods may lead to potential losses. The content on the site is provided by our contributors and analysts for information purposes only. You are solely responsible for determining whether any trading assets, securities, strategy, or any other product is suitable for investing based on your own investment objectives and financial situation.
          Add to Favorites
          Share

          SUI At The Smart Money Zone: Big Moves Brewing Above $2

          NewsBTC
          Brevis / Tether
          +18.68%
          HumidiFi / Tether
          +22.18%
          Midnight / USD Coin
          +6.56%
          HumidiFi / USD Coin
          +4.49%
          Midnight / Tether
          +4.45%

          SUI is approaching a critical smart money zone, with price action signaling that big moves could be on the horizon. Sustained trading above $2 may trigger a breakout, setting the stage for the next significant leg higher.

          SUI Reaches Stage For Major Money Entry

          Crypto analyst Crypto Patel, in a recent post, highlighted that SUI is at the same stage where big money typically enters the market, urging traders not to miss this opportunity. According to the weekly chart, the long-term ascending channel remains intact, and price is currently trading near a sell-side liquidity grab close to trendline support, signaling potential accumulation.

          Related Reading: SUI Reclaims Key Support With Strength — Is $2.35 The Next Target?

          The chart also shows strong weekly demand and a bullish order block between $1.15 and $0.80, indicating that the market structure is poised to turn super bullish if SUI clears higher-timeframe resistance. The current compression phase is a classic setup for expansion, meaning the market is preparing for a potential breakout.

          Crypto Patel emphasized that smart money tends to buy during compression, while retail often enters after confirmation of the move. If the breakout confirms, projected targets for SUI are $5, $10, and $20, illustrating the potential scale of the next trend. As Crypto Patel puts it, “This is how big trends are built, slowly, then suddenly. Liquidity is cleared, demand is active, and patience gets rewarded.”

          Price Trading Around $1.28

          Altcoinpedia outlined that SUI is currently trading around $1.28, which serves as the anchor for near-term market analysis. The price structure indicates ongoing consolidation above support near $1.50, while resistance is observed around $2.00. This setup reflects a tightening range as buyers and sellers balance, suggesting that a decisive move could be approaching.

          Related Reading: Sui Restores Service After Major 6-Hour Outage Shook Network

          Price oscillation within this range highlights that sustained volume expansion above $2.00 could drive the next leg of the trend toward $2.50. Conversely, failure to break this resistance, particularly with shrinking volume, increases the likelihood of a retest of support at $1.50. Should that level fail to hold, price could decline further toward $1.20.

          Momentum currently resides in a neutral state, reflecting indecision in the market. In a bullish scenario, a clean break above $2.00, confirmed by momentum indicators, would signal trend continuation. On the downside, a breach of support under heavy volume could accelerate selling pressure and confirm a bearish scenario.

          Traders are advised to use key range boundaries for entries and exits, managing risk around both support and resistance levels. For longer-term investors, it is prudent to wait for a decisive breakout from the current consolidation, which would provide a clearer signal for trend direction and reduce the risk of false moves within the neutral range.

          Risk Warnings and Disclaimers
          You understand and acknowledge that there is a high degree of risk involved in trading. Following any strategies or investment methods may lead to potential losses. The content on the site is provided by our contributors and analysts for information purposes only. You are solely responsible for determining whether any trading assets, securities, strategy, or any other product is suitable for investing based on your own investment objectives and financial situation.
          Add to Favorites
          Share

          What price will Bitcoin hit in 2026?

          Brave New Coin
          Brevis / Tether
          +18.68%
          HumidiFi / Tether
          +22.18%
          Midnight / USD Coin
          +6.56%
          HumidiFi / USD Coin
          +4.49%
          Midnight / Tether
          +4.45%

          After the weekend's crypto market dump, traders are increasingly bearish on Bitcoin, and they're expressing that via Polymarket.

          Bitcoin is now more likely to crash below $45,000 than to bounce back to $130,000 this year according to traders on Polymarket.

          Risk Warnings and Disclaimers
          You understand and acknowledge that there is a high degree of risk involved in trading. Following any strategies or investment methods may lead to potential losses. The content on the site is provided by our contributors and analysts for information purposes only. You are solely responsible for determining whether any trading assets, securities, strategy, or any other product is suitable for investing based on your own investment objectives and financial situation.
          Add to Favorites
          Share

          Why Shiba Inu Holders Should Look Forward To Sunday

          NewsBTC
          Brevis / Tether
          +18.68%
          HumidiFi / Tether
          +22.18%
          Midnight / USD Coin
          +6.56%
          HumidiFi / USD Coin
          +4.49%
          Midnight / Tether
          +4.45%

          Shiba Inu has spent recent weeks locked in a downward price action with bullish momentum fading and investor interest thinning without a clear bullish direction. However, holders may finally have something concrete to anticipate. Refreshing activity from Shytoshi Kusama, the Shiba Inu ecosystem’s lead developer, has diverted attention to a key moment expected on Sunday.

          Lead Dev Breaks Silence, Teases Sunday

          That dynamic began to change when Shytoshi Kusama, the pseudonymous lead developer and co-founder of the Shiba Inu ecosystem, resurfaced on X after a prolonged absence since early December. However, Kusama broke his silence this week with a thread on X explaining the reasons behind his inactivity and has since returned to regular posting and reposting activity.

          One post stood out more than the rest, in which Kusama hinted at a revelation scheduled for Sunday. In that message, he spoke about arriving at a discovery by pure chance and referenced what he described as an ancient marker older than time itself. Although the message was a bit cryptic, it immediately generated attention across the SHIB community, which has been hungry for direction and clarity amid recent challenges in Shiba Inu’s price action.

          The significance of Sunday became clearer following an interesting exchange between Kusama and a Shiba Inu community member who openly expressed concerns about transparency, reassurance, and leadership presence after recent ecosystem issues. 

          The community member, known as RuggRat on X, noted how there has been no official statement or simple explanation of what happened from Kusama regarding the Shibarium exploit. This is in reference to the September 2025 Shibarim Bridge exploit, which saw attackers making off with $4.1 million worth of crypto assets.

          In response, Kusama acknowledged the concern, stating that silence can sometimes be strategic and framing Sunday as a moment for addressing issues step by step. “This is what Sunday is for. One at a time,” Kusama said.

          Shytoshi Kusama™
          @ShytoshiKusama

          Fair. But sometimes silence is a weapon for quiet wars. This is what Sunday is for. One bandage. Take off. Fix. Put on. One at a time.

          Jan 29, 2026

          Shiba Inu’s Challenging Phase Has Tested Holder Confidence

          Shiba Inu’s price action has struggled to gain any meaningful upside traction since the beginning of 2026, an extension of its late 2025 run. At the time of writing, SHIB is trading around $0.0000071, keeping it pinned down by 1.8% and 10.5% in the past 24 hours and seven days, respectively. Price structure during this period has been marked by a series of lower lows, with persistent selling pressure leaving little room for a meaningful higher high to form.

          This prolonged stagnation has been difficult for many Shiba Inu holders, and many of them are increasingly becoming sellers. Furthermore, expectations around ecosystem expansion and utility has yet to reflect positively in the price. That environment is exactly why leadership communication has mattered more than usual.

          Featured image from Unsplash, chart from TradingView

          Risk Warnings and Disclaimers
          You understand and acknowledge that there is a high degree of risk involved in trading. Following any strategies or investment methods may lead to potential losses. The content on the site is provided by our contributors and analysts for information purposes only. You are solely responsible for determining whether any trading assets, securities, strategy, or any other product is suitable for investing based on your own investment objectives and financial situation.
          Add to Favorites
          Share

          Chart of the Day – Silver Volume

          Brave New Coin
          Brevis / Tether
          +18.68%
          HumidiFi / Tether
          +22.18%
          Midnight / USD Coin
          +6.56%
          HumidiFi / USD Coin
          +4.49%
          Midnight / Tether
          +4.45%

          A month ago, SLV’s volume was a rounding error compared to the spotlight tech names. A year ago it was around the 170th most traded ETF, living in oblivion. Now it’s swinging like crypto used to: manic inflows, explosive turnover, then a sharp snapback downwards. That’s not normal for a metal ETF tied to a centuries-old industrial commodity.

          Silver Volume explodes, source: X

          There’s a reason this matters for tech and markets: silver sits at the intersection of industrial demand and macro hedge psychology. It’s used in solar panels, semiconductors, EVs and data centers — the very infrastructure driving AI and green tech. But it’s also a “hard asset” fallback when markets get jittery about debt, monetary policy, and currency stress.

          The spike-then-crash pattern here doesn’t look like a simple bet on silver’s fundamentals. It feels like speculative repositioning — a blend of hedge flows, algorithmic rotation, and a dash of fear-driven capital chasing anything with liquid depth. The nearest historical echoes are things like $GME and $MSTR’s erratic runs — not because they’re related assets, but because markets collectively decide to trade something beyond its narrative. Has Silver peaked with a blow off top? Possibly.

          If SLV continues to behave like a proxy for macro stress + industrial exposure, its volume swings could be a leading indicator of broader market sentiment — especially in parts of the investor base that don’t show up in the usual tech stock chatter.

          Risk Warnings and Disclaimers
          You understand and acknowledge that there is a high degree of risk involved in trading. Following any strategies or investment methods may lead to potential losses. The content on the site is provided by our contributors and analysts for information purposes only. You are solely responsible for determining whether any trading assets, securities, strategy, or any other product is suitable for investing based on your own investment objectives and financial situation.
          Add to Favorites
          Share

          Bitcoin Slips Below This Key Zone — Is A Final Flush Coming?

          NewsBTC
          Brevis / Tether
          +18.68%
          HumidiFi / Tether
          +22.18%
          Midnight / USD Coin
          +6.56%
          HumidiFi / USD Coin
          +4.49%
          Midnight / Tether
          +4.45%

          Bitcoin has once again fallen below a critical support zone, raising questions about whether the market is gearing up for a deeper sell-off. With selling pressure still intact, traders are now watching key levels closely to see if a final flush toward lower support is imminent.

          Price Faces Another Rejection

          MakroVision Research shared on X that Bitcoin has once again met strong rejection, resulting in a decisive break below several key support levels. Price has now slipped back into the range of the previous low and continues to trade beneath the critical green resistance zone between $85,200 and $86,200, highlighting that bearish pressure remains in control for now.

          On the very short-term timeframe, there are early signs of an attempted rebound, but without a timely and sustainable reclaim of the $85,200–$86,200 zone, this move is best viewed as a technical counter-bounce rather than the start of a meaningful trend reversal. As long as the price remains capped below this area, the broader short-term downtrend remains intact.

          From a tactical perspective, the $85,200–$86,200 region has become the key battlefield. A clean reclaim and hold above this zone would be the first clear indication that selling pressure is beginning to fade, potentially allowing for price stabilization and a relief rally. 

          If this reclaim attempt fails, the risk of continued downside acceleration increases. In that case, focus would turn to the $72,300–$75,300 range, a technically prominent support zone with historical significance. This zone may ultimately serve as a potential support and reversal region should the market experience another phase of capitulation.

          CME Gap Opens: What To Expect From Bitcoin This Weekend

          Crypto analyst MartyParty, in a recent Bitcoin Wyckoff Accumulation update, highlighted that a CME gap is opening, which is expected to be filled by Sunday evening. This sets the stage for potential short-term volatility, with traders closely watching key technical levels and liquidation activity.

          Several scenarios are possible over the coming days. One possibility is the continued liquidation of remaining leveraged longs, with the lowest 25x Binance liquidation currently around $79,350, potentially completing the classic Wyckoff Spring pattern. Another scenario is a retest of secondary support at $81,800, which could act as a temporary floor for Bitcoin’s price action.

          If support at $81,800 holds, Bitcoin may trade sideways or attempt to push toward the primary support level, which has now turned into resistance at $84,800. The most probable scenario suggests a move up through $84,500 toward $86,463, followed by a retest of $84,500 on Sunday night as the CME gap is filled, completing the near-term Wyckoff accumulation setup.

          Risk Warnings and Disclaimers
          You understand and acknowledge that there is a high degree of risk involved in trading. Following any strategies or investment methods may lead to potential losses. The content on the site is provided by our contributors and analysts for information purposes only. You are solely responsible for determining whether any trading assets, securities, strategy, or any other product is suitable for investing based on your own investment objectives and financial situation.
          Add to Favorites
          Share
          FastBull
          Copyright © 2026 FastBull Ltd

          728 RM B 7/F GEE LOK IND BLDG NO 34 HUNG TO RD KWUN TONG KLN HONG KONG

          TelegramInstagramTwitterfacebooklinkedin
          App Store Google Play Google Play
          Products
          Charts

          Chats

          Q&A with Experts
          Screeners
          Economic Calendar
          Data
          Tools
          Membership
          Features
          Function
          Markets
          Copy Trading
          Latest Signals
          Contests
          News
          Analysis
          24/7
          Columns
          Education
          Company
          Careers
          About Us
          Contact Us
          Advertising
          Help Center
          Feedback
          User Agreement
          Privacy Policy
          Personal Information Protection Statement
          Business

          White Label

          Data API

          Web Plug-ins

          Poster Maker

          Affiliate Program

          Risk Disclosure

          The risk of loss in trading financial instruments such as stocks, FX, commodities, futures, bonds, ETFs and crypto can be substantial. You may sustain a total loss of the funds that you deposit with your broker. Therefore, you should carefully consider whether such trading is suitable for you in light of your circumstances and financial resources.

          No decision to invest should be made without thoroughly conducting due diligence by yourself or consulting with your financial advisors. Our web content might not suit you since we don't know your financial conditions and investment needs. Our financial information might have latency or contain inaccuracy, so you should be fully responsible for any of your trading and investment decisions. The company will not be responsible for your capital loss.

          Without getting permission from the website, you are not allowed to copy the website's graphics, texts, or trademarks. Intellectual property rights in the content or data incorporated into this website belong to its providers and exchange merchants.

          Not Logged In

          Log in to access more features

          Connect Broker
          Become a signal provider
          Help Center
          Customer Service
          Dark Mode
          Price Up/Down Colors

          Log In

          Sign Up

          Position
          Layout
          Fullscreen
          Default to Chart
          The chart page opens by default when you visit fastbull.com