

Markets
News
Analysis
User
24/7
Economic Calendar
Education
Data
- Names
- Latest
- Prev


Signal Accounts for Members
All Signal Accounts
All Contests
 U.K. Trade Balance Non-EU (SA) (Oct)
A:--
F: --
P: --
 France HICP Final MoM (Nov)
A:--
F: --
P: --
 China, Mainland Outstanding Loans Growth YoY (Nov)
A:--
F: --
P: --
China, Mainland M2 Money Supply YoY (Nov)A:--
F: --
P: --
China, Mainland M0 Money Supply YoY (Nov)A:--
F: --
P: --
China, Mainland M1 Money Supply YoY (Nov)A:--
F: --
P: --
 India CPI YoY (Nov)
A:--
F: --
P: --
India Deposit Gowth YoYA:--
F: --
P: --
 Brazil Services Growth YoY (Oct)
A:--
F: --
P: --
 Mexico Industrial Output YoY (Oct)
A:--
F: --
P: --
 Russia Trade Balance (Oct)
A:--
F: --
P: --
 Philadelphia Fed President Henry Paulson delivers a speech
 Canada Building Permits MoM (SA) (Oct)
A:--
F: --
P: --
Canada Wholesale Sales YoY (Oct)A:--
F: --
P: --
Canada Wholesale Inventory MoM (Oct)A:--
F: --
P: --
Canada Wholesale Inventory YoY (Oct)A:--
F: --
P: --
Canada Wholesale Sales MoM (SA) (Oct)A:--
F: --
P: --
 Germany Current Account (Not SA) (Oct)
A:--
F: --
P: --
U.S. Weekly Total Rig CountA:--
F: --
P: --
U.S. Weekly Total Oil Rig CountA:--
F: --
P: --
 Japan Tankan Small Manufacturing Outlook Index (Q4)
A:--
F: --
P: --
Japan Tankan Large Non-Manufacturing Diffusion Index (Q4)A:--
F: --
P: --
Japan Tankan Large Non-Manufacturing Outlook Index (Q4)A:--
F: --
P: --
Japan Tankan Large Manufacturing Outlook Index (Q4)A:--
F: --
P: --
Japan Tankan Small Manufacturing Diffusion Index (Q4)A:--
F: --
P: --
Japan Tankan Large Manufacturing Diffusion Index (Q4)A:--
F: --
P: --
Japan Tankan Large-Enterprise Capital Expenditure YoY (Q4)A:--
F: --
P: --
U.K. Rightmove House Price Index YoY (Dec)A:--
F: --
P: --
China, Mainland Industrial Output YoY (YTD) (Nov)A:--
F: --
P: --
China, Mainland Urban Area Unemployment Rate (Nov)A:--
F: --
P: --
 Saudi Arabia CPI YoY (Nov)
A:--
F: --
P: --
 Euro Zone Industrial Output YoY (Oct)
--
F: --
P: --
Euro Zone Industrial Output MoM (Oct)--
F: --
P: --
Canada Existing Home Sales MoM (Nov)--
F: --
P: --
Euro Zone Total Reserve Assets (Nov)--
F: --
P: --
U.K. Inflation Rate Expectations--
F: --
P: --
Canada National Economic Confidence Index--
F: --
P: --
Canada New Housing Starts (Nov)--
F: --
P: --
U.S. NY Fed Manufacturing Employment Index (Dec)--
F: --
P: --
U.S. NY Fed Manufacturing Index (Dec)--
F: --
P: --
Canada Core CPI YoY (Nov)--
F: --
P: --
Canada Manufacturing Unfilled Orders MoM (Oct)--
F: --
P: --
U.S. NY Fed Manufacturing Prices Received Index (Dec)--
F: --
P: --
U.S. NY Fed Manufacturing New Orders Index (Dec)--
F: --
P: --
Canada Manufacturing New Orders MoM (Oct)--
F: --
P: --
Canada Core CPI MoM (Nov)--
F: --
P: --
Canada Trimmed CPI YoY (SA) (Nov)--
F: --
P: --
Canada Manufacturing Inventory MoM (Oct)--
F: --
P: --
Canada CPI YoY (Nov)--
F: --
P: --
Canada CPI MoM (Nov)--
F: --
P: --
Canada CPI YoY (SA) (Nov)--
F: --
P: --
Canada Core CPI MoM (SA) (Nov)--
F: --
P: --
Canada CPI MoM (SA) (Nov)--
F: --
P: --
Federal Reserve Board Governor Milan delivered a speech U.S. NAHB Housing Market Index (Dec)--
F: --
P: --
 Australia Composite PMI Prelim (Dec)
--
F: --
P: --
Australia Services PMI Prelim (Dec)--
F: --
P: --
Australia Manufacturing PMI Prelim (Dec)--
F: --
P: --
Japan Manufacturing PMI Prelim (SA) (Dec)--
F: --
P: --
U.K. Unemployment Claimant Count (Nov)--
F: --
P: --
U.K. Unemployment Rate (Nov)--
F: --
P: --

No matching data
Latest Views
Latest Views
Trending Topics
Top Columnists
Latest Update
White Label
Data API
Web Plug-ins
Affiliate Program
View All
No data
According to Arkham, a wallet that had not been used for over 13 years, suddenly transferred some of its balance, showing that some of the biggest crypto fortunes were made back when Satoshi Nakamoto was still online.
The address received 312 BTC in 2012, at an average price of $12.22 per coin. At that time, the stash was worth just over $5,400. At today's market rate, the same coins are valued at over $35 million.
This week, the wallet was split into two parts: 132.03 BTC worth about $15.6 million went to a new address, while 5 BTC worth roughly $570,000 were sent directly to Kraken. The other 307.79 BTC coins stayed as they were.Arkham">
The transaction history shows that this wallet was used in the early days of the network. At that time, Bitcoin was mainly used by developers, enthusiasts and experimental platforms like SatoshiDice.
13 years later
Since these times, the wallet has only had a few small traces of dust from phishing and mixing services, but nothing significant has happened until now.
At first, whale trackers showed three separate awakenings of wallets containing 300 BTC and 444 BTC. Looking more closely, we can see that these flows are all part of the same group. They are reorganizing coins that had not been touched for over 10 years.
The level of appreciation is incredible. From less than $10,000 invested in 2012, the wallet now holds tens of millions of dollars — a profit of more than 640,000%.
Shiba Inu saw four straight days of gains since Sept. 6, reaching a high of $0.00001320 at one point in the bullish surge.
However, traders took profit as Shiba Inu confirmed short-term resistance above the daily SMA 200 at $0.000013, in particular $0.00001320, given its second retest of this level in the last three days.
Shiba Inu subsequently fell from a high of $0.0000132 in Thursday's session to a low of $0.00001293.
The move caught bullish traders who were betting on further price increases unawares, resulting in significant long liquidations.
According to CoinGlass data, a total of $154,200 SHIB positions were liquidated in the last 24 hours, the majority of which were longs, while shorts came in at just $4,970.
A total of 11,479,230,769 SHIB, or $149,230 in monetary terms, were liquidated in long positions in the last 24 hours, according to CoinGlass data.
Shiba Inu news
Shiba Inu layer 2 Shibarium has hit a new block milestone, surpassing 13 million blocks.
According to recent Shibarium scan data, total blocks now stand at 13,017,085, and total addresses are now at 272,282,541; the total transaction count on Shibarium is now at 1,568,161,370.
Earlier in the week, Shiba Inu developer Kaal Dhairya provided an update on the upcoming Leash v2, an ERC-20 token implemented with OpenZeppelin libraries as ERC20 and ERC20Permit (EIP-2612) and ERC20Burnable.
A full independent audit of the integrated Leash v2 system has been completed, with the launch expected soon and further information to be published by the team.
By Steve Gelsi
Crypto-trading and stablecoin company raises $788 million and is valued at more than $5 billion after recently upsized IPO prices above the expected range
Blockchain-technology specialist Figure Technology Solutions will begin trading on Nasdaq on Thursday.
Figure Technology Solutions Inc.'s initial public offering priced well above the top of the estimated price range, even after the estimated range and offering size were recently raised, in a sign of strong investor demand for the profitable cryptocurrency-trading and stablecoin company's stock ahead of its Thursday debut.
The pricing of Figure's IPO comes just after Klarna Group PLC's stock (KLAR) rose 14.6% on its first day of trading. The buy-now-pay-later company's IPO also priced above its range. A busy day is expected for IPOs on Friday, highlighted by the anticipated debut of crypto exchange Gemini Space Station Inc. (GEMI), which saw its estimated IPO-pricing range raised earlier this week.
The Renaissance IPO ETF IPO, which climbed 1.4% in morning trading Thursday, has soared 22.2% in 2025, while the S&P 500 index SPX has advanced 11.7%.
Read: Klara leads busiest week for big IPOs in four years. Will newly public stocks stay hot?
Shares of New York-based Figure Technology (FIGR) will trade on the Nasdaq exchange under the symbol "FIGR." IPO stock typically start trading between 11 a.m. and 1 p.m. Eastern time.
Figure Technology, a profitable financial technology company co-founded by a former chief executive officer of Sofi Technologies Inc. (SOFI), specializes in blockchain access to help lenders provide home-equity loans.
The IPO of 31.5 million shares was priced late Wednesday at $25. That was after the estimated pricing range was raised earlier this week to $20 to $22 from $18 to $20. The number of shares being offered was also raised, from 26.65 million shares.
With the pricing, the company took in $787.5 million. And with 211.66 shares outstanding, the company was valued at $5.29 billion.
The lead underwriters of Figure's IPO include Wall Street heavyweights Goldman Sachs, Jefferies and BofA Securities.
Four more deals are on deck for Friday: heating and ventilation company Legence Corp. (LGN) ($702 million in expected IPO proceeds), traffic-management company Via Transportation Inc. (VIA) ($450 million), cryptocurrency exchange Gemini Space Station Inc. (GEMI) ($417 million) and coffee chain Black Rock Coffee Bar Inc. (BRCB) ($250 million).
The IPO market has been fueled by a backlog of companies that have grown larger partly by raising money in private markets, as well as a continued rally in the stock market, with the S&P 500 setting a new all-time closing high on Wednesday.
Other tailwinds for IPOs include growth in quickly growing industries such as cryptocurrencies, artificial intelligence and data centers.
Figure Technology runs blockchain marketplace to originate loans
Figure Technology describes itself as a blockchain-native capital marketplace that connects origination, funding and secondary-market activity among lenders and borrowers.
It was co-founded in 2018 by Executive Chairman Michael Cagney and board member June Ou, who is Cagney's spouse.
Cagney was Chief Executive of Sofi from 2011 to 2017.
In 2020, Figure Technology completed the first securitization of blockchain-native consumer loans in the industry, according to the company.
"We believe we are the largest real world asset player in public blockchain, and no one else has been able to catch up to us," Cagney said in the company's IPO prospectus.
At last check, Figure Technology has worked with more than 160 partners for its loan-origination system and capital marketplace, with more than $16 billion in home-equity loans to date.
It runs Figure Connect, its consumer credit marketplace, and Democratized Prime, which it describes as "Figure's on-chain lend-borrow marketplace."
The company reported net income of $29 million on revenue of $191 million in the six months ending June 30. In the year-ago period, it reported a net loss of $13 million on revenue of $156 million.
In full-year 2024, it generated $341 million in revenue and net income of $17.2 million, up from revenue of $209.6 million and a net loss of $47.94 million for full-year 2023.
-Steve Gelsi
This content was created by MarketWatch, which is operated by Dow Jones & Co. MarketWatch is published independently from Dow Jones Newswires and The Wall Street Journal.
By Steve Goldstein
The rejection means that there's a limit to how much crypto will enter investor portfolios through the back door
The S&P 500 index is not including Michael Saylor's Strategy - and other indexes could follow suit, JPMorgan said.
The S&P 500's refusal to include the company previously called MicroStrategy raises questions about the sustainability of the business model of corporate treasury investments in cryptocurrency.
JPMorgan strategists led by Nikolaos Panigirtzoglou say the decision by S&P Dow Jones Indices last week not to promote the company that's now called Strategy (MSTR) into the S&P 500 index SPX, even though it meets size and other key requirements for inclusion, was an important one.
S&P Dow Jones Indices, as is its custom, did not comment on Strategy's exclusion, and it did not respond to a question from MarketWatch. But it is notable that S&P also does not include closed-end funds and exchange-traded funds in the S&P 500. Although Strategy isn't technically an investment company, it fundamentally acts as one, as the lion's share of its market capitalization is based on its holdings of bitcoin (BTCUSD) rather than on its underlying information-technology business.
"This is signaling that the committee, which can apply discretion in its index inclusion decisions, is concerned about including in the S&P 500 index companies such as MicroStrategy that are effectively bitcoin funds. This rejection is a blow to not only MicroStrategy but also other corporate crypto treasuries that have proliferated in recent months in an attempt to replicate MicroStrategy's crypto accumulation model," the strategists said.
The rejection means that there's a limit to how much crypto will enter investor portfolios through the back door. "More importantly, the risk going forward is in our opinion that other index providers that have already included MicroStrategy or other corporate crypto treasuries into their equity indices, might rethink their approach," they said.
The Nasdaq, they note, has reportedly begun requiring certain companies holding crypto assets to seek shareholder approval before issuing new shares to fund crypto purchases.
"As more questions are raised about the sustainability of corporate treasuries, the risk is that both investors and index providers shift their preference away from corporate treasuries towards crypto companies with real operating businesses such as crypto exchanges or miners," they added.
It's been a big week for those crypto corporate treasury plays, with EightCo Holdings (OCTO) and CaliberCos (CWD) each seeing wild spikes higher after crypto purchase announcements. That said, many of the so-called digital-acquisition companies have dropped in value since their crypto announcements, and Strategy's premium from the underlying bitcoin it holds has dropped from over 3 to 1.6.
-Steve Goldstein
This content was created by MarketWatch, which is operated by Dow Jones & Co. MarketWatch is published independently from Dow Jones Newswires and The Wall Street Journal.
Solana has, in the last seven days, gained nearly 10% in price, helping the coin flip the $220 resistance level. In the last 72 hours, Solana has found stability above this price level, leading to bullish sentiment. The coin’s technical indicator is also hinting at more growth.
Solana trading volume poses breakout concern
Notably, Solana has confirmed a golden cross on its technical chart, which suggests a bullish rally might be underway. A golden cross occurs when a short-term moving average crosses above a long-term moving average. This occurrence for Solana could trigger an increase in its price.Solana Price Chart | Source: TradingView">
With SOL finding stability above $220, this bullish technical signal could catalyze an increase in buying pressure from investors. Additionally, the market rotation favors altcoins, and this could serve as another incentive to invest in Solana.
However, for SOL’s price to witness a massive breakout, it needs a corresponding volume boost. As of press time, Solana’s trading volume remains in the red zone, down by 3.42% at $9.02 billion in the last 24 hours. Meanwhile, SOL is changing hands at $227.09, which represents a 1.7% increase within the same time frame.
In order for Solana to maintain its stability above the $220 level and hit new highs, Solana bulls need to step in and support the price outlook.
Solana Alpenglow influence
Recently, the Solana blockchain has been busy with billions of transactions. In August, Solana registered 2.9 billion transactions, eclipsing its rival, Ethereum. Solana’s August count represents Ethereum’s total since its launch in 2015. This suggests that Solana has what it takes to support a rally.
Meanwhile, validators on the blockchain have given the go-ahead for activation of the Alpenglow upgrade. The upgrade will make Solana the fastest layer 1, as it will reduce transaction finality to below 150 milliseconds.
Arkham Intelligence has unveiled its latest rankings of the world’s largest crypto holders.
Top exchanges, institutions, major protocols, corporations, and early adopters are all in the list, reflecting a diverse mix of players.
In the list, Arkham has grouped wallets that belong to the same person, company, protocol, or exchanges, into entities. This provides a clearer view of an entity’s total holdings and its real influence in the crypto market. Together, these entities control roughly $1.6 trillion in crypto.
The Top Crypto Holders
Binance tops the list with over $209 billion worth of crypto. Right behind is Coinbase, the U.S.-based exchange, with more than $155 billion in crypto. Satoshi Nakamoto, Bitcoin’s pseudonymous creator, stands at number three, with over $125 billion in Bitcoin.
In the top five, is BlackRock, the world’s largest asset manager, with over $100 billion in crypto exposure. Fidelity Custody and Grayscale are in the top 10 with $47.5 billion and $34 billion in crypto holdings. MicroStrategy, the Bitcoin treasury giant has amassed more than $53 billion worth of BTC.
Exchanges, DeFi Protocols, Governments, and Major Crypto Players
South Korea’s leading exchange, Upbit, has over $32 billion in crypto. Major exchanges like OKX, Kraken, and Bitfinex each hold over $30 billion in crypto. Meanwhile, decentralised protocols, Lido and Aave hold nearly $70 billion and over $31 billion in crypto.
Governments are also in the list with the U.S holding about $23 billion in crypto, while the U.K. controls around $6.9 billion. Other notable entities on the list include projects like Pump.fun with $3.3 billion, Mt. Gox with $3.9 billion and key networks such as Polygon with $10.6 billion. The Official Trump Meme also holds over $7 billion in crypto.
Tron founder Justin Sun and Winklevoss Capital also hold over $2 billion each in crypto.
Corporate Crypto Treasuries
Publicly traded companies collectively hold over 1 million BTC. Companies are not just investing in Bitcoin, they are increasingly exploring other cryptocurrencies as well. Ethereum treasuries are also gaining strength with entities now holding 4.91 million ETH. Solana, Dogecoin, and BNB Coin are also held by companies in their treasuries.
This data highlights the growing diversity of crypto holders, from exchanges and DeFi protocols to governments, early investors, and corporate treasuries. While Bitcoin continues to dominate, entities are also diversifying into Ethereum and other tokens.
Key takeaways:
Gemini AI serves as a powerful tool for researching day trade strategies but cannot be used to execute trades directly.
It summarizes fundamentals and compares assets to support daily trade decisions but still requires access to data sets.
Gemini AI helps manage trading discipline by turning watchlists, catalysts and post-mortems into structured loops that prevent traders from chasing noise.
Gemini Flash 2.5, the latest version, still lacks real-time data access, so pair it with data from tools like TradingView, Glassnode or Nansen.
Day trading crypto moves fast, order books flip, narratives rotate, and liquidity pockets appear then vanish. Google’s Gemini AI can help you organize information, test ideas and automate routine analysis. It can function as a smart assistant that allows you to filter noise, structure market data and enable you to make insight-driven decisions.
This article shows you a safe, compliance-minded workflow to research, simulate and automate parts of a day-trading stack using Gemini AI without handing it your keys or “letting the AI trade for you.”
It is important to note that all prompts and examples were tested on Gemini Flash 2.5, which doesn’t stream real-time market data. That means you’ll need to cross-check AI-generated insight against live charts and reliable sources before acting on it. Crypto is volatile, so do your own research and trade responsibly.
What is crypto day trading, and why is it brutal without AI?
Day trading in crypto means opening and closing positions within the same day, often within hours or even minutes. Unlike swing traders who ride trends for days or long-term investors who hold for months, day traders thrive on short-term price moves.
Volatility is their playground, and crypto offers it in overdrive. That overdrive shows up in several ways unique to crypto markets:
24/7 markets: There’s no closing bell. BTC can break out at 3 am.
Narrative-driven pumps: A token upgrade or social media post can flip sentiment instantly.
Liquidity pockets: Order books thin out, and slippage can wreck an unplanned entry.
Noise overload: Telegram, X, Discord, onchain alerts and macro news with hundreds of signals compete for attention.
This is where AI tools like Google’s Gemini fit in. They don’t replace the trader but act as a co-pilot. They help by:
Summarizing order flow and sentiment
Filtering catalysts that actually move the price from background noise
Structuring data into sheets or dashboards so you see setups clearly
Helping you write, test and refine rules (instead of chasing FOMO).
What Gemini can (and can’t) do for crypto day traders
What it can do well
Reason over large context: Newer Gemini releases (e.g., Gemini 2.5 Pro) focus on long-context reasoning and strong coding ability, ideal for stitching market data and your notes into actionable summaries.
Live inside your tools: Gemini works across Google Workspace apps, including Docs and Sheets, where it can summarize data, clean it and generate charts, now even through in-cell AI functions in Sheets.
Developer-friendly: With Google AI Studio and the Gemini API, you can programmatically prompt models, analyze data sets and integrate outputs into your scripts or dashboards.
What it shouldn’t do (directly)
Hold crypto keys or auto-trade unsupervised. Keep Gemini focused on analysis, signal generation, backtesting and alerts. If you do connect to an exchange API, strictly gate permissions.
Did you know? Google’s Gemini can process up to 1 million tokens in a single prompt, meaning traders can feed entire research reports, news flows and charts into one query for faster insights.
Select and set up your Gemini access and workspace
1. Pick your Gemini access level
Google AI Studio + API key for developers building prompts and scripts.
Gemini in Workspace (Docs/Sheets) for no-code research and dashboards.
Google now bundles “Advanced” features under the Google AI Pro subscription for the Gemini app (bigger context windows, deeper research and brainstorming ideas with Gemini). If you need maximum context for multi-asset intraday notes, that can help.
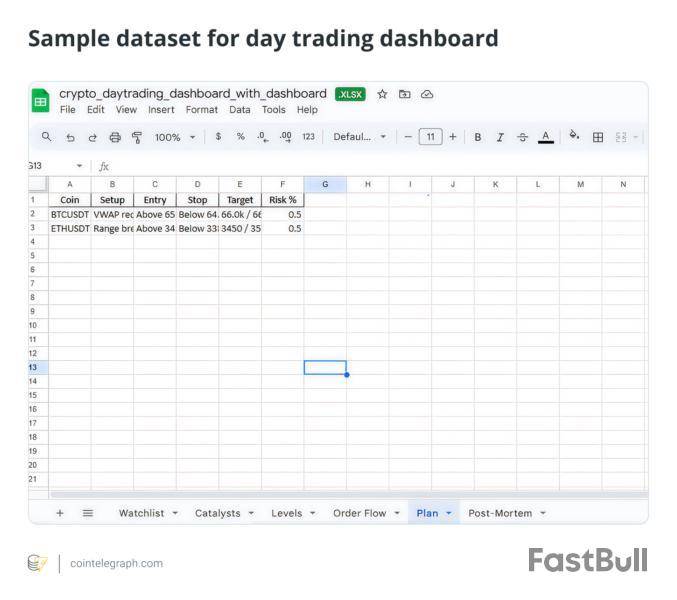
2. Create a trading notebook in Google Sheets
Once you’ve chosen your Gemini access (Sheets, Docs or API for developers), the next step is to create a trading notebook, a structured space where AI helps you organize chaos into clarity.
A simple Google Sheet with six tabs, as follows, can be a start:
Watchlist: Track the tokens you’re monitoring.
Catalysts: Note key events (upgrades, unlocks, macro reports).
Levels: Mark out support, resistance and liquidity pockets.
Order flow: Capture onchain flows, funding rates or order book imbalance.
Plan: Write your playbook before the session begins.
Post-mortem: Log what worked, what failed and what to improve.
Instead of staring at X or 10 chart tabs, you’re creating a repeatable loop: Watchlist → Catalysts → Levels → Plan → Order Flow → Post-Mortem → back to Watchlist. Gemini slots into each step as a reasoning partner.
While you can manually create data sets, another way to run a trading loop is via data sets downloaded from analytics providers like Glassnode, TradingView or CryptoQuant.
Did you know? In a 2025 global survey of regulators, IOSCO reported that among broker-dealers, algorithmic trading (63%) was one of the most commonly observed AI use cases, alongside surveillance (53%), client communications (67%) and market analysis/trading insights (40%).
Day trade using Gemini AI
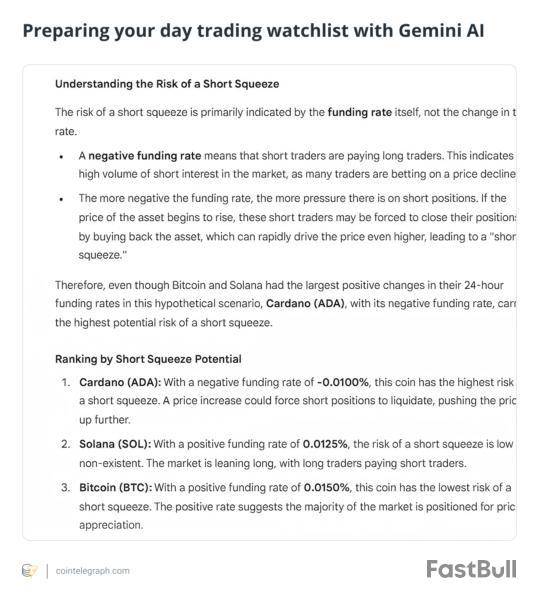
Example: Using Gemini AI to refine a watchlist
Say your watchlist includes Bitcoin (BTC), Cardano (ADA) and Solana (SOL). Instead of scanning 50 tokens, you ask Gemini to highlight which ones had the biggest market swings or the highest percentage changes in the past 24 hours (pulled from your own data feed or an external data platform).
A prompt might look like:
“Summarize the top three coins by 24-hour price change from this data set. Rank them by potential risk of shorting.”
Gemini will produce you context and a structured ranking that helps you focus your limited time on the most volatile assets based on the data set you provided.
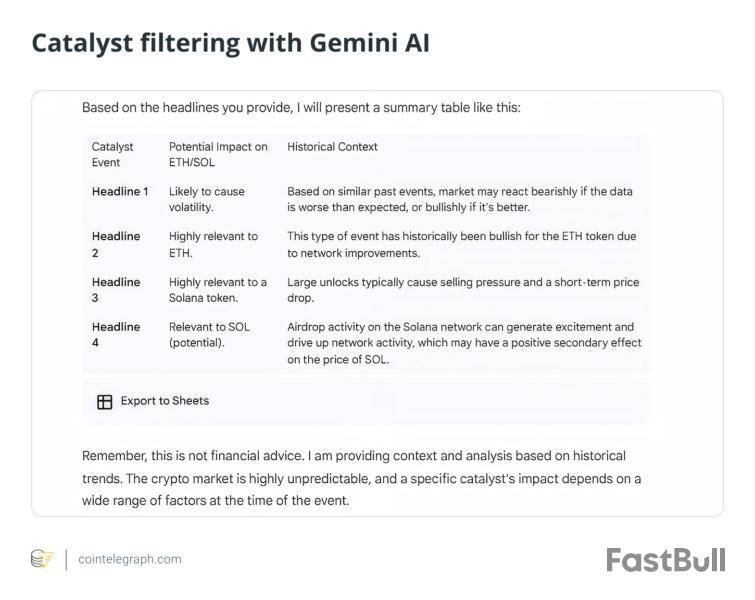
Example: Using Gemini AI for catalyst filtering
Catalysts drive intraday moves, Consumer Price Index reports, US Federal Reserve minutes, token unlocks, tech upgrades or even airdrop rumors. But there’s more noise than signal. Instead of manually scrolling through X or Discord, paste in the headlines and ask Gemini AI.
A prompt might look like:
“Flag which of these news catalysts are most likely to impact ETH and SOL in the next 12 hours, based on past price reactions.”
Example: Levels and liquidity mapping
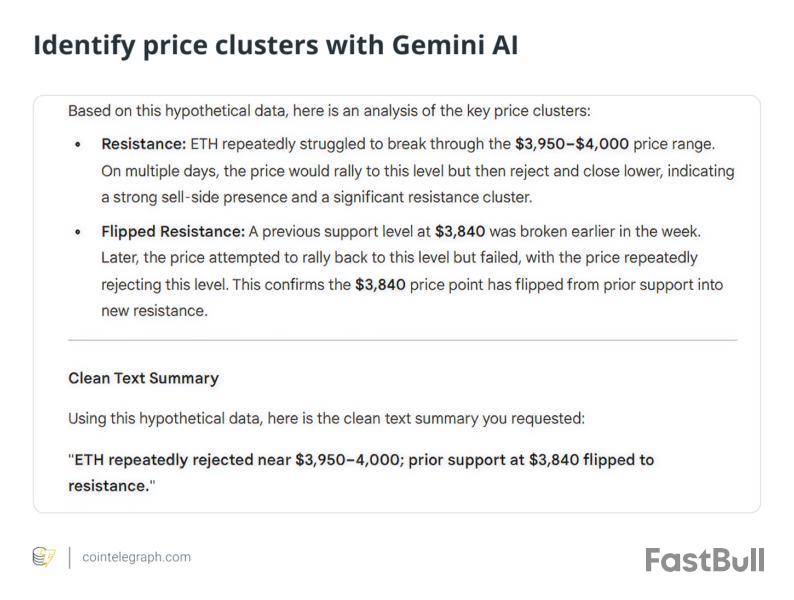
Support and resistance levels are the bread and butter of day trading. Gemini can’t stream live order books, but you can feed it recent OHLCV (open, high, low, close and volume) data or your own notes, then ask:
“Identify the key price clusters where ETH was rejected multiple times this week and summarize as possible resistance.”
Instead of eyeballing, you get a clean text summary: “ETH repeatedly rejected near $3,950-$40,000; prior support at $3,840 flipped resistance.”
Example: Using Gemini AI for order flow sentiment
If you’re tracking open interest, long/short ratios or whale wallet flows, Gemini AI can help make sense of it:
“Summarize whether current BTC futures positioning looks more skewed to longs or shorts.”
You still need the raw BTC data downloaded from your trading portals, but Gemini AI’s summary can help you avoid tunnel vision. Instead of staring at numbers, you can request an interpreted snapshot that tells you whether the crowd is leaning long, short or neutral.
Example: Using Gemini AI for a daily trading plan
The Plan tab is where Gemini helps enforce discipline. A prompt like:
“Take today’s Watchlist, Catalysts and Levels tabs and draft three possible intraday scenarios with triggers and invalidations.”
That might provide an output like:
Scenario A: Ether (ETH) breaks above $3,000 on high volume; long scalp with stop at $2,960.
Scenario B: BTC rejects $105,000 resistance again and fades into $100,000.
Scenario C: SOL reacts negatively to unlock event; short bounce into $170.
Now you’ve got a structured plan instead of winging it.
Example: Using Gemini AI for a post-mortem review
After the session, you can paste your trades into Gemini AI and ask:
“Analyze my last five trades and identify patterns in mistakes or strengths.”
It might spot that you cut winners too early but let losers run, or that you always overtrade during high volatility. This turns mistakes into structured lessons.
How can Gemini AI support risk management?
Risk is the one variable every day trader must control because surviving bad trades matters more than catching perfect ones. Use Gemini AI for a discipline check:
Position sizing: Share your account size and maximum risk per trade, and Gemini AI can calculate safe position sizes under different leverage scenarios.
Scenario planning: Instead of mapping only bullish setups, prompt Gemini AI to also outline bearish and sideways cases so you’re never locked into one bias.
Risk-to-reward ratios: Paste your planned setups into Gemini and ask it to rank them by “r/r” ratio. This keeps your focus on the highest-quality trades.
Capital allocation: Ask Gemini to summarize your exposure across assets (e.g., too much ETH beta) so you can rebalance before it’s too late.
Day trading crypto will always be a high-speed, high-risk game. What Gemini AI offers isn’t shortcuts, but the ability to process more information, stick to your rules and refine strategies faster than you could alone.
This article does not contain investment advice or recommendations. Every investment and trading move involves risk, and readers should conduct their own research when making a decision.
728 RM B 7/F GEE LOK IND BLDG NO 34 HUNG TO RD KWUN TONG KLN HONG KONG


White Label
Data API
Web Plug-ins
Poster Maker
Affiliate Program
The risk of loss in trading financial instruments such as stocks, FX, commodities, futures, bonds, ETFs and crypto can be substantial. You may sustain a total loss of the funds that you deposit with your broker. Therefore, you should carefully consider whether such trading is suitable for you in light of your circumstances and financial resources.
No decision to invest should be made without thoroughly conducting due diligence by yourself or consulting with your financial advisors. Our web content might not suit you since we don't know your financial conditions and investment needs. Our financial information might have latency or contain inaccuracy, so you should be fully responsible for any of your trading and investment decisions. The company will not be responsible for your capital loss.
Without getting permission from the website, you are not allowed to copy the website's graphics, texts, or trademarks. Intellectual property rights in the content or data incorporated into this website belong to its providers and exchange merchants.
Not Logged In
Log in to access more features

FastBull Membership
Not yet
Purchase


Log In
Sign Up


