• Trade
  • Markets
  • Copy
  • Contests
  • News
  • 24/7
  • Calendar
  • Q&A
  • Chats
Trending
Screeners
SYMBOL
LAST
BID
ASK
HIGH
LOW
NET CHG.
%CHG.
SPREAD
SPX
S&P 500 Index
6870.39
6870.39
6870.39
6895.79
6858.28
+13.27
+ 0.19%
--
DJI
Dow Jones Industrial Average
47954.98
47954.98
47954.98
48133.54
47871.51
+104.05
+ 0.22%
--
IXIC
NASDAQ Composite Index
23578.12
23578.12
23578.12
23680.03
23506.00
+72.99
+ 0.31%
--
USDX
US Dollar Index
98.930
99.010
98.930
98.960
98.730
-0.020
-0.02%
--
EURUSD
Euro / US Dollar
1.16483
1.16490
1.16483
1.16717
1.16341
+0.00057
+ 0.05%
--
GBPUSD
Pound Sterling / US Dollar
1.33157
1.33166
1.33157
1.33462
1.33136
-0.00155
-0.12%
--
XAUUSD
Gold / US Dollar
4209.67
4210.10
4209.67
4218.85
4190.61
+11.76
+ 0.28%
--
WTI
Light Sweet Crude Oil
59.230
59.260
59.230
60.084
59.160
-0.579
-0.97%
--

Community Accounts

Signal Accounts
--
Profit Accounts
--
Loss Accounts
--
View More

Become a signal provider

Sell trading signals to earn additional income

View More

Guide to Copy Trading

Get started with ease and confidence

View More

Signal Accounts for Members

All Signal Accounts

Best Return
  • Best Return
  • Best P/L
  • Best MDD
Past 1W
  • Past 1W
  • Past 1M
  • Past 1Y

All Contests

  • All
  • Trump Updates
  • Recommend
  • Stocks
  • Cryptocurrencies
  • Central Banks
  • Featured News
Top News Only
Share

India Foreign Ministry: Advise Indian Nationals To Exercise Caution While Travelling To Or Transiting Through China

Share

Agrural - Brazil's 2025/26 Total Corn Output Seen At 135.3 Million Tonnes Versus 141.1 Million Tonnes In Previous Season

Share

Agrural - Brazil's 2025/26 Soybean Planting Hits 94% Of Expected Area As Of Last Thursday

Share

SEBI: Modalities For Migration To Ai Only Schemes And Relaxations To Large Value Funds For Accredited Investors

Share

All 6 Bank Of Israel Monetary Policy Committee Members Voted To Lower Benchmark Interest Rate 25 Bps To 4.25% On Nov 24

Share

India Government: Cancellations Are On Account Of Developer Delays And Not Due To Transmission Side Delays

Share

Fitch: We See Moderation Of Export Performance In China In 2026

Share

India Government: Revokes Grid Access Permissions For Renewable Energy Projects

Share

Stats Office - Tanzania Inflation At 3.4% Year-On-Year In November

Share

Temasek CEO Dilhan Pillay: We Are Taking A Conservative Stance On Allocating Capital

Share

Brazil Economists See Brazilian Real At 5.40 Per Dollar By Year-End 2025 Versus 5.40 In Previous Estimate - Central Bank Poll

Share

Brazil Economists See Year-End 2026 Interest Rate Selic At 12.25% Versus 12.00% In Previous Estimate - Central Bank Poll

Share

Brazil Economists See Year-End 2025 Interest Rate Selic At 15.00% Versus 15.00% In Previous Estimate - Central Bank Poll

Share

EU Commission Says Meta Has Committed To Give EU Users Choice On Personalised Ads

Share

Sources Revealed That The Bank Of England Has Invited Employees To Voluntarily Apply For Layoffs

Share

The Bank Of England Plans To Cut Staff Due To Budget Pressures

Share

Traders Believe There Is Less Than A 10% Chance That The European Central Bank Will Cut Interest Rates By 25 Basis Points In 2026

Share

Egypt, European Bank For Reconstruction And Development Sign $100 Million Financing Agreement

Share

Israel Budget Deficit 4.5% Of GDP In November Over Past 12 Months Versus 4.9% Deficit In October

Share

JPMorgan - Council Chaired By Jamie Dimon Includes Jeff Bezos

TIME
ACT
FCST
PREV
France Industrial Output MoM (SA) (Oct)

A:--

F: --

P: --
France Trade Balance (SA) (Oct)

A:--

F: --

P: --
Euro Zone Employment YoY (SA) (Q3)

A:--

F: --

P: --
Canada Part-Time Employment (SA) (Nov)

A:--

F: --

P: --

Canada Unemployment Rate (SA) (Nov)

A:--

F: --

P: --

Canada Full-time Employment (SA) (Nov)

A:--

F: --

P: --

Canada Labor Force Participation Rate (SA) (Nov)

A:--

F: --

P: --

Canada Employment (SA) (Nov)

A:--

F: --

P: --

U.S. PCE Price Index MoM (Sept)

A:--

F: --

P: --

U.S. Personal Income MoM (Sept)

A:--

F: --

P: --

U.S. Core PCE Price Index MoM (Sept)

A:--

F: --

P: --

U.S. PCE Price Index YoY (SA) (Sept)

A:--

F: --

P: --

U.S. Core PCE Price Index YoY (Sept)

A:--

F: --

P: --

U.S. Personal Outlays MoM (SA) (Sept)

A:--

F: --

P: --
U.S. 5-10 Year-Ahead Inflation Expectations (Dec)

A:--

F: --

P: --

U.S. Real Personal Consumption Expenditures MoM (Sept)

A:--

F: --

P: --
U.S. Weekly Total Rig Count

A:--

F: --

P: --

U.S. Weekly Total Oil Rig Count

A:--

F: --

P: --

U.S. Consumer Credit (SA) (Oct)

A:--

F: --

P: --
China, Mainland Foreign Exchange Reserves (Nov)

A:--

F: --

P: --

Japan Trade Balance (Oct)

A:--

F: --

P: --

Japan Nominal GDP Revised QoQ (Q3)

A:--

F: --

P: --

China, Mainland Imports YoY (CNH) (Nov)

A:--

F: --

P: --

China, Mainland Exports (Nov)

A:--

F: --

P: --

China, Mainland Imports (CNH) (Nov)

A:--

F: --

P: --

China, Mainland Trade Balance (CNH) (Nov)

A:--

F: --

P: --

China, Mainland Exports YoY (USD) (Nov)

A:--

F: --

P: --

China, Mainland Imports YoY (USD) (Nov)

A:--

F: --

P: --

Germany Industrial Output MoM (SA) (Oct)

A:--

F: --

P: --
Euro Zone Sentix Investor Confidence Index (Dec)

A:--

F: --

P: --

Canada National Economic Confidence Index

--

F: --

P: --

U.K. BRC Like-For-Like Retail Sales YoY (Nov)

--

F: --

P: --

U.K. BRC Overall Retail Sales YoY (Nov)

--

F: --

P: --

Australia Overnight (Borrowing) Key Rate

--

F: --

P: --

RBA Rate Statement
RBA Press Conference
Germany Exports MoM (SA) (Oct)

--

F: --

P: --

U.S. NFIB Small Business Optimism Index (SA) (Nov)

--

F: --

P: --

Mexico 12-Month Inflation (CPI) (Nov)

--

F: --

P: --

Mexico Core CPI YoY (Nov)

--

F: --

P: --

Mexico PPI YoY (Nov)

--

F: --

P: --

U.S. Weekly Redbook Index YoY

--

F: --

P: --

U.S. JOLTS Job Openings (SA) (Oct)

--

F: --

P: --

China, Mainland M1 Money Supply YoY (Nov)

--

F: --

P: --

China, Mainland M0 Money Supply YoY (Nov)

--

F: --

P: --

China, Mainland M2 Money Supply YoY (Nov)

--

F: --

P: --

U.S. EIA Short-Term Crude Production Forecast For The Year (Dec)

--

F: --

P: --

U.S. EIA Natural Gas Production Forecast For The Next Year (Dec)

--

F: --

P: --

U.S. EIA Short-Term Crude Production Forecast For The Next Year (Dec)

--

F: --

P: --

EIA Monthly Short-Term Energy Outlook
U.S. API Weekly Gasoline Stocks

--

F: --

P: --

U.S. API Weekly Cushing Crude Oil Stocks

--

F: --

P: --

U.S. API Weekly Crude Oil Stocks

--

F: --

P: --

U.S. API Weekly Refined Oil Stocks

--

F: --

P: --

South Korea Unemployment Rate (SA) (Nov)

--

F: --

P: --

Japan Reuters Tankan Non-Manufacturers Index (Dec)

--

F: --

P: --

Japan Reuters Tankan Manufacturers Index (Dec)

--

F: --

P: --

Japan Domestic Enterprise Commodity Price Index MoM (Nov)

--

F: --

P: --

Japan Domestic Enterprise Commodity Price Index YoY (Nov)

--

F: --

P: --

China, Mainland PPI YoY (Nov)

--

F: --

P: --

China, Mainland CPI MoM (Nov)

--

F: --

P: --

Q&A with Experts
    • All
    • Chatrooms
    • Groups
    • Friends
    Connecting
    .
    .
    .
    Type here...
    Add Symbol or Code

      No matching data

      All
      Trump Updates
      Recommend
      Stocks
      Cryptocurrencies
      Central Banks
      Featured News
      • All
      • Russia-Ukraine Conflict
      • Middle East Flashpoint
      • All
      • Russia-Ukraine Conflict
      • Middle East Flashpoint
      Search
      Products

      Charts Free Forever

      Chats Q&A with Experts
      Screeners Economic Calendar Data Tools
      Membership Features
      Data Warehouse Market Trends Institutional Data Policy Rates Macro

      Market Trends

      Market Sentiment Order Book Forex Correlations

      Top Indicators

      Charts Free Forever
      Markets

      News

      News Analysis 24/7 Columns Education
      From Institutions From Analysts
      Topics Columnists

      Latest Views

      Latest Views

      Trending Topics

      Top Columnists

      Latest Update

      Signals

      Copy Rankings Latest Signals Become a signal provider AI Rating
      Contests
      Brokers

      Overview Brokers Assessment Rankings Regulators News Claims
      Broker listing Forex Brokers Comparison Tool Live Spread Comparison Scam
      Q&A Complaint Scam Alert Videos Tips to Detect Scam
      More

      Business
      Events
      Careers About Us Advertising Help Center

      White Label

      Data API

      Web Plug-ins

      Affiliate Program

      Awards Institution Evaluation IB Seminar Salon Event Exhibition
      Vietnam Thailand Singapore Dubai
      Fans Party Investment Sharing Session
      FastBull Summit BrokersView Expo
      Recent Searches
        Top Searches
          Markets
          News
          Analysis
          User
          24/7
          Economic Calendar
          Education
          Data
          • Names
          • Latest
          • Prev

          View All

          No data

          Scan to Download

          Faster Charts, Chat Faster!

          Download App
          English
          • English
          • Español
          • العربية
          • Bahasa Indonesia
          • Bahasa Melayu
          • Tiếng Việt
          • ภาษาไทย
          • Français
          • Italiano
          • Türkçe
          • Русский язык
          • 简中
          • 繁中
          Open Account
          Search
          Products
          Charts Free Forever
          Markets
          News
          Signals

          Copy Rankings Latest Signals Become a signal provider AI Rating
          Contests
          Brokers

          Overview Brokers Assessment Rankings Regulators News Claims
          Broker listing Forex Brokers Comparison Tool Live Spread Comparison Scam
          Q&A Complaint Scam Alert Videos Tips to Detect Scam
          More

          Business
          Events
          Careers About Us Advertising Help Center

          White Label

          Data API

          Web Plug-ins

          Affiliate Program

          Awards Institution Evaluation IB Seminar Salon Event Exhibition
          Vietnam Thailand Singapore Dubai
          Fans Party Investment Sharing Session
          FastBull Summit BrokersView Expo

          Bitcoin To $500,000: Standard Chartered Doubles Down On 2028 Target

          NewsBTC
          1inch / Tether
          -0.55%
          AAVE / Tether
          +4.60%
          Acala / Tether
          -1.10%
          Fusionist / Tether
          -4.29%
          Alchemy Pay / Tether
          +0.79%

          Standard Chartered’s global head of digital assets research, Geoffrey Kendrick, has reaffirmed his standout price forecast for Bitcoin. Kendrick, who envisions BTC hitting $500,000 by 2028, bases his conviction on evidence of increasing institutional involvement — specifically pointing to sovereign wealth funds, state pension funds, and other large-scale investors.

          Sovereign Wealth Funds Enter The Bitcoin Fray

          According to a new report from Standard Chartered cited by The Block, Kendrick sees growing signs that government-backed investment vehicles are ramping up their interest in Bitcoin. This view is reinforced by Abu Dhabi’s recent disclosure of a 4,700 BTC-equivalent position in BlackRock’s iShares Bitcoin Trust (IBIT) via its sovereign wealth fund.

          “While this is small for now, we would expect the size to increase over time and, indeed, for other sovereigns to also start buying,” Kendrick wrote in the Tuesday report. He explained that Abu Dhabi’s move marks a strategic shift and could presage broader participation from other wealth funds looking to diversify their portfolios with BTC.

          Kendrick’s confidence is partly rooted in Form 13F filings — quarterly reports that institutional managers overseeing at least $100 million in assets are required to file with the US Securities and Exchange Commission. Reviewing data from the fourth quarter of 2024, Kendrick noted a compelling trend.

          “The 13F filings for Q4 show that process is underway…It is happening,” he said in an email to The Block. In Standard Chartered’s analysis, Q4 data revealed that while hedge funds maintained their lead in Bitcoin purchases, banks — which began buying in Q3 of last year — also ramped up their positions.

          Kendrick drew parallels between an earlier stage in Bitcoin’s market evolution, dominated by retail investors, and the more recent era, which saw hedge funds jump aboard through exchange-traded funds (ETFs). Now, the spotlight appears to be broadening further to include state investment managers and central banks.

          “This gives us comfort to say that even if buying by Strategy… [formerly MicroStrategy] slows down dramatically (it has bought a staggering 227k BTC since the US election, more than 1% of the ever-to-exist supply), we think other buyers are waiting to step in,” Kendrick noted.

          The mention of MicroStrategy underscores just how significant one private company’s bitcoin holdings can be. Yet Standard Chartered’s analysis suggests that other large, patient pools of capital might absorb future supply, thus supporting higher prices over the long term.

          Among the institutions, Kendrick highlights the State of Wisconsin Investment Board and the State of Michigan Department of the Treasury. However, he also points to central banks as potential new participants.

          In the report, Kendrick references the Czech National Bank, which has considered allocating up to 5% of its €140 billion in reserves into bitcoin, and notes that the Swiss National Bank is in the early stages of contemplating a similar move. These developments could further bolster bitcoin’s legitimacy as a store of value on par with more traditional asset classes.

          “As institutional access to bitcoin improves and volatility declines, we expect more portfolios to migrate towards their optimal level from an underweight Bitcoin starting point,” Kendrick concluded.

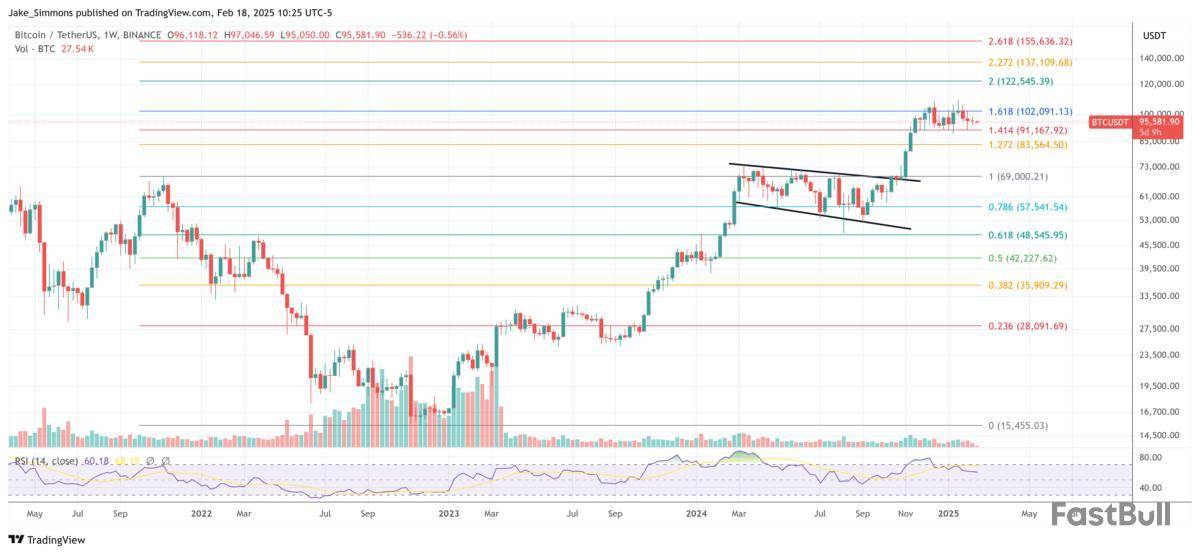
          At press time, BTC traded at $95,581.

          Bitcoin price
          Risk Warnings and Disclaimers
          You understand and acknowledge that there is a high degree of risk involved in trading. Following any strategies or investment methods may lead to potential losses. The content on the site is provided by our contributors and analysts for information purposes only. You are solely responsible for determining whether any trading assets, securities, strategy, or any other product is suitable for investing based on your own investment objectives and financial situation.
          Add to Favorites
          Share

          Robinhood and Coinbase’s Q4 shows retail’s significant interest in alternative cryptos

          The Block
          1inch / Tether
          -0.55%
          AAVE / Tether
          +4.60%
          Acala / Tether
          -1.10%
          Fusionist / Tether
          -4.29%
          Alchemy Pay / Tether
          +0.79%

          Robinhood's crypto revenue surprised many with a super impressive fourth quarter in 2024, reaching $360 million, nearly a 490% increase from the third quarter's $61 million. This marks the platform's highest crypto revenue quarter, substantially exceeding its previous peak of $126 million in the first quarter of 2024. 

          Crypto revenue now represents nearly 40% of Robinhood's total quarterly revenue, compared to about 20% in Q3 2024.

          The revenue growth coincides with expanded cryptocurrency offerings on the platform. Robinhood's crypto portfolio has grown to include popular memecoins like BONK, WIF and TRUMP, alongside traditional cryptocurrencies. The platform generates revenue primarily through trading spreads rather than commission fees, similar to other retail-focused exchanges.

          While Robinhood did not include specific breakdowns of what tokens were traded, Coinbase reported earnings shortly after and did include some insights. Coinbase's fourth-quarter report indicates Bitcoin comprised 27% of trading volume, followed by Ethereum at 10%, USDT at 15%, with other crypto assets accounting for 48%.

          This distribution suggests retail traders are showing significant interest in alternative cryptocurrencies beyond major assets. While Robinhood delivered an impressive quarter for crypto volumes, Coinbase retains the top position with $440 billion in volume traded compared to Robinhoods $71 billion. However, the competition between the two platforms appears to be much closer than many had anticipated. These stats help understand retail mindshare and where their attention is focused. 

          Platforms like Robinhood have been a staple in measuring retail participation within crypto markets. While memecoin listings appear to drive short-term user engagement and speculation, their typically volatile nature typically impacts long-term trading volumes. The next quarter's performance will be crucial in determining whether this uptick represents a temporary surge driven by a speculative interest or a longer-term shift in retail investor preferences.

          This is an excerpt from The Block's Data & Insights newsletter. Dig into the numbers making up the industry's most thought-provoking trends.

          Disclaimer: The Block is an independent media outlet that delivers news, research, and data. As of November 2023, Foresight Ventures is a majority investor of The Block. Foresight Ventures invests in other companies in the crypto space. Crypto exchange Bitget is an anchor LP for Foresight Ventures. The Block continues to operate independently to deliver objective, impactful, and timely information about the crypto industry. Here are our current financial disclosures.

          © 2024 The Block. All Rights Reserved. This article is provided for informational purposes only. It is not offered or intended to be used as legal, tax, investment, financial, or other advice.

          Risk Warnings and Disclaimers
          You understand and acknowledge that there is a high degree of risk involved in trading. Following any strategies or investment methods may lead to potential losses. The content on the site is provided by our contributors and analysts for information purposes only. You are solely responsible for determining whether any trading assets, securities, strategy, or any other product is suitable for investing based on your own investment objectives and financial situation.
          Add to Favorites
          Share

          Solana (SOL): Worst Drop in 3 Years, US Dollar to Decimate Bitcoin (BTC)? Shiba Inu (SHIB) Surprise Recovery Possible

          U.Today
          1inch / Tether
          -0.55%
          AAVE / Tether
          +4.60%
          Acala / Tether
          -1.10%
          Fusionist / Tether
          -4.29%
          Alchemy Pay / Tether
          +0.79%

          Solana has just seen its biggest price drop in three years, falling 45% from its most recent high. Due to intense selling pressure, the asset — which was among the best performers during the previous bull cycle — is currently causing investors to worry about its short-term future. A strong bearish trend is indicated by SOL's decline below the pivotal 200-day moving average, which is clearly broken by key support levels on the most recent price chart. 

          This action implies that buying interest has been greatly outweighed by selling pressure, which has probably been made worse by general market worries and the recent drop in investor risk appetite. The price is now testing levels around $170 after falling below $190, a crucial support zone in the past. According to the Relative Strength Index (RSI), the asset has moved into oversold territory, which may portend a relief bounce.  Chart by TradingView">

          With the 200-day moving average breached and important psychological levels like $200 not held, there is now more selling pressure. The $160-$170 support range is an important area to keep an eye on. It is possible to anticipate additional drops to $150 or less if Solana is unable to maintain this zone. Alternatively, bullish momentum would need to reclaim the 200-day moving average and recover above $190.

          Bitcoin under pressure

          A pivotal moment is ahead for Bitcoin as the U.S. Dollar Index is showing indications of strength, which could jeopardize the upside potential of Bitcoin. Historically, there has been an inverse relationship between Bitcoin and the dollar index when the dollar appreciates Bitcoin and other risky assets typically decline. Since DXY is still trading above 106, it is unclear where Bitcoin will go in the future. 

          Bitcoin is currently struggling to break out of its consolidation range, trading at about $95,700. With resistance close to $100,000 and support forming at $93,500, the asset has been moving sideways. If Bitcoin is unable to maintain this level of support, a drop toward $90,000 may be imminent. 

          In relation to a basket of foreign currencies, the dollar has recently recovered from its moving averages. This points to a potential shift in liquidity away from Bitcoin and other digital assets due to the dollar's renewed strength. Bitcoin may find it difficult to maintain any bullish recovery if the DXY keeps up its upward trajectory. Bitcoin may move toward the 200-day moving average, which is close to $85,000, if it breaks below $93,500, which could lead to a more severe correction.

          Bullish case: A break above $100,000 could rekindle bullish sentiment if Bitcoin is able to maintain its current range and the dollar declines. However, traders continue to exercise caution due to the persistence of macroeconomic uncertainty. The next course of action for Bitcoin will mostly depend on how the U.S. dollar does over the next few weeks. 

          If the dollar's strength continues, there may be more pressure on Bitcoin sellers. But if macroeconomic conditions change to favor riskier assets, Bitcoin may gain the momentum it needs to overcome significant resistance levels. 

          Shiba Inu finds hope

          Speculation regarding a possible recovery has been sparked by Shiba Inu's current hovering around its recent lows. SHIB may still be able to reverse its downward trend even though the market is not showing much upward momentum if it forms a double-bottom pattern around $0.00001485. 

          Despite consistent selling pressure, the asset has been unable to overcome significant resistance levels such as the 26 EMA. In the event that SHIB is able to maintain its current support zone and draw in fresh buying interest, a technical rebound could occur. Even though double-bottom formations have historically been a powerful reversal signal, the current market's uncertainty and low trading volume make such a move unlikely in the near future.

          In order to confirm a recovery attempt and possibly move it toward the next resistance level at $0.000020, SHIB must regain strength above $0.00001713 in order for a bullish scenario to materialize. Even though the current state of the market indicates that there is little chance of a quick breakout, a rally to $0.000022 could occur if buying pressure increases.

          On the downside, more drops might occur if the $0.00001485 support is not maintained. The double-bottom setup would be void if there were a break below this level, which might push SHIB down to $0.00001300 or even lower.

          Risk Warnings and Disclaimers
          You understand and acknowledge that there is a high degree of risk involved in trading. Following any strategies or investment methods may lead to potential losses. The content on the site is provided by our contributors and analysts for information purposes only. You are solely responsible for determining whether any trading assets, securities, strategy, or any other product is suitable for investing based on your own investment objectives and financial situation.
          Add to Favorites
          Share

          World Liberty Financial WLFI Token Sales Surge: Less Than 1 Billion Tokens Remain

          NewsBTC
          1inch / Tether
          -0.55%
          AAVE / Tether
          +4.60%
          Acala / Tether
          -1.10%
          Fusionist / Tether
          -4.29%
          Alchemy Pay / Tether
          +0.79%

          World Liberty Financial (WLFI), a forthcoming cryptocurrency platform endorsed by President Donald Trump and his sons, has reported a significant uptick in the sale of its governance tokens. 

          After a slow initial rollout approximately four months ago, Bloomberg reports that the platform has sold over 24 billion of its WLFI tokens, representing more than 96% of its total supply. As it stands, fewer than 1 billion tokens remain available for sale.

          World Liberty Financial Token Sale Sparks Debate

          The World Liberty Financial token, priced at 5 cents each, is part of a broader initiative aimed at raising $300 million at a $1.5 billion valuation. 

          The project launched its token sale in mid-October, with the intention of enabling token holders to propose changes to the platform and vote on others’ proposals. 

          However, the limited rights associated with the WLFI tokens have raised concerns. Holders possess minimal voting rights and no economic entitlements, and the tokens cannot be traded or sold back to World Liberty, prompting questions about their long-term value and utility.

          Adding to the intrigue surrounding World Liberty Financial, crypto entrepreneur Justin Sun, founder of the TRON blockchain, recently disclosed a substantial investment of $45 million into the venture. 

          This increased Justin Sun’s total stake in World Liberty Financial to $75 million, indicating strong confidence in the platform’s potential.

          TRUMP And MELANIA Tokens Experience Wild Price Fluctuations

          Analysts are speculating that forthcoming executive orders from Trump could positively influence the cryptocurrency landscape in the US, yet skepticism remains among industry veterans. 

          Nic Carter, a venture capitalist, expressed concerns regarding the ethical implications of a sitting president engaging in business ventures that may present conflicts of interest.

          The launch of Trump’s memecoins has also stirred significant controversy. As previously reported by NewsBTC, the Donald Trump memecoin (TRUMP) saw a sharp decline, dropping from a weekend high of $75 to $17. 

          Similarly, the Melania Trump memecoin (MELANIA) disrupted the market with increased excitement among crypto investors, with its value fluctuating dramatically from a high of $13.64 to its current trading price of $1.26.

          Bernstein analysts have characterized this period as a “chaotic crypto era,” suggesting that government involvement with cryptocurrencies could redefine the relationship between leadership and emerging technologies. 

          They argue that the launches of Trump and Melania’s memecoins could signal a potential regulatory shift, positioning digital assets as a direct link to a wider audience.

          While trading at $17, TRUMP is posting significant losses of 6%, 2% and 70% in the 24 hour, fourteen day and monthly time frames respectively, coupled with a 27% drop in trading volume, according to CoinGecko data.

          Featured image from DALL-E, chart from TradingView.com 

          Risk Warnings and Disclaimers
          You understand and acknowledge that there is a high degree of risk involved in trading. Following any strategies or investment methods may lead to potential losses. The content on the site is provided by our contributors and analysts for information purposes only. You are solely responsible for determining whether any trading assets, securities, strategy, or any other product is suitable for investing based on your own investment objectives and financial situation.
          Add to Favorites
          Share

          Bitcoin, Ethereum, And Solana: Real Vision’s Raoul Pal Calls The Greatest Macro Trade Of All Time

          NewsBTC
          1inch / Tether
          -0.55%
          AAVE / Tether
          +4.60%
          Acala / Tether
          -1.10%
          Fusionist / Tether
          -4.29%
          Alchemy Pay / Tether
          +0.79%

          Co-founder and Chief Executive Officer (CEO) of Real Vision, Raoul Pal has doubled down on his bullish outlook for Bitcoin (BTC), Ethereum (ETH), and Solana (SOL), calling these cryptocurrencies “the greatest macro trade of all time.” Despite recent fluctuations and short-term volatility, Pal argues that the market is positioned for an explosive breakout, which investors should prepare for.

          Macro Set-Up For Bitcoin And Ethereum Surge

          While Bitcoin, Ethereum, and Solana face a downtrend due to rising volatility, Pal remains steadfast in his optimistic projection, believing that the market is in the greatest macro target of all time. The Real Vision CEO shared a series of thread posts on X (formerly Twitter), highlighting technical indicators and macro factors that would positively influence Bitcoin and Ethereum’s price trajectory.

          Sharing a logarithmic weekly chart of Bitcoin, Pal indicated that Bitcoin had experienced a long-term price uptrend line since 2020, showing a distinct pattern of higher lows. Currently, Bitcoin is moving within a tight trading range, which Pal believes could be bullish, as a strong break above the resistance line could trigger a major run.

          Similarly, the Real Vision Co-founder presented a price chart of Ethereum, highlighting that ETH is currently consolidated within a symmetrical triangle, signaling the potential for a price breakout. Typically, a symmetrical triangle pattern is seen as a bullish signal for ETH, but considering its recent underperformance compared to cryptocurrencies like Bitcoin and Solana, a strong bullish breakout remains skeptical.

          Looking at the symmetrical triangle, a breakout from the upper trendline could see the Ethereum price skyrocketing to $4,000 or even higher based on Pal’s chart. Additionally, the Solana price, which has been seeing varying momentum lately, has tested a key horizontal resistance multiple times, forming a strong accumulation base. Historically such consolidation phases tend to precede explosive rallies, provided that broader market trends remain favorable. 

          In his post, Pal encourages traders to “zoom out” , likely suggesting a shift from short-term fluctuations to long term cycles. He warned against excessive leverage and risk-taking to avoid liquidation in volatile conditions. He also urges traders to remain patient, watching how the market unfolds and preparing ahead of a potential bullish surge. 

          Market Volatility Raises Fear

          In his analysis, Pal suggested that the broader crypto market is currently plagued by fear and panic, as volatility rises and crypto prices experience a downtrend. He explains that a significant portion of crypto investors or traders are currently bearish. 

          This could be due to the fact that following Bitcoin’s price crash to below $100,000 after the announcement of Donald Trump’s tariff plans, many altcoins also declined severely, with Ethereum, Dogecoin, and Solana being among the top losers. 

          Due to this market change, many in the market had sold off their tokens to avoid further losses. Despite this bearish trend, Pal maintains an optimistic outlook, expecting a strong surge for Bitcoin, Ethereum, and Solana.

          Risk Warnings and Disclaimers
          You understand and acknowledge that there is a high degree of risk involved in trading. Following any strategies or investment methods may lead to potential losses. The content on the site is provided by our contributors and analysts for information purposes only. You are solely responsible for determining whether any trading assets, securities, strategy, or any other product is suitable for investing based on your own investment objectives and financial situation.
          Add to Favorites
          Share

          Wellfield Provides Corporate Update

          Newsfile Corp.
          1inch / Tether
          -0.55%
          AAVE / Tether
          +4.60%
          Acala / Tether
          -1.10%
          Fusionist / Tether
          -4.29%
          Alchemy Pay / Tether
          +0.79%

          Toronto, Ontario--(Newsfile Corp. - February 18, 2025) - Wellfield Technologies Inc. (OTC Pink: WFLDF) (FSE: K8D) (the "Company" or "Wellfield") announced today the departure of Kristina Bates, effective February 14, 2025. Wellfield's board of directors thanks Kristina for her valuable contributions to the Company and wishes Kristina success in her future endeavors, and have accepted her resignation.

          The Company has initiated a search for a replacement director and expects to provide additional information once available.

          About Wellfield Technologies

          Wellfield Technologies, Inc. is a leading fintech company specializing in innovative solutions leveraging blockchain technology. Our platform Coinmama, provides seamless access to the cryptocurrency market for over 3.5 million registered users across 180 countries. We offer disruptive on-chain and web3 secure and friendly self-custody solutions through Coinmama. Additionally, Wellfield operates Tradewind Markets platform to digitize and trade real-world assets, including our flagship VaultChain™ Gold and VaultChain™ Silver products.

          Join Wellfield's digital community on LinkedIn and Twitter, and for more details, visit wellfield.io.

          For further information contact:

          Wellfield Technologies Inc.

          Levy Cohen, CEO

          levyc@wellfield.io

          (832) 483-2575

          Ryan Graybill, Investor Relations

          ryan.graybill@wellfield.io

          Cautionary Statements

          Neither the TSX Venture Exchange nor its Regulation Services Provider (as that term is defined in the policies of the TSX Venture Exchange) has approved nor disapproved the contents of this news release, nor do they accept responsibility for the adequacy or accuracy of this release.

          To view the source version of this press release, please visit https://www.newsfilecorp.com/release/241403

          Risk Warnings and Disclaimers
          You understand and acknowledge that there is a high degree of risk involved in trading. Following any strategies or investment methods may lead to potential losses. The content on the site is provided by our contributors and analysts for information purposes only. You are solely responsible for determining whether any trading assets, securities, strategy, or any other product is suitable for investing based on your own investment objectives and financial situation.
          Add to Favorites
          Share

          Ethereum Lost 4.50% to $2650.23 — Data Talk

          Dow Jones Newswires
          1inch / Tether
          -0.55%
          AAVE / Tether
          +4.60%
          Acala / Tether
          -1.10%
          Fusionist / Tether
          -4.29%
          Alchemy Pay / Tether
          +0.79%

          Ethereum is down $124.96 today or 4.50% to $2650.23

          • Largest percentage decrease since Feb. 4, 2025, when it dropped 6.25%
          • Down three of the past four days
          • Down 20.07% month-to-date
          • Down 20.76% year-to-date
          • Down 44.79% from its all-time high of $4800.00 on Nov. 9, 2021 (based on 5 p.m. levels)
          • Down 11.38% from 52 weeks ago (Feb. 20, 2024), when it traded at $2990.41
          • Down 34.57% from its 52-week high of $4050.30 on Dec. 16, 2024 (based on 5 p.m. levels)
          • Up 22.15% from its 52-week low of $2169.66 on Sept. 6, 2024 (based on 5 p.m. levels)
          • Traded as low as $2607.26
          • Down 6.05% at today's intraday low; Largest intraday % decrease since Feb. 4, 2025, when it was down as much as 6.34%

          Note: The Ethereum price is a 5 p.m. ET snapshot from Kraken

          Data compiled by Dow Jones Market Data

          Risk Warnings and Disclaimers
          You understand and acknowledge that there is a high degree of risk involved in trading. Following any strategies or investment methods may lead to potential losses. The content on the site is provided by our contributors and analysts for information purposes only. You are solely responsible for determining whether any trading assets, securities, strategy, or any other product is suitable for investing based on your own investment objectives and financial situation.
          Add to Favorites
          Share
          FastBull
          Copyright © 2025 FastBull Ltd

          728 RM B 7/F GEE LOK IND BLDG NO 34 HUNG TO RD KWUN TONG KLN HONG KONG

          TelegramInstagramTwitterfacebooklinkedin
          App Store Google Play Google Play
          Products
          Charts

          Chats

          Q&A with Experts
          Screeners
          Economic Calendar
          Data
          Tools
          Membership
          Features
          Function
          Markets
          Copy Trading
          Latest Signals
          Contests
          News
          Analysis
          24/7
          Columns
          Education
          Company
          Careers
          About Us
          Contact Us
          Advertising
          Help Center
          Feedback
          User Agreement
          Privacy Policy
          Business

          White Label

          Data API

          Web Plug-ins

          Poster Maker

          Affiliate Program

          Risk Disclosure

          The risk of loss in trading financial instruments such as stocks, FX, commodities, futures, bonds, ETFs and crypto can be substantial. You may sustain a total loss of the funds that you deposit with your broker. Therefore, you should carefully consider whether such trading is suitable for you in light of your circumstances and financial resources.

          No decision to invest should be made without thoroughly conducting due diligence by yourself or consulting with your financial advisors. Our web content might not suit you since we don't know your financial conditions and investment needs. Our financial information might have latency or contain inaccuracy, so you should be fully responsible for any of your trading and investment decisions. The company will not be responsible for your capital loss.

          Without getting permission from the website, you are not allowed to copy the website's graphics, texts, or trademarks. Intellectual property rights in the content or data incorporated into this website belong to its providers and exchange merchants.

          Not Logged In

          Log in to access more features

          FastBull Membership

          Not yet

          Purchase

          Become a signal provider
          Help Center
          Customer Service
          Dark Mode
          Price Up/Down Colors

          Log In

          Sign Up

          Position
          Layout
          Fullscreen
          Default to Chart
          The chart page opens by default when you visit fastbull.com