

Markets
News
Analysis
User
24/7
Economic Calendar
Education
Data
- Names
- Latest
- Prev


Signal Accounts for Members
All Signal Accounts
All Contests
 France Trade Balance (SA) (Oct)
A:--
F: --
 Euro Zone Employment YoY (SA) (Q3)
A:--
F: --
 Canada Part-Time Employment (SA) (Nov)
A:--
F: --
P: --
Canada Unemployment Rate (SA) (Nov)A:--
F: --
P: --
Canada Full-time Employment (SA) (Nov)A:--
F: --
P: --
Canada Labor Force Participation Rate (SA) (Nov)A:--
F: --
P: --
Canada Employment (SA) (Nov)A:--
F: --
P: --
 U.S. PCE Price Index MoM (Sept)
A:--
F: --
P: --
U.S. Personal Income MoM (Sept)A:--
F: --
P: --
U.S. Core PCE Price Index MoM (Sept)A:--
F: --
P: --
U.S. PCE Price Index YoY (SA) (Sept)A:--
F: --
P: --
U.S. Core PCE Price Index YoY (Sept)A:--
F: --
P: --
U.S. Personal Outlays MoM (SA) (Sept)A:--
F: --
U.S. 5-10 Year-Ahead Inflation Expectations (Dec)A:--
F: --
P: --
U.S. Real Personal Consumption Expenditures MoM (Sept)A:--
F: --
U.S. Weekly Total Rig CountA:--
F: --
P: --
U.S. Weekly Total Oil Rig CountA:--
F: --
P: --
U.S. Consumer Credit (SA) (Oct)A:--
F: --
 China, Mainland Foreign Exchange Reserves (Nov)
A:--
F: --
P: --
 Japan Trade Balance (Oct)
A:--
F: --
P: --
Japan Nominal GDP Revised QoQ (Q3)A:--
F: --
P: --
China, Mainland Imports YoY (CNH) (Nov)A:--
F: --
P: --
China, Mainland Exports (Nov)A:--
F: --
P: --
China, Mainland Imports (CNH) (Nov)A:--
F: --
P: --
China, Mainland Trade Balance (CNH) (Nov)A:--
F: --
P: --
China, Mainland Exports YoY (USD) (Nov)A:--
F: --
P: --
China, Mainland Imports YoY (USD) (Nov)A:--
F: --
P: --
 Germany Industrial Output MoM (SA) (Oct)
A:--
F: --
Euro Zone Sentix Investor Confidence Index (Dec)A:--
F: --
P: --
Canada National Economic Confidence IndexA:--
F: --
P: --
 U.K. BRC Like-For-Like Retail Sales YoY (Nov)
--
F: --
P: --
U.K. BRC Overall Retail Sales YoY (Nov)--
F: --
P: --
 Australia Overnight (Borrowing) Key Rate
--
F: --
P: --
RBA Rate Statement RBA Press Conference Germany Exports MoM (SA) (Oct)--
F: --
P: --
U.S. NFIB Small Business Optimism Index (SA) (Nov)--
F: --
P: --
 Mexico 12-Month Inflation (CPI) (Nov)
--
F: --
P: --
Mexico Core CPI YoY (Nov)--
F: --
P: --
Mexico PPI YoY (Nov)--
F: --
P: --
U.S. Weekly Redbook Index YoY--
F: --
P: --
U.S. JOLTS Job Openings (SA) (Oct)--
F: --
P: --
China, Mainland M1 Money Supply YoY (Nov)--
F: --
P: --
China, Mainland M0 Money Supply YoY (Nov)--
F: --
P: --
China, Mainland M2 Money Supply YoY (Nov)--
F: --
P: --
U.S. EIA Short-Term Crude Production Forecast For The Year (Dec)--
F: --
P: --
U.S. EIA Natural Gas Production Forecast For The Next Year (Dec)--
F: --
P: --
U.S. EIA Short-Term Crude Production Forecast For The Next Year (Dec)--
F: --
P: --
EIA Monthly Short-Term Energy Outlook U.S. API Weekly Gasoline Stocks--
F: --
P: --
U.S. API Weekly Cushing Crude Oil Stocks--
F: --
P: --
U.S. API Weekly Crude Oil Stocks--
F: --
P: --
U.S. API Weekly Refined Oil Stocks--
F: --
P: --
 South Korea Unemployment Rate (SA) (Nov)
--
F: --
P: --
Japan Reuters Tankan Non-Manufacturers Index (Dec)--
F: --
P: --
Japan Reuters Tankan Manufacturers Index (Dec)--
F: --
P: --
Japan Domestic Enterprise Commodity Price Index MoM (Nov)--
F: --
P: --
Japan Domestic Enterprise Commodity Price Index YoY (Nov)--
F: --
P: --
China, Mainland PPI YoY (Nov)--
F: --
P: --
China, Mainland CPI MoM (Nov)--
F: --
P: --
 Italy Industrial Output YoY (SA) (Oct)
--
F: --
P: --

No matching data
Latest Views
Latest Views
Trending Topics
Top Columnists
Latest Update
White Label
Data API
Web Plug-ins
Affiliate Program
View All
No data


ADA struggles to stay above $0.64.
Key Support levels: $0.64, $0.45
Key Resistance levels: $0.90, $1.31. Buyers Under Pressure
After another weekly candle closed in red, ADA is struggling to hold onto its support at $0.64. If this week does not close in green, then it is likely that sellers will break this support and take the asset to $0.55, where the next key support is found.2. Low Momentum
Interest in Cardano appears to be at a low point following a disappointing May and a poor start to June. Without any buyers at current levels, the only option left for ADA is to trend lower until interest returns. For this reason, a drop to $0.55 appears likely.3. Falling Volume
The daily volume continues to make lower lows. As long as this trend continues, it is unlikely for this cryptocurrency to reverse course. This can also be interpreted as a promising sign because sellers are showing a lack of conviction here. This may open the way for buyers to return later.
Total crypto market capitalization shed around $80 billion over a few hours late on Monday night as Middle East tensions escalated.
It fell marginally to around $3.44 trillion as Bitcoin dipped by over $2,000 in a decline to around $106,500 before it immediately started to recover and reclaim $107,000 at the time of writing.
The dip was caused by US President Donald Trump calling for the evacuation of Tehran as the exchange of missiles between Israel and Irancontinuedfor a fourth day.Trump Leaves G7
Donald Trump departed the annual G7 meeting in Canada early, telling reporters, “I have to be back early for obvious reasons.”
The POTUS also took to his Social Media platform to say that Iran should have signed his “deal” before adding that the country cannot have a nuclear weapon and “everyone should immediately evacuate Tehran.”
TRUMP: “Everyone should immediately evacuate Tehran.” pic.twitter.com/vGygTxuFsg
— The Kobeissi Letter (@KobeissiLetter) June 16, 2025
Meanwhile, other nations, including China and Russia, urged their citizens to evacuate Tel Aviv as the military action intensified. The message appeared orchestrated to increase pressure on Iran to come to the negotiating table amid a veiled threat of military intervention.
“American forces are maintaining their defensive posture, and that has not changed. We will defend American interests,” White House spokesman Alex Pfeiffer wrote on X while disputing fake news that air strikes were imminent.
Odds on the United States taking military action against Iran before the end of this month surged to 67% on blockchain prediction platform Polymarket.
BREAKING: The U.S. is projected to take imminent military action against Iran.
67% chance. pic.twitter.com/Cqcy3OnBki
— Polymarket (@Polymarket) June 16, 2025
Markets Disagree With WWIII
A crypto market reaction of this minor magnitude is just another day on the field, which begs the question: Are digital assets becoming immune to geopolitical turmoil? In fact, crypto markets tanked twice as hard when the Trump and Elon Muskbromance collapsedon June 6.
Meanwhile, other risk-on assets such as tech stocks are also weathering the storm at the moment.
“If there were even a 50% chance of WW3 right now, the S&P 500 wouldn’t be 2% away from a new all-time high,” observed the Kobeissi Letter.
At the time of writing, Bitcoin was still trading in the middle of its range-bound channel, where it has been since the beginning of May, and Ethereum had bounced off support at $2,500, so crypto markets are holding up pretty well, all things considered.
On-chain data shows the exchange inflows related to the stablecoins USDT and USDC have seen a sharp plunge. Here’s what this could mean for Bitcoin and other cryptocurrencies.
Stablecoin Exchange Inflows Have Dropped Below Yearly Average
In a new post on X, CryptoQuant author Axel Adler Jr has discussed about the latest trend in the Exchange Inflow of the top two stablecoins in the sector, USDT and USDC.
The “Exchange Inflow” refers to an on-chain indicator that keeps track of the total amount of a given asset that’s moving into the wallets associated with centralized exchanges.
Generally, investors may deposit their coins into these platforms when they want to trade them away, so a high value on the Exchange Inflow can indicate demand for swapping the cryptocurrency. For volatile assets like Bitcoin, this is something that can naturally be bearish for the price.
In the case of stablecoins, however, their price doesn’t see any impact from exchange deposits, since it always remains, by definition, stable around whatever fiat currency the asset is tracking.
That said, stablecoin inflows aren’t without consequence. Investors usually deposit these assets to swap into a volatile cryptocurrency of their choice. As such, coins like Bitcoin can see a bullish effect from an Exchange Inflow spike related to these fiat-tied tokens.
Now, here is a chart that shows the trend in the combined Exchange Inflow of the top two stablecoins, USDT and USDC, over the past few years:
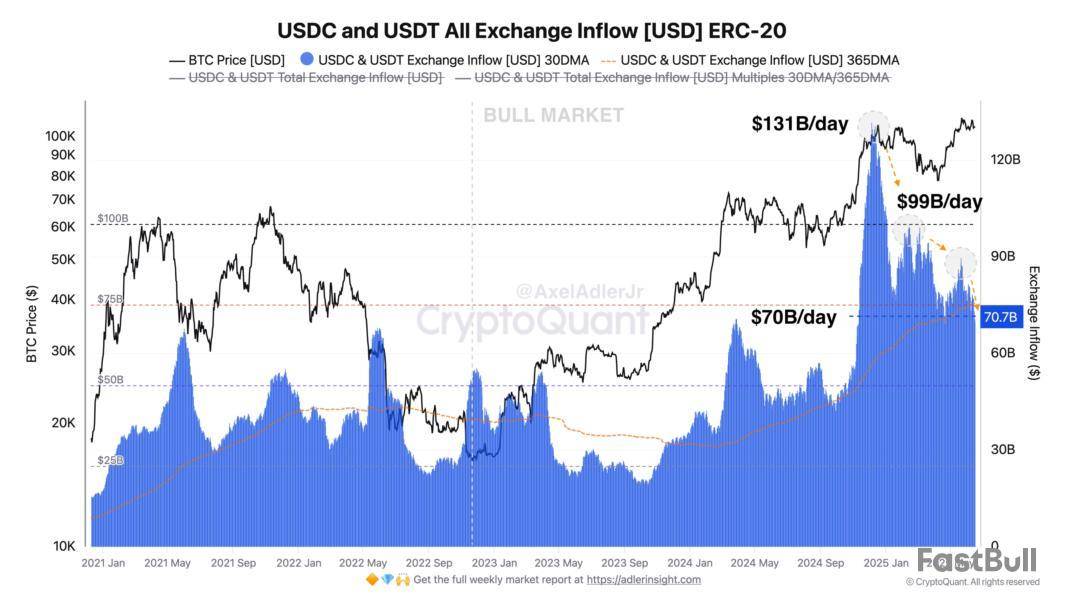
As displayed in the above graph, the Exchange Inflow of USDT and USDC shot up to a very high value at the end of last year, a sign that the investors were making massive deposits of these stablecoins.
Alongside the spike in the indicator, the Bitcoin price observed a rally to a new all-time high (ATH), a potential sign that the stablecoin inflows may have helped provide the fuel for the run.
At the peak of the spike, the metric reached a value of $131 billion per day. From the chart, it’s apparent that since then, the indicator has been following a downward trajectory and today, its value has come down to $70 billion per day.
This represents a significant decline of $61 billion since the high. Though, while the indicator is indeed notably down compared to the peak, its current level is still high in the context of the wider cycle so far.
Naturally, if this drawdown in the stablecoin Exchange Inflow keeps up, it could potentially turn out to be a bearish sign for Bitcoin and other digital assets. That said, even though BTC went down earlier in the year, its price is still above the $100,000 mark right now, a possible sign that investors may simply be entering a phase of consolidation.
Bitcoin Price
Following a surge of about 2.5% over the last 24 hours, Bitcoin has managed to recover back to the $108,100 level.
The case between Ripple Labs and the US Securities and Exchange Commission received a long-awaited updated on June 16th, as the institution submitted a status report, which more or less asks for an extension of a previous deadline.Ripple vs. SEC Lawsuit Update
As CryptoPotatoreportedearlier this month, both parties managed to reach an agreement regarding the fine that Ripple has to pay through a joint motion, which was tossed by presiding judge Analisa Torres on the grounds of it failing to meet certain regulatory criteria.
June 16th was the date until which the Commission had to file a status report and many in the community believed that this would effectively mark the end of the lawsuit, but their hopes were for not.
The SEC did file a motion but it asked the court to continue “to hold the appeals in abeyance, with the Commission to file a status report by August 15th, 2025.” In essence, they asked for a 2-month delay. The court is yet to rule on this request, of course, which, also summarized the events leading to it, argued that both parties are in agreement that the deadline be extended:
In light of the foregoing, the parties are in agreement that this court should continue to hold the appeals in abeyance, with the Commission to file a status report by August 15, 2025.XRP Price Outperforms on the Daily
Trading at around $2.24, XRP is 2.4% up for the day, which may not seem like a lot, but it’s the best-performing altcoin from the top 15.
It reached an intraday high of almost $2.34 as seen in the chart below, but has since retraced.
The broader cryptocurrency market remains uncertain amid the ongoing war between Israel and Iran as participants remain in expectation of the stance of global military powers like the US, China, Russia, and more.
728 RM B 7/F GEE LOK IND BLDG NO 34 HUNG TO RD KWUN TONG KLN HONG KONG


White Label
Data API
Web Plug-ins
Poster Maker
Affiliate Program
The risk of loss in trading financial instruments such as stocks, FX, commodities, futures, bonds, ETFs and crypto can be substantial. You may sustain a total loss of the funds that you deposit with your broker. Therefore, you should carefully consider whether such trading is suitable for you in light of your circumstances and financial resources.
No decision to invest should be made without thoroughly conducting due diligence by yourself or consulting with your financial advisors. Our web content might not suit you since we don't know your financial conditions and investment needs. Our financial information might have latency or contain inaccuracy, so you should be fully responsible for any of your trading and investment decisions. The company will not be responsible for your capital loss.
Without getting permission from the website, you are not allowed to copy the website's graphics, texts, or trademarks. Intellectual property rights in the content or data incorporated into this website belong to its providers and exchange merchants.
Not Logged In
Log in to access more features

FastBull Membership
Not yet
Purchase


Log In
Sign Up


