• Trade
  • Markets
  • Copy
  • Contests
  • 24/7
  • Calendar
  • Q&A
  • Chats
Screeners
SYMBOL
LAST
BID
ASK
HIGH
LOW
NET CHG.
%CHG.
SPREAD
SPX
S&P 500 Index
6946.12
6946.12
6946.12
6952.50
6915.14
+56.06
+ 0.81%
--
DJI
Dow Jones Industrial Average
49482.14
49482.14
49482.14
49517.36
49206.87
+307.65
+ 0.63%
--
IXIC
NASDAQ Composite Index
23152.07
23152.07
23152.07
23169.68
23004.69
+288.40
+ 1.26%
--
USDX
US Dollar Index
97.630
97.630
97.710
97.670
97.390
+0.070
+ 0.07%
--
EURUSD
Euro / US Dollar
1.18006
1.18006
1.18013
1.18286
1.17930
-0.00091
-0.08%
--
GBPUSD
Pound Sterling / US Dollar
1.35376
1.35376
1.35385
1.35749
1.35188
-0.00209
-0.15%
--
XAUUSD
Gold / US Dollar
5171.16
5171.16
5171.50
5205.58
5155.59
+7.50
+ 0.15%
--
WTI
Light Sweet Crude Oil
64.340
64.340
64.370
65.803
64.182
-1.196
-1.82%
--

Community Accounts

Signal Accounts
--
Profit Accounts
--
Loss Accounts
--
View More

Become a signal provider

Sell trading signals to earn additional income

View More

Guide to Copy Trading

Get started with ease and confidence

View More

Signal Accounts for Members

All Signal Accounts

Best Return
  • Best Return
  • Best P/L
  • Best MDD
Past 1W
  • Past 1W
  • Past 1M
  • Past 1Y

All Contests

  • All
  • Trump Updates
  • Recommend
  • Stocks
  • Cryptocurrencies
  • Central Banks
  • Featured News
Top News Only
Share

Sweden's Fra Signal Intelligence Agency: The Background Is That The Polish Energy Sector Was Attacked At The End Of December

Share

Turkish Central Bank Net International Reserves At $89.18 Billion As Of Feb 20

Share

India 10-Year Benchmark Government Bond Yield Ends At 6.6943%, Previous Close 6.6777%

Share

Central Bank Data - Forex Held By Turkish Locals Stood At $236.05 Billion As Of February 20, From $234.27 Billion A Week Earlier

Share

Central Bank Data - Turkish Central Bank Gross Forex Reserves Stood At $73.65 Billion As Of February 20 From $79.59 Billion A Week Earlier

Share

Central Bank Data - Foreign Investors' Turkish Stocks $+409.96 Million

Share

Central Bank Data - Foreign Investors' Turkish Government Bonds $-991.44 Million Of In Week To February 20

Share

Sberbank CEO Sees Rouble Close To 100 Per Dollar By End-2026

Share

Worldsteel - Global Steel Output Falls 6.5% Year-On-Year In January

Share

Russia's State Nuclear Corporation Rosatom Says It Will Continue Fulfilling Its Obligations Under Its Foreign Nuclear Power Plant Projects

Share

India Prime Minister Modi: India Will Continue To Consult And Cooperate With All Partners On Establishing Peace In West Asia

Share

India Prime Minister Modi: Will Move Towards Joint Development, Production, Transfer Of Technology In Defence With Israel

Share

74% Of Black Americans And 72% Of Hispanics Disapprove Of Trump's Deportation Tactics, Compared To 51% Of White Respondents, Reuters/Ipsos Poll Finds

Share

Russian Central Bank: Russian Banks' Net Profits At 394 Billion RUB In January Versus 176 Billion RUB In December

Share

Statistics Bureau - Israel Industrial Production -4.3% Seasonally Adjusted In December Versus+7.2% In November

Share

Russian Central Bank: Corporate Lending Down 0.4% Month-On-Month In January, Consumer Lending Up 0.9% Month-On-Month

Share

Pakistan Central Bank's Forex Reserves At $16157.2 Million At End Jan

Share

Belgian February CPI +0.54% Month-On-Month, +1.45% Year-On-Year

Share

I Am Aware Of The Political Difficulties Caused By Delay To EU's Financial Support For Ukraine, Orban Says In Letter

Share

Such A Mission Should Include Experts Delegated By Hungary And Slovakia, Orban Says In Letter To European Council President

TIME
ACT
FCST
PREV
Euro Zone CPI YoY (Excl. Tobacco) (Jan)

A:--

F: --

P: --

U.S. MBA Mortgage Application Activity Index WoW

A:--

F: --

P: --

U.S. EIA Weekly Heating Oil Stock Changes

A:--

F: --

P: --

U.S. EIA Weekly Crude Oil Imports Changes

A:--

F: --

P: --

U.S. EIA Weekly Gasoline Stocks Change

A:--

F: --

P: --

U.S. EIA Weekly Cushing, Oklahoma Crude Oil Stocks Change

A:--

F: --

P: --

U.S. EIA Weekly Crude Demand Projected by Production

A:--

F: --

P: --

U.S. EIA Weekly Crude Stocks Change

A:--

F: --

P: --

Richmond Federal Reserve President Barkin delivered a speech.
U.S. 5-Year Note Auction Avg. Yield

A:--

F: --

P: --

Argentina Retail Sales YoY (Dec)

A:--

F: --

P: --

Nvidia releases financial report
Australia Building Capital Expenditure QoQ (Q4)

A:--

F: --

P: --

South Korea Benchmark Interest Rate

A:--

F: --

P: --

Turkey Economic Sentiment Indicator (Feb)

A:--

F: --

P: --

Turkey Trade Balance (Jan)

A:--

F: --

P: --

ECB President Lagarde Speaks
Euro Zone Private Sector Credit YoY (Jan)

A:--

F: --

P: --

Euro Zone M3 Money Supply YoY (Jan)

A:--

F: --

P: --

Euro Zone 3-Month M3 Money Supply YoY (Jan)

A:--

F: --

P: --

Euro Zone M3 Money Supply (SA) (Jan)

A:--

F: --

P: --

South Africa PPI YoY (Jan)

A:--

F: --

P: --

Euro Zone Services Sentiment Index (Feb)

A:--

F: --

P: --

Euro Zone Industrial Climate Index (Feb)

A:--

F: --

P: --

Euro Zone Economic Sentiment Indicator (Feb)

A:--

F: --

P: --
Euro Zone Selling Price Expectations (Feb)

A:--

F: --

P: --

Euro Zone Consumer Inflation Expectations (Feb)

A:--

F: --

P: --

Euro Zone Consumer Confidence Index Final (Feb)

A:--

F: --

P: --

Italy 5-Year BTP Bond Auction Avg. Yield

A:--

F: --

P: --

Italy 10-Year BTP Bond Auction Avg. Yield

A:--

F: --

P: --

Mexico Unemployment Rate (Not SA) (Jan)

--

F: --

P: --

Canada Average Weekly Earnings YoY (Dec)

--

F: --

P: --

Canada Current Account (SA) (Q4)

--

F: --

P: --

U.S. Initial Jobless Claims 4-Week Avg. (SA)

--

F: --

P: --

U.S. Weekly Continued Jobless Claims (SA)

--

F: --

P: --

U.S. Weekly Initial Jobless Claims (SA)

--

F: --

P: --

U.S. EIA Weekly Natural Gas Stocks Change

--

F: --

P: --

U.S. Kansas Fed Manufacturing Production Index (Feb)

--

F: --

P: --

U.S. Kansas Fed Manufacturing Composite Index (Feb)

--

F: --

P: --

U.S. Weekly Treasuries Held by Foreign Central Banks

--

F: --

P: --

Japan Tokyo CPI YoY (Excl. Food & Energy) (Feb)

--

F: --

P: --

Japan Tokyo CPI MoM (Feb)

--

F: --

P: --

Japan Tokyo Core CPI YoY (Feb)

--

F: --

P: --

Japan Tokyo CPI YoY (Feb)

--

F: --

P: --

Japan Tokyo CPI MoM (Excl. Food & Energy) (Feb)

--

F: --

P: --

Japan Industrial Inventory MoM (Jan)

--

F: --

P: --

Japan Retail Sales (Jan)

--

F: --

P: --

Japan Retail Sales MoM (SA) (Jan)

--

F: --

P: --

Japan Industrial Output Prelim YoY (Jan)

--

F: --

P: --

Japan Retail Sales YoY (Jan)

--

F: --

P: --

Japan Industrial Output Prelim MoM (Jan)

--

F: --

P: --

Japan Large-Scale Retail Sales YoY (Jan)

--

F: --

P: --
U.K. GfK Consumer Confidence Index (Feb)

--

F: --

P: --

Japan Construction Orders YoY (Jan)

--

F: --

P: --

Japan New Housing Starts YoY (Jan)

--

F: --

P: --

Turkey Economic Sentiment Indicator (Feb)

--

F: --

P: --

France PPI MoM (Jan)

--

F: --

P: --

Germany Unemployment Rate (SA) (Feb)

--

F: --

P: --

India GDP YoY

--

F: --

P: --

India Quarterly GDP YoY (Q3)

--

F: --

P: --

Q&A with Experts
    • All
    • Chatrooms
    • Groups
    • Friends
    Visxa Benfica flag
    Ikeh Sunday
    @Ikeh SundayIt only ends when you are no longer a fisherman
    Ashok flag
    gold is full sell today i garuntee y 99%
    Ikeh Sunday flag
    Gibran Gib
    @Gibran Giblol
    Visxa Benfica flag
    Ashok
    @AshokOh, so are you buying or selling?
    ROHIM flag
    Gibran Gib
    @Gibran Gib Who is that? Is it uncle @Ikeh Kimochi ??
    Ikeh Sunday flag
    Visxa Benfica
    @Visxa Benficatrue talk
    Kevedge FX flag
    gold tape activated: to watch the direction smart money is taking-
    Visxa Benfica flag
    Ikeh Sunday
    @Ikeh SundayI was just kidding you
    Kevedge FX flag
    Gibran Gib flag
    ROHIM
    @ROHIM
    Visxa Benfica flag
    @Ikeh SundayI really can't tell when it will end
    Visxa Benfica flag
    Kevedge FX
    gold tape activated: to watch the direction smart money is taking-
    @Kevedge FXI am using 4-hour and 1-hour charts to find entry points
    Visxa Benfica flag
    What time frame do you usually use?
    Ikeh Sunday flag
    ROHIM
    @ROHIMlol. i Went to Pakistan for 2days summer . lol
    Kevedge FX flag
    expect a move down on gold now
    Ikeh Sunday flag
    Visxa Benfica
    @Visxa BenficaI kn
    Kevedge FX flag
    we got a red star now
    Kevedge FX flag
    ROHIM flag
    Ikeh Sunday
    @Ikeh Sunday What's it like to live there?
    Ikeh Sunday flag
    ROHIM
    @ROHIMjust kidding . lol
    Type here...
    Add Symbol or Code

      No matching data

      All
      Trump Updates
      Recommend
      Stocks
      Cryptocurrencies
      Central Banks
      Featured News
      • All
      • Russia-Ukraine Conflict
      • Middle East Flashpoint
      • All
      • Russia-Ukraine Conflict
      • Middle East Flashpoint
      Search
      Products

      Charts Free Forever

      Chats Q&A with Experts
      Screeners Economic Calendar Data Tools
      Membership Features
      Data Warehouse Market Trends Institutional Data Policy Rates Macro

      Market Trends

      Market Sentiment Order Book Forex Correlations

      Top Indicators

      Charts Free Forever
      Markets

      News

      24/7 Analysis Education

      Latest Views

      Latest Update

      Signals

      Copy Rankings Latest Signals Become a signal provider AI Rating
      Contests
      Brokers

      Overview Brokers Assessment Rankings Regulators News Claims
      Broker listing Forex Brokers Comparison Tool Live Spread Comparison Scam
      Q&A Complaint Scam Alert Videos Tips to Detect Scam
      More

      Business
      Events
      Careers About Us Advertising Help Center

      White Label

      Broker API

      Data API

      Web Plug-ins

      Affiliate Program

      Awards Institution Evaluation IB Seminar Salon Event Exhibition
      Vietnam Thailand Singapore Dubai
      Fans Party Investment Sharing Session
      FastBull Summit BrokersView Expo
      Recent Searches
        Top Searches
          Markets
          Analysis
          User
          24/7
          Economic Calendar
          Education
          Data
          • Names
          • Latest
          • Prev

          View All

          No data

          Scan to Download

          Faster Charts, Chat Faster!

          Download App
          English
          • English
          • Español
          • العربية
          • Bahasa Indonesia
          • Bahasa Melayu
          • Tiếng Việt
          • ภาษาไทย
          • Français
          • Italiano
          • Türkçe
          • Русский язык
          • 简中
          • 繁中
          Open Account
          Search
          Products
          Charts Free Forever
          Markets
          News
          Signals

          Copy Rankings Latest Signals Become a signal provider AI Rating
          Contests
          Brokers

          Overview Brokers Assessment Rankings Regulators News Claims
          Broker listing Forex Brokers Comparison Tool Live Spread Comparison Scam
          Q&A Complaint Scam Alert Videos Tips to Detect Scam
          More

          Business
          Events
          Careers About Us Advertising Help Center

          White Label

          Broker API

          Data API

          Web Plug-ins

          Affiliate Program

          Awards Institution Evaluation IB Seminar Salon Event Exhibition
          Vietnam Thailand Singapore Dubai
          Fans Party Investment Sharing Session
          FastBull Summit BrokersView Expo

          Bitcoin Rebounds To $87K, Targets $90K Breakout Level Next

          Catherine Richards

          Cryptocurrency

          Technical Analysis

          Summary:

          Bitcoin rose to $87,350 and now sits just below the key resistance zone at $88,500. Open interest fell sharply to $6.31B as market pressure built in early April 2025. Inflation touched 0.97%

          ● Bitcoin rose to $87,350 and now sits just below the key resistance zone at $88,500.
          ● Open interest fell sharply to $6.31B as market pressure built in early April 2025.
          ● Inflation touched 0.97% in March and slowed Bitcoin’s upward momentum significantly.

          Bitcoin (BTC) showed significant recovery momentum after a week of consolidation, rising by over 3% as of April 21, 2025, to reach $87,350 at press time. This upward movement brings BTC closer to the key $88,500 resistance level, a critical area that could trigger further liquidity movement. If it breaches this resistance effectively, BTC may target the $90k level given the current price action and patterns noted on previous breakouts tried in analogous zones.

          BTC Testing Key Resistance Levels

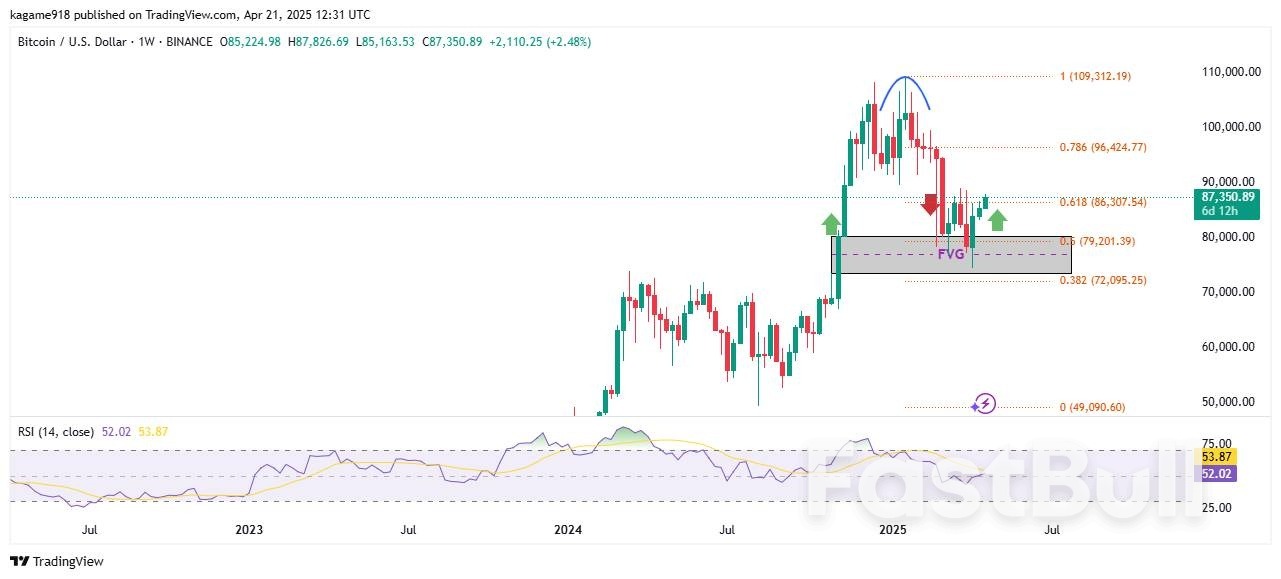
          BTC has shown resilience, consolidating between $76,000 and $87,350 in recent weeks after failing to hold above $90,000 during earlier attempts. The chart analysis highlights $88,500 as a major resistance point, where BTC has previously struggled to maintain upward momentum. The 0.618 Fibonacci retracement level at $86,307 suggests that BTC is holding firm near this zone, signaling that the market could be preparing for another upward push if buying pressure continues and liquidity above $88,500 is taken.

          Furthermore, the Relative Strength Index (RSI) at 52.02 relative to the 14-day close of 53.87 suggests a neutral market sentiment. This level suggests that BTC has potential for growth, as it is far from being overbought. The recovery of RSI from the low 40s confirms renewed buying interest after weeks of stagnation. In this case, should the buying side strengthen, BTC would push past resistance at $88,500 and move toward $90,000 before facing further obstacles near its $96,424 and $109,312 Fibonacci extensions.

          If BTC fails to sustain above $88,500, it might retrace toward the $79,200 support level, aligning with the 0.5 Fibonacci zone. Additionally, if the sentiment declines, the $72,095 mark at the 0.382 retracement may act as the next downside buffer. The Fair Value Gap (FVG) formed earlier is still active below the current price and may act as a magnet should the momentum fade in the short term.

          Source: CryptoSlate

          Risk Warnings and Disclaimers
          You understand and acknowledge that there is a high degree of risk involved in trading. Following any strategies or investment methods may lead to potential losses. The content on the site is provided by our contributors and analysts for information purposes only. You are solely responsible for determining whether any trading assets, securities, strategy, or any other product is suitable for investing based on your own investment objectives and financial situation.
          Add to Favorites
          Share
          FastBull
          Copyright © 2026 FastBull Ltd

          728 RM B 7/F GEE LOK IND BLDG NO 34 HUNG TO RD KWUN TONG KLN HONG KONG

          TelegramInstagramTwitterfacebooklinkedin
          App Store Google Play Google Play
          Products
          Charts

          Chats

          Q&A with Experts
          Screeners
          Economic Calendar
          Data
          Tools
          Membership
          Features
          Function
          Markets
          Copy Trading
          Latest Signals
          Contests
          24/7
          Analysis
          Education
          Company
          Careers
          About Us
          Contact Us
          Advertising
          Help Center
          Feedback
          User Agreement
          Privacy Policy
          Personal Information Protection Statement
          Business

          White Label

          Broker API

          Data API

          Web Plug-ins

          Poster Maker

          Affiliate Program

          Risk Disclosure

          The risk of loss in trading financial instruments such as stocks, FX, commodities, futures, bonds, ETFs and crypto can be substantial. You may sustain a total loss of the funds that you deposit with your broker. Therefore, you should carefully consider whether such trading is suitable for you in light of your circumstances and financial resources.

          No decision to invest should be made without thoroughly conducting due diligence by yourself or consulting with your financial advisors. Our web content might not suit you since we don't know your financial conditions and investment needs. Our financial information might have latency or contain inaccuracy, so you should be fully responsible for any of your trading and investment decisions. The company will not be responsible for your capital loss.

          Without getting permission from the website, you are not allowed to copy the website's graphics, texts, or trademarks. Intellectual property rights in the content or data incorporated into this website belong to its providers and exchange merchants.

          Not Logged In

          Log in to access more features

          Connect Broker
          Become a signal provider
          Help Center
          Customer Service
          Dark Mode
          Price Up/Down Colors

          Log In

          Sign Up

          Position
          Layout
          Fullscreen
          Default to Chart
          The chart page opens by default when you visit fastbull.com