Markets
News
Analysis
User
24/7
Economic Calendar
Education
Data
- Names
- Latest
- Prev


Signal Accounts for Members
All Signal Accounts
All Contests


U.K. Trade Balance Non-EU (SA) (Oct)A:--
F: --
P: --
U.K. Trade Balance (Oct)A:--
F: --
P: --
U.K. Services Index MoMA:--
F: --
P: --
U.K. Construction Output MoM (SA) (Oct)A:--
F: --
P: --
U.K. Industrial Output YoY (Oct)A:--
F: --
P: --
U.K. Trade Balance (SA) (Oct)A:--
F: --
P: --
U.K. Trade Balance EU (SA) (Oct)A:--
F: --
P: --
U.K. Manufacturing Output YoY (Oct)A:--
F: --
P: --
U.K. GDP MoM (Oct)A:--
F: --
P: --
U.K. GDP YoY (SA) (Oct)A:--
F: --
P: --
U.K. Industrial Output MoM (Oct)A:--
F: --
P: --
U.K. Construction Output YoY (Oct)A:--
F: --
P: --
France HICP Final MoM (Nov)A:--
F: --
P: --
China, Mainland Outstanding Loans Growth YoY (Nov)A:--
F: --
P: --
China, Mainland M2 Money Supply YoY (Nov)A:--
F: --
P: --
China, Mainland M0 Money Supply YoY (Nov)A:--
F: --
P: --
China, Mainland M1 Money Supply YoY (Nov)A:--
F: --
P: --
India CPI YoY (Nov)A:--
F: --
P: --
India Deposit Gowth YoYA:--
F: --
P: --
Brazil Services Growth YoY (Oct)A:--
F: --
P: --
Mexico Industrial Output YoY (Oct)A:--
F: --
P: --
Russia Trade Balance (Oct)A:--
F: --
P: --
Philadelphia Fed President Henry Paulson delivers a speech
Canada Building Permits MoM (SA) (Oct)A:--
F: --
P: --
Canada Wholesale Sales YoY (Oct)A:--
F: --
P: --
Canada Wholesale Inventory MoM (Oct)A:--
F: --
P: --
Canada Wholesale Inventory YoY (Oct)A:--
F: --
P: --
Canada Wholesale Sales MoM (SA) (Oct)A:--
F: --
P: --
Germany Current Account (Not SA) (Oct)A:--
F: --
P: --
U.S. Weekly Total Rig CountA:--
F: --
P: --
U.S. Weekly Total Oil Rig CountA:--
F: --
P: --
Japan Tankan Large Non-Manufacturing Diffusion Index (Q4)--
F: --
P: --
Japan Tankan Small Manufacturing Outlook Index (Q4)--
F: --
P: --
Japan Tankan Large Non-Manufacturing Outlook Index (Q4)--
F: --
P: --
Japan Tankan Large Manufacturing Outlook Index (Q4)--
F: --
P: --
Japan Tankan Small Manufacturing Diffusion Index (Q4)--
F: --
P: --
Japan Tankan Large Manufacturing Diffusion Index (Q4)--
F: --
P: --
Japan Tankan Large-Enterprise Capital Expenditure YoY (Q4)--
F: --
P: --
U.K. Rightmove House Price Index YoY (Dec)--
F: --
P: --
China, Mainland Industrial Output YoY (YTD) (Nov)--
F: --
P: --
China, Mainland Urban Area Unemployment Rate (Nov)--
F: --
P: --
Saudi Arabia CPI YoY (Nov)--
F: --
P: --
Euro Zone Industrial Output YoY (Oct)--
F: --
P: --
Euro Zone Industrial Output MoM (Oct)--
F: --
P: --
Canada Existing Home Sales MoM (Nov)--
F: --
P: --
Euro Zone Total Reserve Assets (Nov)--
F: --
P: --
U.K. Inflation Rate Expectations--
F: --
P: --
Canada National Economic Confidence Index--
F: --
P: --
Canada New Housing Starts (Nov)--
F: --
P: --
U.S. NY Fed Manufacturing Employment Index (Dec)--
F: --
P: --
U.S. NY Fed Manufacturing Index (Dec)--
F: --
P: --
Canada Core CPI YoY (Nov)--
F: --
P: --
Canada Manufacturing Unfilled Orders MoM (Oct)--
F: --
P: --
Canada Manufacturing New Orders MoM (Oct)--
F: --
P: --
Canada Core CPI MoM (Nov)--
F: --
P: --
Canada Manufacturing Inventory MoM (Oct)--
F: --
P: --
Canada CPI YoY (Nov)--
F: --
P: --
Canada CPI MoM (Nov)--
F: --
P: --
Canada CPI YoY (SA) (Nov)--
F: --
P: --
Canada Core CPI MoM (SA) (Nov)--
F: --
P: --


No matching data
Latest Views
Latest Views
Trending Topics
Top Columnists
Latest Update
White Label
Data API
Web Plug-ins
Affiliate Program
View All

No data
Bitcoin Price Today
| Cryptocurrency | Bitcoin |
| Token | BTC |
| Price | $112,591.0975 -0.42% |
| Market Cap | $ 2,242,682,367,319.72 |
| 24h Volume | $ 49,226,403,985.1665 |
| Circulating Supply | 19,918,825.00 |
| Total Supply | 19,918,825.00 |
| All-Time High | $ 124,457.1169 on 14 August 2025 |
| All-Time Low | $ 0.0486 on 14 July 2010 |
The crypto market has started the week on steady ground, with Bitcoin trading between $111,085 and $112,040 in the past 24 hours. Despite some selling pressure, Bitcoin has held firm, showing resilience and keeping its dominance intact.
According to CryptoBusy, Bitcoin’s strong volume-to-market cap ratio of 1.29% and declining volatility, dropping from 60% to 30% are now attracting institutional attention.
“Bitcoin is edging closer to gold’s risk profile,” said CryptoBusy, highlighting BTC’s growing appeal to large investors.
Bitcoin Price Analysis: Key Levels to Watch
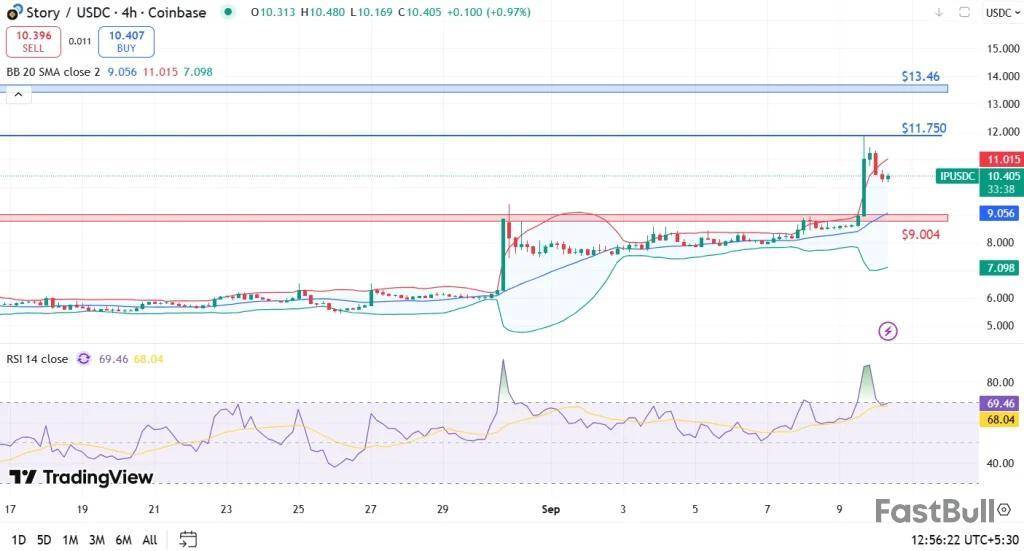
On the technical side, Bitcoin is building bullish momentum. On the 2-hour chart, BTC is testing resistance near $111,922, with EMA indicators clustering between $111,000 and $111,500.
A bullish crossover on the MACD is signaling upside momentum, and traders are watching whether Bitcoin can push past the 200 EMA.
Bitcoin vs Gold: Historical Trends
Analysts note that gold typically lags behind Bitcoin by around 100 days due to its greater liquidity and broader adoption.
“Gold historically leads Bitcoin… but with gold’s rally showing signs of peaking, attention is shifting to whether BTC can follow with its own breakout in Q4,” noted analyst Joe Consorti.
Research firm Tephra Digital also reinforced this view, stating:
“Bitcoin’s correlation with global money supply and gold suggests BTC could reach between $167,000 and $185,000 if past trends repeat.”
Gold and Silver Competition
While many are bullish on Bitcoin, not everyone agrees. Silver has surged above $41, its highest price since 2012, drawing investor interest toward traditional safe havens.
Economist Peter Schiff argues Bitcoin still lags behind:
“Measured against gold, Bitcoin remains 16% below its 2021 peak,” he said, adding that mainstream media is misreading the gold rally.
In Schiff’s view, the real drivers behind gold’s rise are:
“These will ultimately fuel soaring inflation and push gold even higher,” Schiff warned.
Q4 2025: A Decisive Moment for Bitcoin and Gold
As the final quarter of 2025 approaches, all eyes are on whether Bitcoin can break above $113,500 and sustain its momentum.
If BTC manages to do so, it could prove that digital gold is finally ready to outpace its traditional counterpart.
FAQs
Why is Bitcoin’s price up today?Bitcoin is holding firm due to strong institutional appeal from its declining volatility and high volume-to-market cap ratio of 1.29%.
What is the Bitcoin price prediction for September 2025?Analysis suggests if September’s bullish momentum continues, Bitcoin could break out toward its short-term target of $125,000–$128,000.
How is institutional investment impacting Bitcoin’s price?Institutional investment is boosting Bitcoin’s appeal as its volatility drops to 30%, nearing gold’s risk profile, creating sustained demand and price stability.
What factors could push Bitcoin’s price higher in Q4 2025?If Bitcoin breaks and holds above $113,500, it could prove to be the “digital gold” that outpaces its traditional counterpart. Analysts also see a breakout target of $125,000-$128,000.
Story IP is now under the watchlist of many, and possibly yours too, after it broke into its uncharted territory. The token price surged 19% in the past 24 hours, touching a new all-time high of $11.75. Over the last week, Story IP price is up more than 30%, taking its market cap a notch higher to $3.11 billion. What’s amassed attention is the daily volume soaring 675% to $652.2 million.
This rally hasn’t happened in isolation. A mix of token buybacks, strong institutional flows, and regional exchange demand has fueled the upside momentum. More about which you’ll learn as we proceed. However, it also brings heightened risks that traders should keep in mind. Let’s break down the price action and what may come next.
Top Reasons Why Story IP is Rallying
The fundamentals behind this surge are just as compelling as the chart:
Story IP Price Analysis
The technical setup tells that Story IP smashed through the 23.6% Fibonacci retracement at $10.26. Talking about indicators, the RSI 14 is at 68.19, just shy of the overbought mark, while the MACD histogram widened to +0.25, reflecting bullish pressure steaming up.
With IP price riding above its 7-day SMA of $8.57, the token is trading at a 16.7% premium over its short-term average. While this highlights strength, it also raises the possibility of a near-term pullback. If buyers keep the fire going and break above the $11.75 ATH, the next major technical target lies at the 127.2% Fibonacci extension around $13.46. That level could become the next battleground for bulls and bears.
On the flip side, the 38.2% Fib level at $9.34 is the threshold to watch. A daily close below this zone might invite profit-taking and cool off momentum. For now, though, the charts suggest traders are chasing the breakout rather than waiting on the sidelines.
FAQs
What is the price of Story IP today?Story IP is currently trading around $10.22, just below its new ATH of $11.75.
What’s the biggest risk for Story IP investors right now?With RSI near overbought levels and price stretched above short-term averages, a correction toward $9.34 is possible if momentum slows.
How high can Story IP price go?If the bulls break past $11.75, the next key resistance sits near $13.46, based on Fibonacci extensions.
TL;DR
XRP Price Nears Key Technical Level
XRP is trading around $2.95, positioned near the top of a descending triangle that has formed on the 12-hour chart. The setup shows horizontal support at $2.75 and a downward trendline from late July to early September. The current structure signals a potential breakout as the price presses against resistance.
According to analyst Ali Martinez,
If $XRP breaks out of this descending triangle, the next target is $3.60. pic.twitter.com/KdRlXLbog0
— Ali (@ali_charts) September 9, 2025
Fibonacci levels between $3.10 and $3.40 show possible checkpoints before the price reaches that level. These areas could act as temporary resistance if thebreakout continues. A brief retest near $3.00 could follow, based on historical chart behavior.
Meanwhile, failure to break above the triangle could send the ассет back toward $2.75. A move below $2.65 would cancel the bullish setup.Market Still Lacks Strong Confirmation
Technical analyst CRYPTOWZRD reported that XRP’s daily candle closed without a clear direction.
“We will have to wait for the next healthy price action to get the next mature chart formation,” he noted.
The daily chart shows XRP trading just above the lower-high trendline, but the move lacks volume confirmation.
They would monitor the chart for entries above $3.13, with an earlier possibility near $3.05 if the market shows signs of stability. The analyst also confirmed that his current position is already secured.
Lower time frames showed inconsistentmomentumduring the day, and further moves depend on clean structure and volume. Without it, new positions remain on hold.Futures Traders Position for Movement
Data from Coinglass shows that XRP Futures Open Interest stands at $7.94 billion. This is a sharp increase compared to earlier months, where figures stayed below $2 billion. The rise reflects strong participation from derivatives traders.
A spike in open interest shows many contracts remain active, but it does not indicate direction. It does show that traders are preparing for volatility after an extended quiet period in price action.
Trader Galaxy commented,
“Pure consolidation for over 280 days in the $2-3 range, and running out of space to compress.”
The chart shows XRP has moved mostly sideways within this zone since late last year.
Notably, this compression near resistance and rising open interest are signals that traders are watching for a breakout. The next few sessions will be critical as price tests the upper edge of the triangle.
September has once again lived up to its reputation as one of the bearish months for cryptocurrencies, and this year, Ethereum is at the center of attention. With spot, futures, and on-chain activity all hitting new highs, ETH is showing signs of stronger investor demand and holding power.
Now, all eyes are on whether it can finally break the $5,000 barrier.
Ethereum Takes the Lead in Volumes
Since early August, Ethereum has quietly overtaken Bitcoin in spot trading share. ETH currently holds 32.9% of spot volume compared to Bitcoin’s 32.6%, a narrow edge but a meaningful one. At its peak, ETH hit 41% share with $480B in spot volume, outpacing Bitcoin’s $400B.
CryptoRank.io@CryptoRank_ioSep 09, 20251/ Since early August, ETH has overtaken BTC in spot volume share, currently at 32.9% vs 32.6%.
The peak ETH share of 41% was recorded during the week of August 18-25.
As a result, total ETH spot volume reached $480B, compared to $400B for Bitcoin.
The futures market shows the same trend. Ethereum futures volumes surpassed Bitcoin back in mid-July and went on to hit a record $3.08 trillion in August. Ethereum futures hit a record $3.08T in August, with open interest near $59B, reflecting steady investor demand.
On-chain activity is also booming, $258B locked in DeFi, 51.7M monthly active addresses, and $140B in DEX trading. Meanwhile, ETH balances on exchanges fell to a three-year low, signaling strong holding demand.
Ethereum ETF Demand Boom
Much of Ethereum’s rally this year has been powered by ETFs. In 2025 alone, ETH ETFs attracted nearly $10 billion in net inflows. These products have become a major force in the market, with cumulative spot ETF volume nearing $200 billion. In fact, ETFs now account for 16% of all ETH spot trading, a record share.
Meanwhile, BlackRock’s ETHA fund leads the pack, commanding 74% of ETF trading activity. Today, after six straight days of outflows, the ETH ETF saw an inflow of $44.2 million, which all came from BlackRock alone.
Ethereum Price Analysis: Can ETH Break the $5K Wall?
Ethereum has been moving in a tight range since August, with bulls and bears battling for control. The $4,956 mark remains the big ceiling that stopped ETH’s last rally, while $4,310 is the key floor holding the line.
If ETH slips under $4,250, the next stops could be $4000 or even $3,874, levels tied to both Fibonacci retracement and past reaction zones. But so far, Ethereum’s 200-day SMA and EMA are trending higher, giving bulls an important safety net.
Ali@ali_chartsSep 09, 2025$4,250 is the support level to watch for Ethereum BINANCE:ETHUSDT! pic.twitter.com/eLEhnROJh9
History shows Ethereum rarely stays below these moving averages during strong bull runs. If buyers can finally push ETH above $5,000, momentum could flip quickly, with targets at $5,500 and even $6,000 in sight.
Paxos Labs published an updated version of its proposal to issue Hyperliquid's upcoming USDH stablecoin amid a competitive bidding process against other stablecoin issuers.
The V2 proposal from Paxos, unveiled Tuesday, outlines a plan to scale the Hyperliquid ecosystem globally. This includes a partnership with PayPal aimed at expanding USDH distribution by integrating the stablecoin into PayPal's checkout and payment channels.
The partnership will also enable PayPal and Venmo to list Hyperliquid's native HYPE token and add USDH support to PayPal's on/off-ramp products, accessible at no cost. In addition, PayPal is committing $20 million in incentives to the HYPE ecosystem.
Apart from the partnership, Paxos set forth an updated rewards system where revenue from USDH will be reinvested in growth and Hyperliquid's Assistance Fund (AF) until the stablecoin's total value locked (TVL) hits $1 billion. Paxos' revenue share will be capped at 5% even after TVL crosses $5 billion, the proposal noted.
"Together, this framework ensures Paxos only wins if Hyperliquid wins, and USDH becomes the gateway stablecoin for global DeFi adoption," Paxos said.
Paxos further highlighted its compliance with the GENIUS Act and said it is the only company that can legally issue tokens in Europe. It said it will add PYUSD as a reserve asset to ensure compliance and stability.
Hyperliquid for enterprises
The updated proposal stated that Paxos will help Hyperliquid become a liquidity infrastructure for enterprises, beyond its current retail-focused user base.
"Paxos has the ability to materialize this vision of scaling frontend access to Hyperliquid by working with fintech enterprises and brokerages to incorporate builder codes," the proposal said.
For this initiative, Paxos aims to attract asset issuers into Hyperliquid's open market creation system (HIP-3) and leverage HyperEVM to enhance DeFi integration. Paxos also plans to develop an "Earn" product using USDH, which will be integrated into consumer apps.
The updated proposal leverages Paxos' established infrastructure, which provides stablecoin services for platforms including Stripe, Mastercard, Robinhood, Nubank, Mercado Libre, and Interactive Brokers.
Paxos faces stiff competition. Frax Finance, for instance, has put forward a proposal to back USDH with its frxUSD, which BlackRock's BUIDL fund backs. Other contenders include a coalition of Agora, Rain, and LayerZero, which has pledged a 100% net revenue share and emphasized its neutrality. Ethena Labs and Sky also submitted their proposals.
This bidding war highlights Hyperliquid's influence in the DeFi space and stablecoin's growing significance. The decentralized perpetuals exchange announced its search for a USDH issuer last Friday, inviting proposals with a deadline of Sept. 10. Validators are scheduled to vote on the winner starting September 14, with the Hyperliquid Foundation abstaining.
Disclaimer: The Block is an independent media outlet that delivers news, research, and data. As of November 2023, Foresight Ventures is a majority investor of The Block. Foresight Ventures invests in other companies in the crypto space. Crypto exchange Bitget is an anchor LP for Foresight Ventures. The Block continues to operate independently to deliver objective, impactful, and timely information about the crypto industry. Here are our current financial disclosures.
© 2025 The Block. All Rights Reserved. This article is provided for informational purposes only. It is not offered or intended to be used as legal, tax, investment, financial, or other advice.
Metaplanet Inc., a Tokyo-listed investment company, announced plans to raise more than $1.38 billion (204.1 billion yen) through an overseas share offering.
The firm intends to use most funds to expand its Bitcoin holdings, highlighting its continued shift toward digital assets as a treasury strategy.
Share Offering and Capital Structure
The board approved the issuance of 385 million new shares at $3.75 (553 yen) per share. This sale will increase the company’s outstanding shares from 755.9 million to 1.14 billion, and it expects net proceeds of $1.38 billion.
The payment date is September 16, and delivery will follow on September 17. By choosing an international placement, Metaplanet seeks to broaden its investor base and reduce reliance on domestic capital.
Of the proceeds, $1.24 billion will go toward Bitcoin purchases in September and October 2025. The company has said that building Bitcoin reserves shields its balance sheet from yen depreciation and inflation risks.
As of September 1, 2025, Metaplanet held 20,000 BTC, worth about $2.06 billion. Executives argue that Bitcoin provides long-term value growth while protecting assets from negative real interest rates in Japan.
Expanding Bitcoin Income Business
The firm will also allocate $138 million to its Bitcoin income business, mainly through options trading. This unit reported sales of $8.34 million in the second quarter of fiscal 2025. With the new capital, Metaplanet aims to achieve full-year profitability in the segment by December.
These moves strengthen the company’s position as Japan’s largest corporate Bitcoin holder. Moreover, they mirror strategies of several US-listed companies that use Bitcoin as a reserve asset.
On the other hand, crypto treasury firms show signs of strain as mNAV drops and share prices weaken. While still active, their reliance on equity highlights risks that could slow the once-unstoppable strategy.
On September 9, Spot Bitcoin ETFs recorded $23.05 million in total net inflows, driven by $169 million from BlackRock’s IBIT. Spot Ethereum ETFs turned positive with $44.16 million in inflows after six straight days of outflows.
Bitcoin ETF Breakdown
The Bitcoin net inflow is $23.05 million, led by BlackRock’s IBIT $169.31 million in net inflows. This was partially offset by $55.81 million inflows into Fidelity’s FBTC, $72.9 million into Ark & 21Shares ARKB, and $18.15 million in Bitwise BITB.
Total trading volume reached $3.03 billion, with overall net assets falling to $144.30 billion, representing 6.50% of Bitcoin’s market cap, according to SoSoValue.
IBIT continues to dominate daily flows with net assets of $83.72 billion and trading volume of $2.29 billion. None of the twelve ETFs recorded a net outflow.
Ethereum ETF Breakdown
Ethereum ETFs recorded a net inflow of $44.16 million, entirely driven by BlackRock’s ETHA.
Total trading volume reached $1.28 billion, while overall net assets fell to $27.39 billion, representing 5.27% of Ethereum’s market cap. This was a decline from yesterday’s $96.69 million inflow, when trading volume was $1.52 billion.
ETHA is currently the only Ethereum ETF leading daily flows, with net assets of $15.76 billion and $883.30 million in total transactions. None of the nine ETFs experienced a net outflow.
Market Context
Bitcoin trades at $111,567, with a market capitalization above $2 trillion, while Ethereum trades around $4,302.44, with a market cap of $590.80 billion. Ethereum’s trading volume today dropped to $27.33 billion, while Bitcoin remains strong at $43.765 billion.
Institutional activity in both cryptocurrencies continues to be driven by growing adoption and interest in spot ETFs.
White Label
Data API
Web Plug-ins
Poster Maker
Affiliate Program
The risk of loss in trading financial instruments such as stocks, FX, commodities, futures, bonds, ETFs and crypto can be substantial. You may sustain a total loss of the funds that you deposit with your broker. Therefore, you should carefully consider whether such trading is suitable for you in light of your circumstances and financial resources.
No decision to invest should be made without thoroughly conducting due diligence by yourself or consulting with your financial advisors. Our web content might not suit you since we don't know your financial conditions and investment needs. Our financial information might have latency or contain inaccuracy, so you should be fully responsible for any of your trading and investment decisions. The company will not be responsible for your capital loss.
Without getting permission from the website, you are not allowed to copy the website's graphics, texts, or trademarks. Intellectual property rights in the content or data incorporated into this website belong to its providers and exchange merchants.
Not Logged In
Log in to access more features

FastBull Membership
Not yet
Purchase
Log In
Sign Up