Markets
News
Analysis
User
24/7
Economic Calendar
Education
Data
- Names
- Latest
- Prev


Signal Accounts for Members
All Signal Accounts
All Contests


Mexico Consumer Confidence Index (Nov)A:--
F: --
P: --
Canada Unemployment Rate (SA) (Nov)A:--
F: --
P: --
Canada Labor Force Participation Rate (SA) (Nov)A:--
F: --
P: --
Canada Employment (SA) (Nov)A:--
F: --
P: --
Canada Part-Time Employment (SA) (Nov)A:--
F: --
P: --
Canada Full-time Employment (SA) (Nov)A:--
F: --
P: --
U.S. Personal Income MoM (Sept)A:--
F: --
P: --
U.S. PCE Price Index YoY (SA) (Sept)A:--
F: --
P: --
U.S. PCE Price Index MoM (Sept)A:--
F: --
P: --
U.S. Personal Outlays MoM (SA) (Sept)A:--
F: --
P: --
U.S. Core PCE Price Index MoM (Sept)A:--
F: --
P: --
U.S. Core PCE Price Index YoY (Sept)A:--
F: --
P: --
U.S. UMich 5-Year-Ahead Inflation Expectations Prelim YoY (Dec)A:--
F: --
P: --
U.S. Real Personal Consumption Expenditures MoM (Sept)A:--
F: --
P: --
U.S. 5-10 Year-Ahead Inflation Expectations (Dec)A:--
F: --
P: --
U.S. UMich Current Economic Conditions Index Prelim (Dec)A:--
F: --
P: --
U.S. UMich Consumer Sentiment Index Prelim (Dec)A:--
F: --
P: --
U.S. UMich 1-Year-Ahead Inflation Expectations Prelim (Dec)A:--
F: --
P: --
U.S. UMich Consumer Expectations Index Prelim (Dec)A:--
F: --
P: --
U.S. Weekly Total Rig CountA:--
F: --
P: --
U.S. Weekly Total Oil Rig CountA:--
F: --
P: --
U.S. Unit Labor Cost Prelim (SA) (Q3)--
F: --
P: --
U.S. Consumer Credit (SA) (Oct)A:--
F: --
P: --
China, Mainland Foreign Exchange Reserves (Nov)A:--
F: --
P: --
China, Mainland Exports YoY (USD) (Nov)--
F: --
P: --
China, Mainland Imports YoY (CNH) (Nov)--
F: --
P: --
China, Mainland Imports YoY (USD) (Nov)--
F: --
P: --
China, Mainland Imports (CNH) (Nov)--
F: --
P: --
China, Mainland Trade Balance (CNH) (Nov)--
F: --
P: --
China, Mainland Exports (Nov)--
F: --
P: --
Japan Wages MoM (Oct)--
F: --
P: --
Japan Trade Balance (Oct)--
F: --
P: --
Japan Nominal GDP Revised QoQ (Q3)--
F: --
P: --
Japan Trade Balance (Customs Data) (SA) (Oct)--
F: --
P: --
Japan GDP Annualized QoQ Revised (Q3)--
F: --
China, Mainland Exports YoY (CNH) (Nov)--
F: --
P: --
Germany Industrial Output MoM (SA) (Oct)--
F: --
P: --
Euro Zone Sentix Investor Confidence Index (Dec)--
F: --
P: --
Canada Leading Index MoM (Nov)--
F: --
P: --
Canada National Economic Confidence Index--
F: --
P: --
U.S. Dallas Fed PCE Price Index YoY (Sept)--
F: --
P: --
China, Mainland Trade Balance (USD) (Nov)--
F: --
P: --
U.S. 3-Year Note Auction Yield--
F: --
P: --
U.K. BRC Overall Retail Sales YoY (Nov)--
F: --
P: --
U.K. BRC Like-For-Like Retail Sales YoY (Nov)--
F: --
P: --
Australia Overnight (Borrowing) Key Rate--
F: --
P: --
RBA Rate Statement
RBA Press Conference
Germany Exports MoM (SA) (Oct)--
F: --
P: --
U.S. NFIB Small Business Optimism Index (SA) (Nov)--
F: --
P: --
Mexico Core CPI YoY (Nov)--
F: --
P: --
Mexico 12-Month Inflation (CPI) (Nov)--
F: --
P: --
Mexico PPI YoY (Nov)--
F: --
P: --
Mexico CPI YoY (Nov)--
F: --
P: --
U.S. Weekly Redbook Index YoY--
F: --
P: --


No matching data
Latest Views
Latest Views
Trending Topics
Top Columnists
Latest Update
White Label
Data API
Web Plug-ins
Affiliate Program
View All

No data
Key points:
Bitcoin sees a repeat bull signal from its MACD indicator, which last came in early April.
Price then climbed 40% in a month, which this time would give BTC a $160,000 target.
US macro data is quickly making traders short-term bullish on Bitcoin.
Bitcoin could reach $160,000 in September as a classic onchain indicator flips bullish.
New findings from popular trader BitBull reveal a key “golden cross” on Bitcoin’s moving average convergence/divergence (MACD) chart.
Bitcoin MACD repeats April golden cross
Bitcoin may perform worse in September than any other month on average, but this year could form a major exception.
MACD, which compares price action across shorter and longer timeframes using two simple moving averages (SMAs), has offered bulls a reason to celebrate.
On Sept. 5, the MACD line, a derivative of the SMAs, crossed above the signal line, which is a 9-period exponential moving average (EMA) of the MACD line used for buy and sell signals.
This has positive implications for short-term price strength, but this latest cross is even more interesting.
“Bitcoin just had a MACD golden cross on the daily timeframe. But this one is a bit different,” BitBull explained this week.
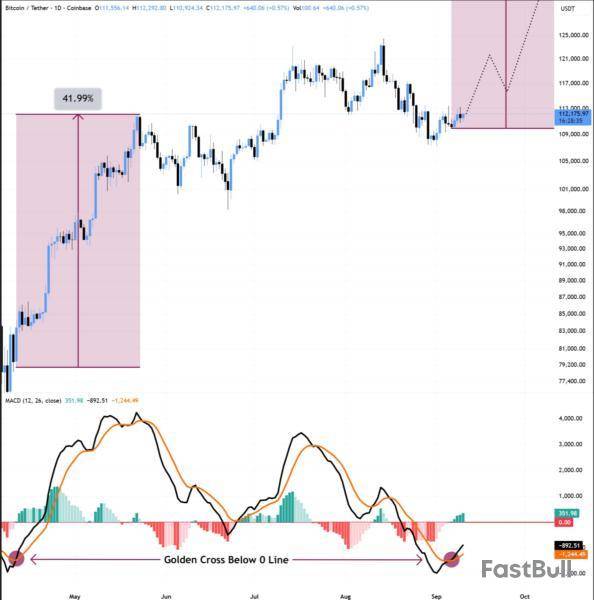
Negative MACD values reflect local downtrends, and the cross provides fresh fuel for a market rebound.
“Last time it happened, BTC rallied 40% in a month and hit a new ATH,” BitBull notes.
If history repeats, would reach $160,000, already a popular price target for a 2025 high.
Inflation data boosts BTC price sentiment
Bullish sentiment continues to flow back into crypto thanks to macroeconomic shifts.
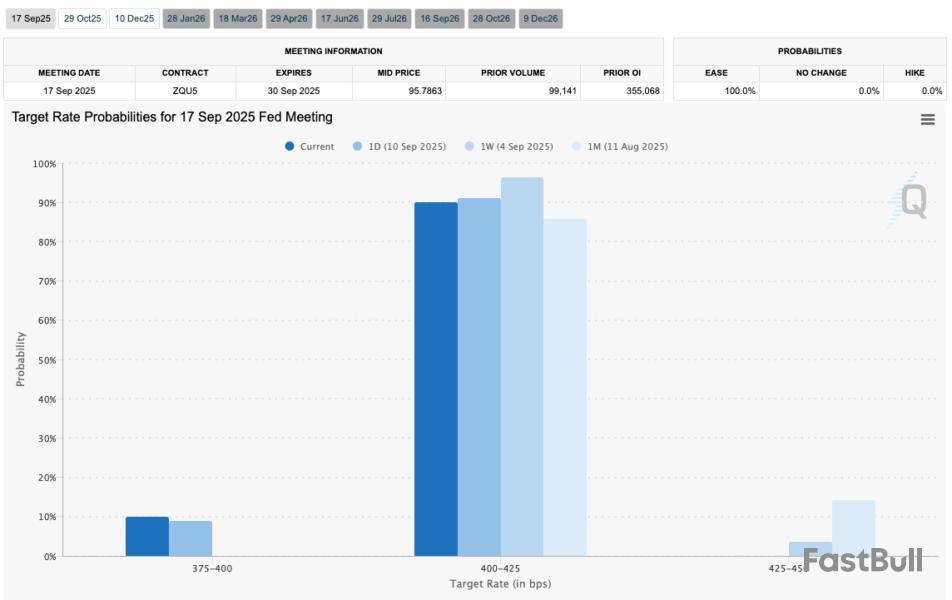
US inflation data has buoyed risk assets and gold, with expectations favoring interest-rate cuts by the Federal Reserve to restart from next week.
The August print of the Consumer Price Index (CPI) is due on Thursday, with traders keen to see a positive result build on BTC price upside.
“If we get a similar print, that'll confirm the rate cut later this month, and markets will react positively,” popular trader Jelle summarized in part of pre-CPI market coverage on X.
This article does not contain investment advice or recommendations. Every investment and trading move involves risk, and readers should conduct their own research when making a decision.
The battle between fallen giants of the crypto world isn’t over!
Three Arrows Capital (3AC) has subpoenaed former FTX executives, accusing them of illegally liquidating more than $1.5 billion in positions during the 2022 market crash. The move drags Sam Bankman-Fried back into the spotlight, but this time from prison.
What’s happening now? Here are all the details.
Sam Bankman-Fried Set to Testify
A court filing shows 3AC’s liquidators want testimony from Bankman-Fried, Caroline Ellison, and Ryan Salame. If approved, Bankman-Fried will be transported from a California prison to testify under oath on October 14, 2025.
It’s another twist in the story connecting two of crypto’s biggest crashes – 3AC in June 2022 and FTX later that year.
Allegations of Forced Liquidation
3AC co-founder Zhu Su claims FTX pushed the hedge fund over the edge by force-liquidating $1.5 billion of its positions “without proper authorization.” He argues this illegal move accelerated 3AC’s collapse.
Sunil (FTX Creditor Champion)@sunil_tradesSep 11, 20253AC have filed a notice to subponea SBF, Ryne Salame, Caroline Ellison
Sam's disposition will occur on 14 Oct 2025@zhusu has said that Sam liquidated $1.5bn of their positions illegally, and
Ryne Salame used inside info to trade against client positions to cash out $1bn pic.twitter.com/LMr2VzMA2l
Ellison, who ran Alameda Research, faces scrutiny over trading practices that may have worsened the situation. Salame, a former FTX executive, is accused of using insider information to front-run trades and profiting more than $1 billion.
FTX Fires Back
The FTX estate has rejected 3AC’s accusations. In June 2025, it argued the hedge fund’s account balance was closer to $284 million, not the $1.6 billion claimed.
“FTX creditors should not be a backstop for 3AC’s failed trades,” the estate wrote in a 94-page objection. According to its filings, most of the money vanished during the market crash itself, not because of unlawful action.
FTX says it only liquidated $82 million, well within its rights under contract terms.
Creditors Still Waiting
While the legal fight heats up, FTX continues repaying creditors. Around $6.2 billion has already been returned since 2022. The next round of cash distributions is scheduled for September 30, 2025, through partners including BitGo, Kraken, and Payoneer.
But not everyone is getting paid. More than 300 Chinese users have challenged the decision to exclude payouts in 49 jurisdictions, calling the restrictions unfair and without legal basis.
Also Read: https://coinpedia.org/news/warning-for-ftx-creditors-phishing-scam-hits-ahead-of-1-9b-payouts/Could You Lose Your FTX Claim? Payouts May Be Blocked in These 49 Regions
Why This Matters
The FTX and 3AC collapses remain two of the biggest failures in crypto history. With subpoenas now targeting top executives, the question of accountability is once again front and center.
October’s deposition of Bankman-Fried could be a turning point for 3AC’s recovery efforts and for how future crypto bankruptcies are handled.
The global economy is flashing warning signs, with traders, analysts, and economists pointing to more trouble ahead.
The calls of a looming recession are growing louder, and the crypto market is showing increased volatility, all while Wall Street braces for Fed rate cuts and further market swings.
Trader Doctor Profit has issued a major warning that the macro economy is in serious danger. Here’s why.
Signs Of Recession
According to the trader, irrespective of whether the recession crash comes in the next few weeks or in Q1–Q2 2026, the Bitcoin target of $90K–$94K remains unchanged.
One of the best indicators to watch, he says, is the yield curve, which compares short-term U.S. bonds with long-term bonds. Normally, long-term bonds pay more, a healthy positive spread. But when short-term bonds pay more, it’s called an inversion, and always signals that trouble is ahead.
The 10Y–2Y curve inverted on July 5, 2022, staying that way for 784 days, the longest in U.S. history. On Aug 27, 2024, the curve flipped back positive. Doctor Profit explains that history shows recessions don’t start during inversion, they come after normalization, as seen in 1990, 2001, 2007, and now in 2024–2025.
The Calm Before the Storm?
This cycle is different because the inversion has lasted much longer than usual.
At the same time, unemployment is creeping up, job growth figures are being revised downward, and the Fed has already begun cutting rates, similar to the setup before the 2001 crash.
Doctor Profit warns that the period from now until the second quarter of 2026 is a high-risk window for a major recession and market crash. The bond market is also sending warning signals, reminding him of the calm before the storm that played out ahead of the 2001 and 2007 crashes.
Doctor Profit predicts Bitcoin’s next move to $90K–$94K. After reaching $90K, two scenarios are possible:
He clarifies that the move toward $90,000 should be viewed as a separate correction and not the start of the recessionary crash itself.
Policy Risks and Inflation Bubbles
Meanwhile, other experts warn that policy mistakes could make economic risks even worse.
Bitcoin critic Peter Schiff criticised Trump’s economic team, arguing that they fail to recognize the difference between real growth and inflation-driven bubbles.
According to Schiff, this blind spot could push the Fed and policymakers to repeat the mistakes that led to the 2008 financial crisis, weakening America’s industrial foundation once again.
On the other side, Morgan Stanley’s Equity Strategist says that the U.S. has been in a slow, hidden recession since 2022, with different sectors struggling at different times. With the Fed cutting rates, a new bull market is forming, though short-term volatility is expected.
Fed Rate Cuts and Market Outlook
After a weak August jobs report, markets expect the Fed to cut rates by 25 basis points, with some hoping for an even bigger move. According to the CME FedWatch Tool, there is a 90% chance of a 25-basis-point rate cut and a 10% chance of a 100-basis-point cut.
While traders hope that rate cuts will boost stocks, some warn that the impact may be limited. The crypto market also often benefits from rate cuts as cheaper borrowing and more liquidity push investors toward riskier assets like Bitcoin.
Real-world asset tokenization platform OpenEden and crypto infrastructure provider BitGo have entered the competition to issue Hyperliquid’s planned native stablecoin, USDH, bringing the number of contenders to eight.
Hyperliquid validators will start voting for the USDH proposal from Thursday and will be able to cast their votes until Sunday. Other suitors include Ethena, Paxos, Frax, Agora, Native Markets and Sky.
The winning bid will decide how it will manage Hyperliquid’s $5.9 billion stablecoin reserve, with 95.56% of it held in USDC (USDC), according to DefiLlama.
OpenEden’s bid for USDH
OpenEden’s founder and CEO Jeremy Ng on Wednesday laid out the platform’s proposal on how it will handle USDH were it to win the bid.
The RWA platform pledged to distribute all the yield it will generate from the USDH reserves to the Hyperliquid ecosystem, which will include buybacks.
It will additionally use the proceeds from minting and redeeming USDH to buy back Hyperliquid’s HYPE token and distribute it to the Hyperliquid validators.
The company has earmarked 3% of its native EDEN token supply to provide additional incentives, which could be boosted in the future.
USDH reserves will be stored in a tokenized US Treasury Bills Fund, whose custody will be under The Bank of New York Mellon.
The company has partnered with The Bank of New York Mellon, Chainlink, AEON Pay and Monarq Asset Management for adoption.
BitGo touts regulatory prowess
Meanwhile, BitGo said it will leverage US dollar-backed liquid assets, bank deposits, short-term treasury bills and more for minting and redeeming USDH.
The company stated that it will use Chainlink’s crosschain interoperability protocol to maintain interoperability between chains.
The yield from the underlying assets will be used to buy and stake HYPE tokens, with the company taking a 0.3% fee of the total reserves.
BitGo touted its regulatory compliance as its major strength, as six of its companies have acquired licenses from Dubai, Singapore, Denmark, New York and a Markets in Crypto-Assets license from Germany.
Native Markets leads the pack
At the time of writing, Native Markets has received the most votes, with 33.73% of the delegate stake selecting its proposal.
Native Markets, co-founded by community member Max Fiege, has proposed splitting the proceeds from the reserves, with half of the proceeds being used to buy back HYPE tokens, while the other half being granted to the Assistance Fund. However, the proposal has received backlash from the community.
Haseeb Qureshi, managing partner at crypto venture fund Dragonfly, has cast doubt regarding Native Markets’ bid.
“Hearing from multiple bidders that none of the validators are interested in considering anyone besides Native Markets. It’s not even a serious discussion, as though there was a backroom deal already done.” Qureshi said.
Nansen CEO Alex Svanevik refuted the claim, saying that they along with their allies, have been engaged with bidders and have encouraged them to put forth their proposal to make the bidding process competitive.
Paxos Labs, which submitted a revised bid on Wednesday, is currently second with a vote share of 11.52%.
However, 46.49% stake remains unassigned, which could drastically change the outcome of who gets to create the USDH token.
A Polymarket poll indicates that market participants are largely expecting Native Markets to win the proposal, with 90% of the poll users voting for it.
Other bidders include Ethena Labs, which submitted its proposal on Tuesday, while Sky, formerly Marker, submitted its proposal on Monday.
On the network side, XRP is showing something that might push it up sooner rather than later: over the past few days, the number of active accounts has increased by almost 30%, reaching over 26,000 unique senders. This spike in activity rekindled user interest and may be a crucial indicator of the asset’s performance going forward. Increased interest in holding and transacting with an asset is frequently reflected in the growth of active accounts.
For XRP, which markets itself as a blockchain that focuses on payments, this metric is essential. Its viability is primarily determined by the volume of transactions and transfer usage. More market participants are transferring money, testing the network or making cross-border payments, as evidenced by a 30% increase in active wallets.
XRP's market performance
In terms of the market, the timing is significant. A descending trendline has been pressed against by XRP’s consolidation around $3.00, which has been above the 50- and 100-day moving averages. Although it has not yet reached the levels observed during July's explosive rally, buying volume has gradually increased again. On the other hand, the rise in network activity provides a basic level of support that might support a technical breakthrough. Chart by TradingView">
When interpreting active accounts as a direct driver of price, one cannot ignore the overall risk surrounding XRP, though. Use of the network does not always correspond to long-term price growth; occasionally, it may even be a reflection of speculative exchanges or transfers. However, the increase in active accounts may work as a tailwind when paired with improving chart structure and market sentiment.
What's next?
It is possible that XRP will push toward $3.40-$3.50 if it is able to overcome its resistance around $3.10. This is especially true if user activity stays high. The downside is that if momentum is not maintained, the $2.78 support level may be retested.
As of right now, the 30% increase in activity shows that XRP is not at all stagnant. Interpret price action as a sign that participation is increasing once more, even though confirmation is still pending. This could pave the way for the subsequent stage in XRP’s market rally.
Bitcoin’s liquidity tug-of-war enters a critical phase on Binance, which happens to be the exchange with the deepest order books.
With BTC’s price already showing strength a little below its all-time high level, the current liquidity battle on Binance may not just be noise – it could be the early signal of the next bullish leg.Binance Flashing a Bull Market Trigger?
CryptoQuant explained that in early August, Binance’s refill_30d indicator, which tracks the 30-day rolling inflows of Bitcoin to the platform, climbed sharply and repeatedly outpaced the drain_30d indicator, which measures withdrawals. This influx of BTC, particularly strong between August 4 and 18, meant that traders were preparing for distribution or hedging as Bitcoin’s price neared $120,000.
But after peaking, inflows declined in the second half of the month, in what appeared to be reduced selling intent and waning momentum. By mid-August, both drain and refill indicators had entered equilibrium, indicating a temporary balance in trader behavior and contributing to a phase of relative price stability.
The change yet again in early September, when the drain_30d indicator surged past 22 million, one of the highest levels seen in recent months, while refills stayed muted. This divergence is important since it points to renewed withdrawals of BTC from Binance, reducing exchange liquidity and potentially tightening supply. When exchange liquidity dries up and demand stays firm, the market can tip into sharp rallies fueled by scarcity.What’s Next For BTC
What’s crucial is that despite these oscillations in liquidity, Bitcoin’s price hasremainedrelatively steady, which can be attributed to the market absorbing both inflows and outflows with minimal disruption.
Looking ahead, the imbalance between rising outflows and weak inflows could tilt the scales. If drains continue to rise while refills remain low, Binance may face a liquidity squeeze that intensifies buying pressure. Such conditions can set up the possibility of an imminent rally.
By Dow Jones Newswires Staff
Global stock markets and U.S. stock futures were mostly in the green again on Thursday after Oracle's surge and an unexpected decline in producer prices powered the S&P 500 and Nasdaq Composite to fresh record closing highs in the prior session. Tech-sector gains and the near-certainty of a rate cut by the Federal Reserve next Wednesday have powered markets higher, with investors now awaiting consumer price data later to provide clues to the pace of rate cuts through end-year. The dollar edged higher, as did Treasury yields.
In Europe, the European Central Bank is expected to leave rates unchanged and provide little steer on its policy outlook.
Write to Barcelona Editors at barcelonaeditors@dowjones.com
White Label
Data API
Web Plug-ins
Poster Maker
Affiliate Program
The risk of loss in trading financial instruments such as stocks, FX, commodities, futures, bonds, ETFs and crypto can be substantial. You may sustain a total loss of the funds that you deposit with your broker. Therefore, you should carefully consider whether such trading is suitable for you in light of your circumstances and financial resources.
No decision to invest should be made without thoroughly conducting due diligence by yourself or consulting with your financial advisors. Our web content might not suit you since we don't know your financial conditions and investment needs. Our financial information might have latency or contain inaccuracy, so you should be fully responsible for any of your trading and investment decisions. The company will not be responsible for your capital loss.
Without getting permission from the website, you are not allowed to copy the website's graphics, texts, or trademarks. Intellectual property rights in the content or data incorporated into this website belong to its providers and exchange merchants.
Not Logged In
Log in to access more features

FastBull Membership
Not yet
Purchase
Log In
Sign Up