• Trade
  • Markets
  • Copy
  • Contests
  • News
  • 24/7
  • Calendar
  • Q&A
  • Chats
Trending
Screeners
SYMBOL
LAST
BID
ASK
HIGH
LOW
NET CHG.
%CHG.
SPREAD
SPX
S&P 500 Index
6846.50
6846.50
6846.50
6878.28
6827.18
-23.90
-0.35%
--
DJI
Dow Jones Industrial Average
47739.31
47739.31
47739.31
47971.51
47611.93
-215.67
-0.45%
--
IXIC
NASDAQ Composite Index
23545.89
23545.89
23545.89
23698.93
23455.05
-32.22
-0.14%
--
USDX
US Dollar Index
99.000
99.080
99.000
99.000
99.000
+0.050
+ 0.05%
--
EURUSD
Euro / US Dollar
1.16356
1.16386
1.16356
1.16365
1.16322
-0.00008
-0.01%
--
GBPUSD
Pound Sterling / US Dollar
1.33213
1.33264
1.33213
1.33213
1.33140
+0.00008
+ 0.01%
--
XAUUSD
Gold / US Dollar
4189.70
4190.14
4189.70
4218.85
4175.92
-8.21
-0.20%
--
WTI
Light Sweet Crude Oil
58.555
58.807
58.555
60.084
58.495
-1.254
-2.10%
--

Community Accounts

Signal Accounts
--
Profit Accounts
--
Loss Accounts
--
View More

Become a signal provider

Sell trading signals to earn additional income

View More

Guide to Copy Trading

Get started with ease and confidence

View More

Signal Accounts for Members

All Signal Accounts

Best Return
  • Best Return
  • Best P/L
  • Best MDD
Past 1W
  • Past 1W
  • Past 1M
  • Past 1Y

All Contests

  • All
  • Trump Updates
  • Recommend
  • Stocks
  • Cryptocurrencies
  • Central Banks
  • Featured News
Top News Only
Share

SPDR Gold Holdings Down 0.11%, Or 1.14 Tonnes

Share

On Monday (December 8), In Late New York Trading, S&P 500 Futures Fell 0.21%, Dow Jones Futures Fell 0.43%, NASDAQ 100 Futures Fell 0.08%, And Russell 2000 Futures Fell 0.04%

Share

Morgan Stanley: Data Center ABS Spreads Are Expected To Widen In 2026

Share

(US Stocks) The Philadelphia Gold And Silver Index Closed Down 2.34% At 311.01 Points. (Global Session) The NYSE Arca Gold Miners Index Closed Down 2.17%, Hitting A Daily Low Of 2235.45 Points; US Stocks Remained Slightly Down Before The Opening Bell—holding Steady Around 2280 Points—before Briefly Rising Slightly

Share

IMF: IMF Executive Board Approves Extension Of The Extended Credit Facility Arrangement With Nepal

Share

Trump: Same Approach Will Apply To Amd, Intel, And Other Great American Companies

Share

Trump: Department Of Commerce Is Finalizing Details

Share

Trump: $25% Will Be Paid To United States Of America

Share

Trump: President Xi Responded Positively

Share

[Consumer Discretionary ETFs Fell Over 1.4%, Leading The Decline Among US Sector ETFs; Semiconductor ETFs Rose Over 1.1%] On Monday (December 8), The Consumer Discretionary ETF Fell 1.45%, The Energy ETF Fell 1.09%, The Internet ETF Fell 0.18%, The Regional Banks ETF Rose 0.34%, The Technology ETF Rose 0.70%, The Global Technology ETF Rose 0.93%, And The Semiconductor ETF Rose 1.13%

Share

Trump: I Have Informed President Xi, Of China, That United States Will Allow Nvidia To Ship Its H200 Products To Approved Customers In China

Share

Argentina's Merval Index Closed Up 0.02% At 3.047 Million Points. It Rose To A New Daily High Of 3.165 Million Points In Early Trading In Buenos Aires Before Gradually Giving Back Its Gains

Share

US Stock Market Closing Report | On Monday (December 8), The Magnificent 7 Index Fell 0.20% To 208.33 Points. The "mega-cap" Tech Stock Index Fell 0.33% To 405.00 Points

Share

Pentagon - USA State Dept Approves Potential Sale Of Hellfire Missiles To Belgium For An Estimated $79 Million

Share

Toronto Stock Index .GSPTSE Unofficially Closes Down 141.44 Points, Or 0.45 Percent, At 31169.97

Share

The Nasdaq Golden Dragon China Index Closed Up Less Than 0.1%. Nxtt Rose 21%, Microalgo Rose 7%, Daqo New Energy Rose 4.3%, And 21Vianet, Baidu, And Miniso All Rose More Than 3%

Share

The S&P 500 Initially Closed Down More Than 0.4%, With The Telecom Sector Down 1.9%, And Materials, Consumer Discretionary, Utilities, Healthcare, And Energy Sectors Down By As Much As 1.6%, While The Technology Sector Rose 0.7%. The NASDAQ 100 Initially Closed Down 0.3%, With Marvell Technology Down 7%, Fortinet Down 4%, And Netflix And Tesla Down 3.4%

Share

IMF: Review Pakistan Authorities To Draw The Equivalent Of About US$1 Billion

Share

President Trump Is Committed To The Continued Cessation Of Violence And Expects The Governments Of Cambodia And Thailand To Fully Honor Their Commitments To End This Conflict - Senior White House Official

Share

[Water Overflows From Spent Fuel Pool At Japanese Nuclear Facility] According To Japan's Nuclear Waste Management Company, Following A Strong Earthquake Off The Coast Of Aomori Prefecture Late On December 8th, Workers At The Nuclear Waste Treatment Plant In Rokkasho Village, Aomori Prefecture, Discovered "at Least 100 Liters Of Water" On The Ground Around The Spent Fuel Pool During An Inspection. Analysis Suggests This Water "may Have Overflowed Due To The Earthquake's Shaking." However, It Is Reported That The Overflowed Water "remains Inside The Building And Has Not Affected The External Environment."

TIME
ACT
FCST
PREV
France Trade Balance (SA) (Oct)

A:--

F: --

P: --
Euro Zone Employment YoY (SA) (Q3)

A:--

F: --

P: --
Canada Part-Time Employment (SA) (Nov)

A:--

F: --

P: --

Canada Unemployment Rate (SA) (Nov)

A:--

F: --

P: --

Canada Full-time Employment (SA) (Nov)

A:--

F: --

P: --

Canada Labor Force Participation Rate (SA) (Nov)

A:--

F: --

P: --

Canada Employment (SA) (Nov)

A:--

F: --

P: --

U.S. PCE Price Index MoM (Sept)

A:--

F: --

P: --

U.S. Personal Income MoM (Sept)

A:--

F: --

P: --

U.S. Core PCE Price Index MoM (Sept)

A:--

F: --

P: --

U.S. PCE Price Index YoY (SA) (Sept)

A:--

F: --

P: --

U.S. Core PCE Price Index YoY (Sept)

A:--

F: --

P: --

U.S. Personal Outlays MoM (SA) (Sept)

A:--

F: --

P: --
U.S. 5-10 Year-Ahead Inflation Expectations (Dec)

A:--

F: --

P: --

U.S. Real Personal Consumption Expenditures MoM (Sept)

A:--

F: --

P: --
U.S. Weekly Total Rig Count

A:--

F: --

P: --

U.S. Weekly Total Oil Rig Count

A:--

F: --

P: --

U.S. Consumer Credit (SA) (Oct)

A:--

F: --

P: --
China, Mainland Foreign Exchange Reserves (Nov)

A:--

F: --

P: --

Japan Trade Balance (Oct)

A:--

F: --

P: --

Japan Nominal GDP Revised QoQ (Q3)

A:--

F: --

P: --

China, Mainland Imports YoY (CNH) (Nov)

A:--

F: --

P: --

China, Mainland Exports (Nov)

A:--

F: --

P: --

China, Mainland Imports (CNH) (Nov)

A:--

F: --

P: --

China, Mainland Trade Balance (CNH) (Nov)

A:--

F: --

P: --

China, Mainland Exports YoY (USD) (Nov)

A:--

F: --

P: --

China, Mainland Imports YoY (USD) (Nov)

A:--

F: --

P: --

Germany Industrial Output MoM (SA) (Oct)

A:--

F: --

P: --
Euro Zone Sentix Investor Confidence Index (Dec)

A:--

F: --

P: --

Canada National Economic Confidence Index

A:--

F: --

P: --

U.K. BRC Like-For-Like Retail Sales YoY (Nov)

--

F: --

P: --

U.K. BRC Overall Retail Sales YoY (Nov)

--

F: --

P: --

Australia Overnight (Borrowing) Key Rate

--

F: --

P: --

RBA Rate Statement
RBA Press Conference
Germany Exports MoM (SA) (Oct)

--

F: --

P: --

U.S. NFIB Small Business Optimism Index (SA) (Nov)

--

F: --

P: --

Mexico 12-Month Inflation (CPI) (Nov)

--

F: --

P: --

Mexico Core CPI YoY (Nov)

--

F: --

P: --

Mexico PPI YoY (Nov)

--

F: --

P: --

U.S. Weekly Redbook Index YoY

--

F: --

P: --

U.S. JOLTS Job Openings (SA) (Oct)

--

F: --

P: --

China, Mainland M1 Money Supply YoY (Nov)

--

F: --

P: --

China, Mainland M0 Money Supply YoY (Nov)

--

F: --

P: --

China, Mainland M2 Money Supply YoY (Nov)

--

F: --

P: --

U.S. EIA Short-Term Crude Production Forecast For The Year (Dec)

--

F: --

P: --

U.S. EIA Natural Gas Production Forecast For The Next Year (Dec)

--

F: --

P: --

U.S. EIA Short-Term Crude Production Forecast For The Next Year (Dec)

--

F: --

P: --

EIA Monthly Short-Term Energy Outlook
U.S. API Weekly Gasoline Stocks

--

F: --

P: --

U.S. API Weekly Cushing Crude Oil Stocks

--

F: --

P: --

U.S. API Weekly Crude Oil Stocks

--

F: --

P: --

U.S. API Weekly Refined Oil Stocks

--

F: --

P: --

South Korea Unemployment Rate (SA) (Nov)

--

F: --

P: --

Japan Reuters Tankan Non-Manufacturers Index (Dec)

--

F: --

P: --

Japan Reuters Tankan Manufacturers Index (Dec)

--

F: --

P: --

Japan Domestic Enterprise Commodity Price Index MoM (Nov)

--

F: --

P: --

Japan Domestic Enterprise Commodity Price Index YoY (Nov)

--

F: --

P: --

China, Mainland PPI YoY (Nov)

--

F: --

P: --

China, Mainland CPI MoM (Nov)

--

F: --

P: --

Italy Industrial Output YoY (SA) (Oct)

--

F: --

P: --

Q&A with Experts
    • All
    • Chatrooms
    • Groups
    • Friends
    Connecting
    .
    .
    .
    Type here...
    Add Symbol or Code

      No matching data

      All
      Trump Updates
      Recommend
      Stocks
      Cryptocurrencies
      Central Banks
      Featured News
      • All
      • Russia-Ukraine Conflict
      • Middle East Flashpoint
      • All
      • Russia-Ukraine Conflict
      • Middle East Flashpoint
      Search
      Products

      Charts Free Forever

      Chats Q&A with Experts
      Screeners Economic Calendar Data Tools
      Membership Features
      Data Warehouse Market Trends Institutional Data Policy Rates Macro

      Market Trends

      Market Sentiment Order Book Forex Correlations

      Top Indicators

      Charts Free Forever
      Markets

      News

      News Analysis 24/7 Columns Education
      From Institutions From Analysts
      Topics Columnists

      Latest Views

      Latest Views

      Trending Topics

      Top Columnists

      Latest Update

      Signals

      Copy Rankings Latest Signals Become a signal provider AI Rating
      Contests
      Brokers

      Overview Brokers Assessment Rankings Regulators News Claims
      Broker listing Forex Brokers Comparison Tool Live Spread Comparison Scam
      Q&A Complaint Scam Alert Videos Tips to Detect Scam
      More

      Business
      Events
      Careers About Us Advertising Help Center

      White Label

      Data API

      Web Plug-ins

      Affiliate Program

      Awards Institution Evaluation IB Seminar Salon Event Exhibition
      Vietnam Thailand Singapore Dubai
      Fans Party Investment Sharing Session
      FastBull Summit BrokersView Expo
      Recent Searches
        Top Searches
          Markets
          News
          Analysis
          User
          24/7
          Economic Calendar
          Education
          Data
          • Names
          • Latest
          • Prev

          View All

          No data

          Scan to Download

          Faster Charts, Chat Faster!

          Download App
          English
          • English
          • Español
          • العربية
          • Bahasa Indonesia
          • Bahasa Melayu
          • Tiếng Việt
          • ภาษาไทย
          • Français
          • Italiano
          • Türkçe
          • Русский язык
          • 简中
          • 繁中
          Open Account
          Search
          Products
          Charts Free Forever
          Markets
          News
          Signals

          Copy Rankings Latest Signals Become a signal provider AI Rating
          Contests
          Brokers

          Overview Brokers Assessment Rankings Regulators News Claims
          Broker listing Forex Brokers Comparison Tool Live Spread Comparison Scam
          Q&A Complaint Scam Alert Videos Tips to Detect Scam
          More

          Business
          Events
          Careers About Us Advertising Help Center

          White Label

          Data API

          Web Plug-ins

          Affiliate Program

          Awards Institution Evaluation IB Seminar Salon Event Exhibition
          Vietnam Thailand Singapore Dubai
          Fans Party Investment Sharing Session
          FastBull Summit BrokersView Expo

          Bitcoin Perpetual Swaps Signal Short Bias Amid Price Rebound – Details

          NewsBTC
          Dogecoin / Tether
          +0.62%
          1inch / Tether
          -0.22%
          AAVE / Tether
          -0.19%
          Acala / Tether
          -0.69%
          Fusionist / Tether
          +0.50%

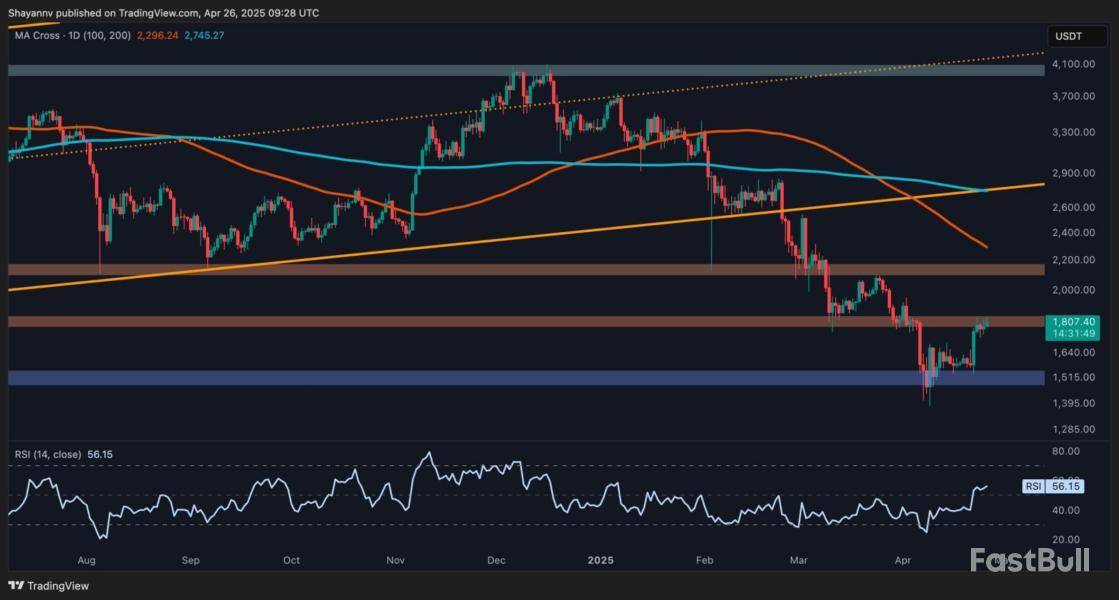
          The Bitcoin market saw another rebound in the past week as prices leaped by over 12% to hit a local peak of $95,600. Amid the ongoing market euphoria, prominent blockchain analytics company Glassnode has shared some important developments in the Bitcoin derivative markets.

          Bitcoin Short Bets Rise Despite Price Rally, Setting Stage For Volatility

          Despite a bullish trading week, derivative traders are approaching the Bitcoin market with skepticism, as evidenced by a build-up of leveraged short positions.

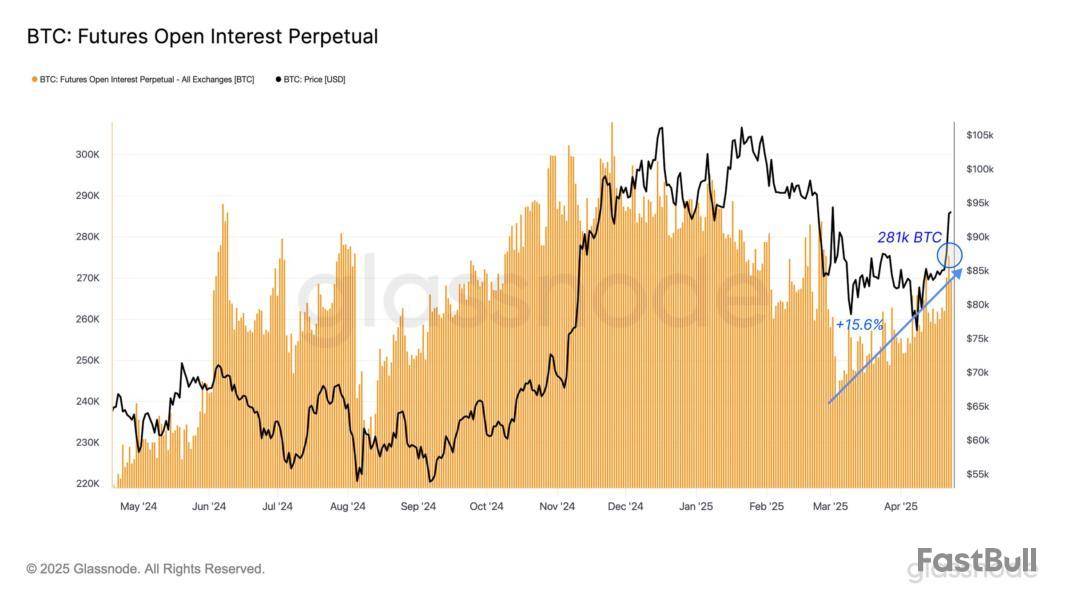
          In a recent X post on April 25, Glassnode reported that Open Interest (OI) in Bitcoin perpetual swaps climbed to 218,000 BTC, marking a 15.6% increase from early March. In line with market activity, this rise in Open Interest aligns with increased leverage, introducing the potential for market volatility via liquidations or stop-outs.

          Bitcoin

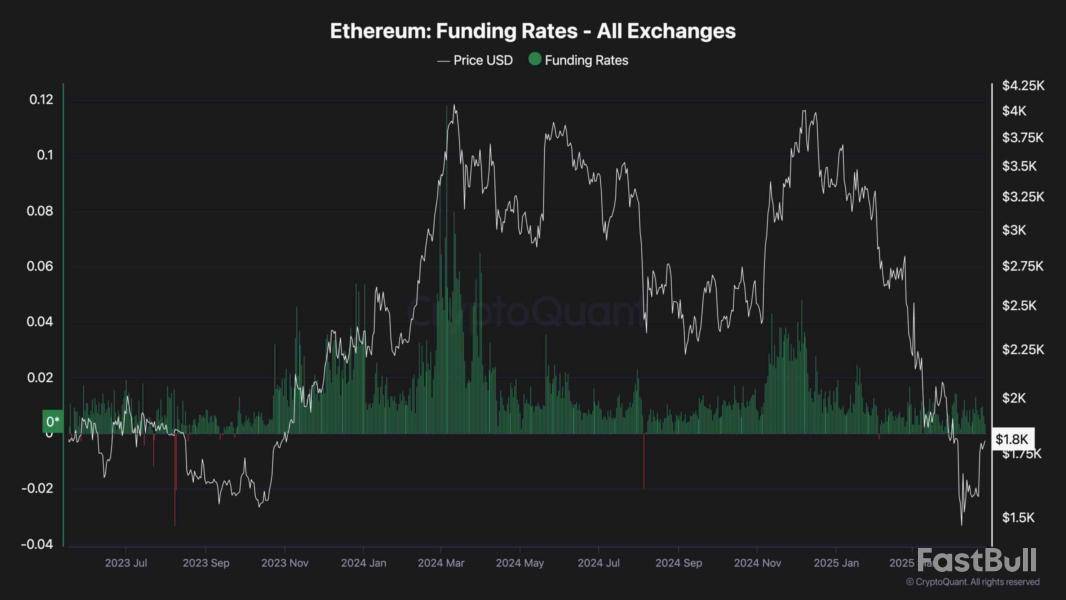
          Generally, a rise in Open Interest amidst a price rally is expected to signal long-term market confidence. However, Glassnode’s findings have revealed an opposite scenario. Despite Bitcoin’s bullish strides in the past week, short market positions appear to be dominating the perpetual futures markets.This concerning development is indicated by a decline in the average funding rate, which has now slipped into negative territory to sit around -0.023%. The perpetual funding rate is a periodic payment between long and short traders aimed at keeping the contract price in line with the underlying spot price.

          A negative funding rate indicates short traders pay long traders as Bitcoin’s perpetual contract price is trading below the spot price. This is caused by a higher number of short positions as traders are largely bearish about Bitcoin, even despite recent gains.

          Furthermore, the 7-day moving average (7DMA) of long-side funding premiums has dropped to $88,000 per hour, reinforcing this short-dominant sentiment. This downtrend indicates a waning demand for long positions, as traders exhibit a short bias.

          However, Glassnode presents a bullish note stating that the present combination of rising leverage and short positions paves the way for a potential short squeeze, where an unexpected upward price move forces short-sellers to close their positions, thereby driving prices even higher.

          Bitcoin Price Overview

          At the time of writing, Bitcoin trades at $94,629 following a 1.01% retracement from its local peak price on April 25. Despite creeping developments in the perpetual futures market, the BTC market remains highly bullish, indicated by gains of 1.02%, 11.12%, and 8.32% in the last one, seven, and thirty days, respectively. With a market cap of $1.88 trillion, the premier cryptocurrency ranks as the largest digital asset and fifth-largest asset in the world.

          Related Reading: Ethereum To Hit $5k Before Its 10th Birthday, Justin Sun Says

          Risk Warnings and Disclaimers
          You understand and acknowledge that there is a high degree of risk involved in trading. Following any strategies or investment methods may lead to potential losses. The content on the site is provided by our contributors and analysts for information purposes only. You are solely responsible for determining whether any trading assets, securities, strategy, or any other product is suitable for investing based on your own investment objectives and financial situation.
          Add to Favorites
          Share

          Arbitrum says it pulled out of accelerator program after Nvidia refused crypto association

          The Block
          Dogecoin / Tether
          +0.62%
          1inch / Tether
          -0.22%
          AAVE / Tether
          -0.19%
          Acala / Tether
          -0.69%
          Fusionist / Tether
          +0.50%

          The Arbitrum Foundation, the muscle behind the Ethereum Layer 2 blockchain network by the same name, said it withdrew from an Nvidia-backed accelerator program after the latter company, the world's largest chipmaker, said it didn't want to be mentioned in any public announcements. 

          Earlier reporting indicated that Nvidia pulled the plug on the arrangement, which would've seen Arbitrum become the exclusive Ethereum partner for the Nvidia- and Tribe-backed Ignition AI Accelerator program. The program would have provided the network with AI development guidance and cloud credits. 

          However, the Arbitrum Foundation said, Nvidia changed its tune in recent weeks, saying it was willing to partner with Arbitrum, as long as the chipmaker wasn't mentioned in any public-facing crypto-related announcements. 

          "Arbitrum was not removed from the AI Ignition Accelerator — the team made the decision to disengage after Nvidia asked to remove its brand from crypto-related announcements, signaling a lack of long-term commitment," a Foundation spokesperson told The Block. 

          The Ignition Accelerator said in a statement that an embargoed press release provided to CoinDesk, which reported that Nvidia "still explicitly exclude[s] crypto-related projects," had incorrect information. "Arbitrum Foundation has kindly requested to pull out from this partnership with the Ignition AI Accelerator," the statement reads. 

          Other crypto firms have inked partnerships with the Ignition AI accelerator, such as the Aptos Foundation, which supports the Layer 1 Aptos blockchain. 

          "Ultimately, disengaging from participating in the AI Ignition Accelerator was a sound business decision for The Arbitrum Foundation, as it is committed to collaborating with partners who are positioned to support the acceleration of blockchain innovation," the Foundation said. 

          Arbitrum is up about 1.8% in price over the past 24 hours, according to The Block's ARB Price page. Nvidia didn't immediately respond to a request for comment. 

          Disclaimer: The Block is an independent media outlet that delivers news, research, and data. As of November 2023, Foresight Ventures is a majority investor of The Block. Foresight Ventures invests in other companies in the crypto space. Crypto exchange Bitget is an anchor LP for Foresight Ventures. The Block continues to operate independently to deliver objective, impactful, and timely information about the crypto industry. Here are our current financial disclosures.

          © 2025 The Block. All Rights Reserved. This article is provided for informational purposes only. It is not offered or intended to be used as legal, tax, investment, financial, or other advice.

          Risk Warnings and Disclaimers
          You understand and acknowledge that there is a high degree of risk involved in trading. Following any strategies or investment methods may lead to potential losses. The content on the site is provided by our contributors and analysts for information purposes only. You are solely responsible for determining whether any trading assets, securities, strategy, or any other product is suitable for investing based on your own investment objectives and financial situation.
          Add to Favorites
          Share

          Solana's Loopscale pauses lending after $5.8M hack

          Cointelegraph
          Dogecoin / Tether
          +0.62%
          1inch / Tether
          -0.22%
          AAVE / Tether
          -0.19%
          Acala / Tether
          -0.69%
          Fusionist / Tether
          +0.50%

          Solana decentralized finance (DeFi) protocol Loopscale has temporarily halted its lending markets after suffering an approximately $5.8 million exploit.

          On April 26, a hacker siphoned approximately 5.7 million USDC and 1200 Solana from the lending protocol after taking out a “series of undercollateralized loans”, Loopscale co-founder Mary Gooneratne said in an X post.

          The exploit only impacted Loopscale’s USDC and SOL vaults and the losses represent around 12% of Loopscale’s total value locked (TVL), Gooneratne added.

          Loopscale is “working to resume repayment functionality as soon as possible to mitigate unforeseen liquidations,” its said in an X post.

          “Our team is fully mobilized to investigate, recover funds, and ensure users are protected,” Gooneratne said.

          In the first quarter of 2025, hackers stole more than $1.6 billion worth of crypto from exchanges and on-chain smart contracts, blockchain security firm PeckShield said in an April report.

          More than 90% of those losses are attributable to a $1.5 billion attack on ByBit, a centralized cryptocurrency exchange, by North Korean hacking outfit Lazarus Group.

          Unique DeFi lending model

          Launched on April 10 after a six-month closed beta, Loopscale is a DeFi lending protocol designed to enhance capital efficiency by directly matching lenders and borrowers.

          It also supports specialized lending markets, such as “structured credit, receivables financing, and undercollateralized lending,” Loopscale said in an April announcement shared with Cointelegraph.

          Loopscale’s order book model distinguishes it from DeFi lending peers such as Aave that aggregate cryptocurrency deposits into liquidity pools.

          Loopscale’s main USDC and SOL vaults yield APRs exceeding 5% and 10%, respectively. It also supports lending markets for tokens such as JitoSOL and BONK (BONK) and looping strategies for upwards of 40 different token pairs.

          The DeFi protocol has approximately $40 million in TVL and has attracted upwards of 7,000 lenders, according to researcher OurNetwork.

          Risk Warnings and Disclaimers
          You understand and acknowledge that there is a high degree of risk involved in trading. Following any strategies or investment methods may lead to potential losses. The content on the site is provided by our contributors and analysts for information purposes only. You are solely responsible for determining whether any trading assets, securities, strategy, or any other product is suitable for investing based on your own investment objectives and financial situation.
          Add to Favorites
          Share

          $500,000,000 in Bitcoin Through Coinbase — What's Happening?

          U.Today
          Dogecoin / Tether
          +0.62%
          1inch / Tether
          -0.22%
          AAVE / Tether
          -0.19%
          Acala / Tether
          -0.69%
          Fusionist / Tether
          +0.50%

          According to recently shared data by CryptoQuant, the biggest cryptocurrency trading platform in the U.S. jurisdiction, Coinbase, has been stunned with a cumulative withdrawal worth roughly half a billion dollars.

          An analyst of the aforementioned on-chain data company shared his take on what this withdrawal could mean for the crypto market.

          $500 million in Bitcoin on move

          CryptoQuant has noticed that the U.S. largest cryptocurrency exchange by trading volume, Coinbase, has seen cumulative withdrawals of more than 7,000 Bitcoins. This happened on April 25, according to the chart. This amount of crypto is worth approximately $500,000,000.

          CryptoQuant.com
          @cryptoquant_com

          Over 7,000 Bitcoin withdrawn from Coinbase

          “Over $500 million worth of BTC was moved out of exchanges, suggesting whales are withdrawing Bitcoin for long-term holding or off-platform use (e.g., DeFi, cold storage).” – By Amr Taha

          Link ⤵️https://t.co/lpgH7Bwwu2 pic.twitter.com/DdVLGA6JYK

          Apr 26, 2025

          On April 22, the amount of withdrawals came very close to $1.5 billion worth of Bitcoin. While the chart just shows withdrawals and deposits to exchanges, the CryptoQuant analyst Amr Taha names only Coinbase as the platform that suffered the mammoth withdrawals of BTC.

          The analyst explains these gargantuan withdrawals by several possibilities, but all of them come down to one thing — accumulation. It could be financial institutions scooping up Bitcoin, especially since institutions in the U.S. primarily prefer to use Coinbase. “Such large outflows often indicate long-term holding intentions,” the analyst stresses.

          Besides, these purchases could be related to spot Bitcoin ETFs and indicate “significant underlying demand.” Potentially, Amr Taha says, this could be signaling bullish investor sentiment.

          Bitcoin ETFs welcome $477.93 million in daily netflows

          Meanwhile, spot Bitcoin exchange-traded funds continue to score large inflows. According to a recent tweet published by analytics account @lookonchain, on Friday, April 25, ETFs witnessed impressive total inflows of $477.93 million.

          Lookonchain
          @lookonchain

          Apr 25 Update:

          10 #Bitcoin ETFs

          NetFlow: +5,037 $BTC(+$477.93M)🟢#iShares(Blackrock) inflows 3,500 $BTC($332.07M) and currently holds 586,164 $BTC($55.62B).

          9 #Ethereum ETFs

          NetFlow: +31,199 $ETH(+$55.5M)🟢#iShares(Blackrock) inflows 22,704 $ETH($40.39M) and currently holds… pic.twitter.com/MBsZZNo9rC

          Apr 25, 2025

          The largest one was registered by BlackRock giant. It inhaled 3,500 Bitcoins worth $332.07 million in fiat. Over the past week, it has drawn in 12,977 BTC valued at $1,224,183,088.9. This wealth management behemoth now holds a total of 586,164 Bitcoins worth $55.62 billion.

          The second biggest inflows were recorded by 21 ArkShares, which scooped up 1,037 BTC ($97,800,579) on Friday and 6,665 BTC over the past week — $628,583,281.5. Grayscale Mini Bitcoin Trust bought 319 BTC, while Bitwise got itself 109 BTC.

          These inflows came on Friday, when Bitcoin surpassed $95,000 and came really close to breaching the $96,000 price level.

          Risk Warnings and Disclaimers
          You understand and acknowledge that there is a high degree of risk involved in trading. Following any strategies or investment methods may lead to potential losses. The content on the site is provided by our contributors and analysts for information purposes only. You are solely responsible for determining whether any trading assets, securities, strategy, or any other product is suitable for investing based on your own investment objectives and financial situation.
          Add to Favorites
          Share

          Ethereum Flips Key Resistance Into Support – Can Bulls Reclaim $2,000 Level?

          NewsBTC
          Dogecoin / Tether
          +0.62%
          1inch / Tether
          -0.22%
          AAVE / Tether
          -0.19%
          Acala / Tether
          -0.69%
          Fusionist / Tether
          +0.50%

          Ethereum is now holding above critical support levels after a volatile few weeks, but it continues to struggle with reclaiming key resistance zones. Bulls have managed to regain some momentum, helping ETH stabilize above the $1,700 level. However, to confirm a true bullish structure and shift sentiment decisively, Ethereum must reclaim and hold higher ground in the coming days.

          Top analyst Daan shared a technical setup highlighting a promising development: Ethereum is flipping a previous horizontal level back into support. According to Daan, this marks a meaningful change in ETH’s market dynamics, as it’s something the asset has failed to do for months. Instead of consistently rejecting resistance and making lower lows, ETH is now showing early signs of strength by defending critical zones.

          Still, the battle isn’t over. Global macro uncertainty and tensions between the US and China continue to pressure all risk assets, including crypto. For Ethereum, a daily close above key resistance could open the door to a more decisive move higher, while failure to do so could leave it vulnerable to another round of consolidation or downside.

          Ethereum Faces A Critical Test After Strong Recovery

          Ethereum has staged an impressive recovery, gaining over 32% from its local low of $1,383. Now trading firmly above $1,700, ETH faces a crucial test: holding current levels to shift its longer-term bearish price structure into a more bullish trend. After months of relentless selling pressure, this stabilization could mark the start of a larger reversal if momentum is sustained.

          However, broader macroeconomic risks still loom. The ongoing conflict between the US and China continues to pressure financial markets, with growing concerns that a prolonged negotiation process could disrupt global supply chains. If no resolution is reached in the coming weeks, risk assets like Ethereum could struggle to maintain their recent gains. A breakthrough deal, however, could quickly shift investor appetite back toward risk-on assets, fueling a stronger rally.

          Daan’s technical analysis highlights a major shift in ETH’s behavior. For the first time in months, Ethereum is flipping a previous horizontal resistance zone back into support—a sign of strengthening market dynamics. Daan suggests closely monitoring the $1,750–$2,100 range, as a firm hold above this area would signal a significant improvement in ETH’s structure.

          Ethereum testing critical support level | Source: Daan on X

          A daily close above $1,750 and gradual consolidation within this key range would position Ethereum for a potential breakout toward higher levels in the coming months.

          ETH Price Holds Above Key Support, But Challenges Remain

          Ethereum is currently trading at $1,790, maintaining its position above the critical 4-hour 200 EMA. This technical level has acted as strong support in recent days, providing bulls with a foundation to build momentum. Holding above $1,700 is crucial to maintain the bullish structure that has started to form after weeks of volatility and selling pressure.

          ETH holding above the 4-hour 200 MA & EMA | Source: ETHUSDT chart on TradingView

          To confirm a strong recovery and shift into a sustained uptrend, ETH must reclaim the $2,000 psychological level. A decisive break and hold above $2,000 would likely attract renewed buying interest and could open the door for a move toward higher resistance zones. However, without a strong catalyst, bulls could struggle to maintain upward pressure in the short term.

          On the downside, losing the $1,700 support would signal growing weakness and likely invite further selling. A break below this zone could send Ethereum back into the $1,500 region, reigniting concerns of a prolonged consolidation or deeper correction. For now, the market remains cautiously optimistic, but all eyes are on whether bulls can build enough momentum to reclaim higher ground soon.

          Featured image from Dall-E, chart from TradingView

          Risk Warnings and Disclaimers
          You understand and acknowledge that there is a high degree of risk involved in trading. Following any strategies or investment methods may lead to potential losses. The content on the site is provided by our contributors and analysts for information purposes only. You are solely responsible for determining whether any trading assets, securities, strategy, or any other product is suitable for investing based on your own investment objectives and financial situation.
          Add to Favorites
          Share

          Ethereum Price Analysis: What’s Next for ETH After Surge to $1.8K Resistance?

          CryptoPotato
          Dogecoin / Tether
          +0.62%
          1inch / Tether
          -0.22%
          AAVE / Tether
          -0.19%
          Acala / Tether
          -0.69%
          Fusionist / Tether
          +0.50%

          Ethereum faced a notable increase in buying pressure, leading to a bullish rebound at the crucial $1.5K support. The price faces a decisive resistance range at $1.8K, expected to enter a short-term consolidation before breaking above it.Technical Analysis

          By ShayanThe Daily Chart

          After a period of muted price action and market inactivity around the decisive $1.5K long-term support region, Ethereum eventually experienced a surge in buying pressure, triggering a bullish rebound. This wave of demand has pushed the price toward the significant $1.8K resistance zone. This area coincides with an important order block, where smart money typically places orders, reinforcing its significance.

          The price action at this level is critical; a successful breakout above $1.8K would likely confirm a bullish reversal scenario, opening the path toward the $2.1K target. However, short-term consolidation around this resistance is probable before a decisive move unfolds.

          The 4-Hour Chart

          On the lower timeframe, ETH’s previous tight-range consolidation was broken by a notable influx of buyers, resulting in an impulsive breakout above the descending channel. This breakout was accompanied by strong bullish momentum, driving the price toward the key $1.8K resistance zone.

          This region aligns with Ethereum’s prior swing lows, making it a robust supply area. As a result, short-term consolidation is expected at this level until demand or supply pressure determines the next move. A bullish breakout above $1.8K would set the $2.1K range as the next likely target for buyers.

          Sentiment Analysis

          By Shayan

          The funding rates metric is a crucial indicator of sentiment in the futures markets. Analysing its recent behaviour provides important insights into Ethereum’s latest surge. Typically, healthy and sustainable bullish trends are accompanied by rising funding rates, signalling an influx of buyers in both the perpetual futures and spot markets.

          Currently, however, funding rates are consolidating and showing no significant increase. This suggests that Ethereum’s recent price surge has primarily been driven by spot market buying rather than futures market speculation. For this bullish trend to be validated and gain persistence, the funding rates metric needs to start rising, reflecting growing confidence and aggressive buying in the futures market as well.

          Risk Warnings and Disclaimers
          You understand and acknowledge that there is a high degree of risk involved in trading. Following any strategies or investment methods may lead to potential losses. The content on the site is provided by our contributors and analysts for information purposes only. You are solely responsible for determining whether any trading assets, securities, strategy, or any other product is suitable for investing based on your own investment objectives and financial situation.
          Add to Favorites
          Share

          Bitcoin Price Confirms Breakout To $106,000 As Technicals Align

          NewsBTC
          Dogecoin / Tether
          +0.62%
          1inch / Tether
          -0.22%
          AAVE / Tether
          -0.19%
          Acala / Tether
          -0.69%
          Fusionist / Tether
          +0.50%

          Crypto analyst Daniel has revealed that the Bitcoin price has confirmed its imminent breakout to $106,000. He explained how the technicals and fundamentals support this bullish prediction and currently align for this BTC rally to the $106,000 target.

          Analyst Predicts Bitcoin Price Breakout To $106,000

          In a TradingView post, Daniel stated that the Bitcoin price now appears poised to reach the next significant resistance zone around $106,000, which also aligns with a big resistance level. The analyst noted that the market is now following through with a solid bullish impulse, pushing past intermediate resistance and confirming the continuation of the ascending channel structure. 

          He further remarked that the Bitcoin price could reach this $106,000 target with buyers stepping in aggressively and the price respecting the bullish market structure. The flagship crypto has already displayed strong bullish momentum, having broken above $90,000 earlier this week and rallying to $95,000 for the first time in two months. 

          Daniel noted that this breakout occurred after a well-defined double bottom formed around the major support zone near $74,000. He added that the inability to create a new low and the sharp rejection from that zone confirmed strong buyer presence and marked a clear exhaustion of sellers. 

          Fundamentals Also Support This BTC Rally

          Daniel also explained that the fundamentals support this Bitcoin price rally to $106,000. He remarked that BTC is gaining strength due to several key macroeconomic shifts. These macro shifts include Donald Trump’s tariffs, which have brought about market uncertainty and led investors to seek alternatives outside the stock and bond markets. 

          The analyst highlighted the fact that the Bitcoin price has thrived during such periods of instability, with investors viewing it as a hedge against the dollar’s instability. He added that global central banks continue tightening monetary policy, increasing fears of a recession. With inflation and recession fears on the rise, investors look poised to diversify their assets into assets like BTC with limited supply. 

          Daniel also affirmed that the deepening institutional interest is providing a strong foundation for the sustained Bitcoin price movement toward $106,000. He remarked that institutional adoption continues to climb, with spot market activity increasing and institutional funds seeing massive inflows. 

          The analyst reiterated that the convergence of powerful technical patterns, particularly the confirmed breakout and continuation within the ascending channel, suggests a likely continuation of the upward momentum for the Bitcoin price. The strong macro and institutional adoption also supports a sustained bullish momentum for BTC. 

          Daniel urged market participants to closely monitor confirmation signals, such as bullish volume surges, strong candle closures above the $90,000 breakout level, and continuation patterns forming on lower timeframes to validate the $106,000 target. 

          At the time of writing, the Bitcoin price is trading at around $94,660, up in the last 24 hours, according to data from CoinMarketCap.

          Risk Warnings and Disclaimers
          You understand and acknowledge that there is a high degree of risk involved in trading. Following any strategies or investment methods may lead to potential losses. The content on the site is provided by our contributors and analysts for information purposes only. You are solely responsible for determining whether any trading assets, securities, strategy, or any other product is suitable for investing based on your own investment objectives and financial situation.
          Add to Favorites
          Share
          FastBull
          Copyright © 2025 FastBull Ltd

          728 RM B 7/F GEE LOK IND BLDG NO 34 HUNG TO RD KWUN TONG KLN HONG KONG

          TelegramInstagramTwitterfacebooklinkedin
          App Store Google Play Google Play
          Products
          Charts

          Chats

          Q&A with Experts
          Screeners
          Economic Calendar
          Data
          Tools
          Membership
          Features
          Function
          Markets
          Copy Trading
          Latest Signals
          Contests
          News
          Analysis
          24/7
          Columns
          Education
          Company
          Careers
          About Us
          Contact Us
          Advertising
          Help Center
          Feedback
          User Agreement
          Privacy Policy
          Business

          White Label

          Data API

          Web Plug-ins

          Poster Maker

          Affiliate Program

          Risk Disclosure

          The risk of loss in trading financial instruments such as stocks, FX, commodities, futures, bonds, ETFs and crypto can be substantial. You may sustain a total loss of the funds that you deposit with your broker. Therefore, you should carefully consider whether such trading is suitable for you in light of your circumstances and financial resources.

          No decision to invest should be made without thoroughly conducting due diligence by yourself or consulting with your financial advisors. Our web content might not suit you since we don't know your financial conditions and investment needs. Our financial information might have latency or contain inaccuracy, so you should be fully responsible for any of your trading and investment decisions. The company will not be responsible for your capital loss.

          Without getting permission from the website, you are not allowed to copy the website's graphics, texts, or trademarks. Intellectual property rights in the content or data incorporated into this website belong to its providers and exchange merchants.

          Not Logged In

          Log in to access more features

          FastBull Membership

          Not yet

          Purchase

          Become a signal provider
          Help Center
          Customer Service
          Dark Mode
          Price Up/Down Colors

          Log In

          Sign Up

          Position
          Layout
          Fullscreen
          Default to Chart
          The chart page opens by default when you visit fastbull.com