

Markets
News
Analysis
User
24/7
Economic Calendar
Education
Data
- Names
- Latest
- Prev


Signal Accounts for Members
All Signal Accounts
All Contests
Asked If He Knew About Don Lemon Arrest Beforehand, Trump Says: 'I Didn't Know Anything About It'
 U.K. M4 Money Supply (SA) (Dec)
A:--
F: --
 Italy Unemployment Rate (SA) (Dec)
A:--
F: --
P: --
 Euro Zone Unemployment Rate (Dec)
A:--
F: --
P: --
Euro Zone GDP Prelim QoQ (SA) (Q4)A:--
F: --
P: --
Euro Zone GDP Prelim YoY (SA) (Q4)A:--
F: --
P: --
Italy PPI YoY (Dec)A:--
F: --
P: --
 Mexico GDP Prelim YoY (Q4)
A:--
F: --
P: --
 Brazil Unemployment Rate (Dec)
A:--
F: --
P: --
 South Africa Trade Balance (Dec)
A:--
F: --
P: --
 India Deposit Gowth YoY
A:--
F: --
P: --
 Germany CPI Prelim YoY (Jan)
A:--
F: --
P: --
Germany CPI Prelim MoM (Jan)A:--
F: --
P: --
Germany HICP Prelim YoY (Jan)A:--
F: --
P: --
Germany HICP Prelim MoM (Jan)A:--
F: --
P: --
 U.S. Core PPI YoY (Dec)
A:--
F: --
U.S. Core PPI MoM (SA) (Dec)A:--
F: --
P: --
U.S. PPI YoY (Dec)A:--
F: --
P: --
U.S. PPI MoM (SA) (Dec)A:--
F: --
P: --
 Canada GDP MoM (SA) (Nov)
A:--
F: --
P: --
Canada GDP YoY (Nov)A:--
F: --
P: --
U.S. PPI MoM Final (Excl. Food, Energy and Trade) (SA) (Dec)A:--
F: --
P: --
U.S. PPI YoY (Excl. Food, Energy & Trade) (Dec)A:--
F: --
P: --
U.S. Chicago PMI (Jan)A:--
F: --
Canada Federal Government Budget Balance (Nov)A:--
F: --
P: --
U.S. Weekly Total Oil Rig CountA:--
F: --
P: --
U.S. Weekly Total Rig CountA:--
F: --
P: --
 China, Mainland NBS Manufacturing PMI (Jan)
A:--
F: --
P: --
China, Mainland NBS Non-manufacturing PMI (Jan)A:--
F: --
P: --
China, Mainland Composite PMI (Jan)A:--
F: --
P: --
 South Korea Trade Balance Prelim (Jan)
A:--
F: --
 Japan Manufacturing PMI Final (Jan)
--
F: --
P: --
South Korea IHS Markit Manufacturing PMI (SA) (Jan)--
F: --
P: --
 Indonesia IHS Markit Manufacturing PMI (Jan)
--
F: --
P: --
China, Mainland Caixin Manufacturing PMI (SA) (Jan)--
F: --
P: --
Indonesia Trade Balance (Dec)--
F: --
P: --
Indonesia Inflation Rate YoY (Jan)--
F: --
P: --
Indonesia Core Inflation YoY (Jan)--
F: --
P: --
India HSBC Manufacturing PMI Final (Jan)--
F: --
P: --
 Australia Commodity Price YoY (Jan)
--
F: --
P: --
 Russia IHS Markit Manufacturing PMI (Jan)
--
F: --
P: --
 Turkey Manufacturing PMI (Jan)
--
F: --
P: --
U.K. Nationwide House Price Index MoM (Jan)--
F: --
P: --
U.K. Nationwide House Price Index YoY (Jan)--
F: --
P: --
Germany Actual Retail Sales MoM (Dec)--
F: --
Italy Manufacturing PMI (SA) (Jan)--
F: --
P: --
South Africa Manufacturing PMI (Jan)--
F: --
P: --
Euro Zone Manufacturing PMI Final (Jan)--
F: --
P: --
U.K. Manufacturing PMI Final (Jan)--
F: --
P: --
Brazil IHS Markit Manufacturing PMI (Jan)--
F: --
P: --
Canada National Economic Confidence Index--
F: --
P: --
Canada Manufacturing PMI (SA) (Jan)--
F: --
P: --
U.S. IHS Markit Manufacturing PMI Final (Jan)--
F: --
P: --
U.S. ISM Output Index (Jan)--
F: --
P: --
U.S. ISM Inventories Index (Jan)--
F: --
P: --
U.S. ISM Manufacturing Employment Index (Jan)--
F: --
P: --
U.S. ISM Manufacturing New Orders Index (Jan)--
F: --
P: --
U.S. ISM Manufacturing PMI (Jan)--
F: --
P: --
South Korea CPI YoY (Jan)--
F: --
P: --
Japan Monetary Base YoY (SA) (Jan)--
F: --
P: --
Australia Building Permits MoM (SA) (Dec)--
F: --
P: --


No matching data
Latest Views
Latest Views
Trending Topics
Top Columnists
Latest Update
White Label
Data API
Web Plug-ins
Affiliate Program
View All
No data


A historic liquidation event swept through gold and silver markets over the past 48 hours, erasing roughly $7 trillion in value from precious metals. Meanwhile, Bitcoin fell 7% but remained surprisingly resilient amid the broader sell-off.
Bitcoin analyst Joe Consorti noted that the decline in the precious metals market cap was roughly four times Bitcoin’s entire capitalization.
BTC Avoids Liquidation Cascade That Crushed Gold and Silver Prices
Data from blockchain analytics firm Santiment highlighted the rarity of the event. The firm noted that Bitcoin and altcoin prices remained flat, while gold dropped by more than 8% and silver by over 25%.
Notably, gold’s price had collapsed from a high of $5,600 an ounce to trade around $4,700, while silver plummeted from $121 to $77.
Market observers linked the sell-off in precious metals to President Donald Trump’s nomination of Kevin Warsh to replace Jerome Powell as Federal Reserve chairman.
Warsh is widely regarded as an inflation hawk committed to defending the U.S. dollar. This stance upends the depreciation narrative that drove the recent surge in metals prices.
Notably, traders had piled into leveraged bets, assuming the administration would pursue aggressive rate cuts.
However, the Warsh nomination signaled a pivot toward tighter monetary policy, which triggered a violent unwinding of trades.
“The violent move in the metals is a symptom of a lot of hot money chasing price recently which now are being stopped out, leverage being unwound, and profit taking among many players,” Bob Coleman, CEO of Idaho Armored Vaults, explained.
Meanwhile, some market experts noted that the gold market was due for a correction, having become overheated amid soaring public interest in precious metals.
“While parabolic moves often take asset prices higher than most investors would think possible, the out-of-this-world spikes tend to occur at the end of a cycle. In our view, the bubble today is not in AI, but in gold. An upturn in the dollar could pop that bubble, a la 1980 to 2000 when the gold price dropped more than 60%,”Cathie Wood, founder of Ark Invest, said.
What’s Next for Bitcoin?
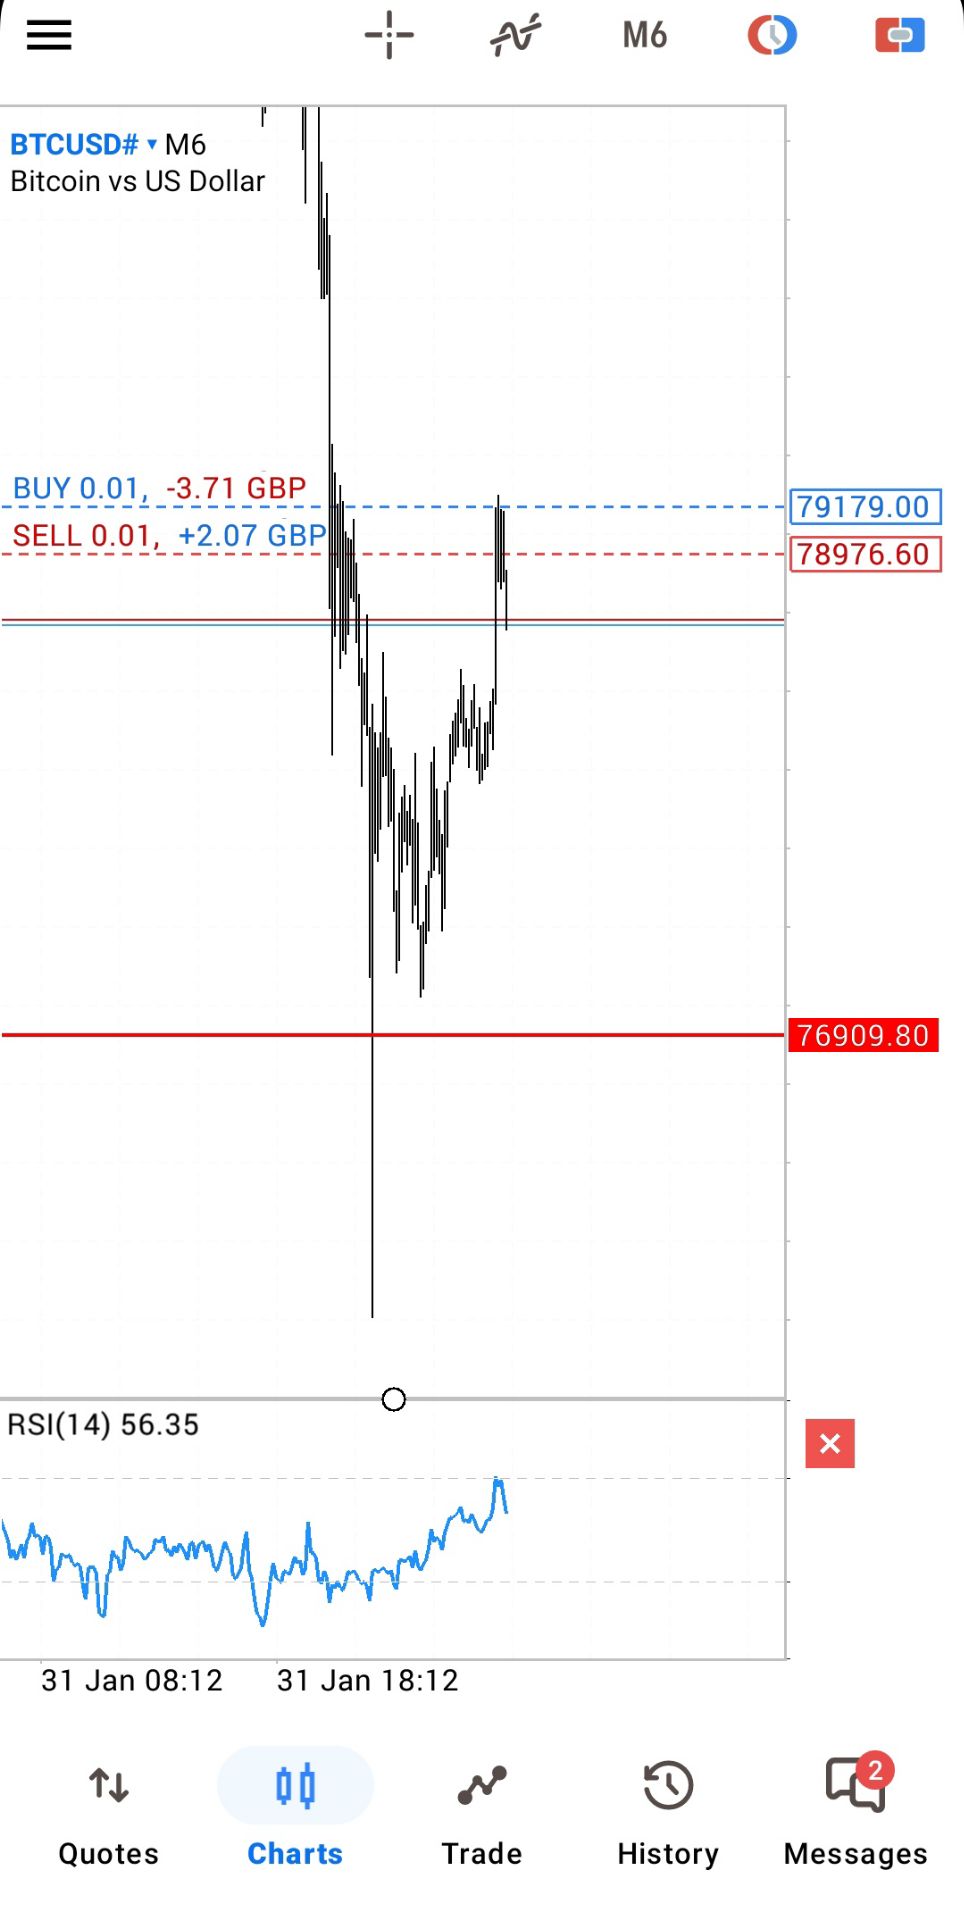
The question now facing Bitcoin investors is whether the top crypto’s stability near $82,000 signals a decoupling from traditional commodities or a delayed reaction.
Unlike metals, Bitcoin did not participate in the final, euphoric leg of the “debasement trade.” This potentially leaves it with less speculative froth to shed and more room to rally.
Some analysts argue that as liquidity exits the crowded metals trade, capital may rotate into digital assets. These observers view Bitcoin’s scarcity as distinct from the industrial dynamics that are currently weighing on gold and silver.
However, if the Warsh nomination leads to sustained global liquidity tightening, risk assets, including cryptocurrencies, could face renewed pressure in the coming weeks.
The move reflects tightening physical supply, accelerating utility demand, and renewed institutional participation, reshaping expectations for the nuclear fuel market in 2026 and beyond.
Uranium Price Vindicates Structural Strength
According to the Trading Economics uranium chart, the spot prices are more or less at the level of $99.25 per pound, after experiencing a minor 2.27% daily pullback. Although the recent retractions occurred in the short-term, the larger trend is positive.
The precious metal has been moving steadily since mid-2025 and set higher lows and reclaimed major resistance areas that had limited price movements in the past. It is an indication of controlled consolidation as opposed to trend exhaustion.
Uranium has been trading in an escalating long-term pattern where it has more lows and breaks the $100 level once again after many years of stalemate. Graph through Trading Economics, January 2026.
The new revival above the $100 psychological mark has given additional importance to the rally. Since 2007, this zone has not been maintained as regularly and, therefore, its return is some structural development.
This is accelerated by the announcement by Sprott Physical Uranium Trust of 500,000 pounds of uranium purchases as well as a $214 million capital raise. Hopes that such capital will be quickly invested in further physical purchases have added to the stricter conditions on the spot markets.
The liquidity is not speculative and is liquid, as the trading volumes and price responsiveness are shown. The market has also exhibited the rapid dips and subsequent stabilization, other than sharp distribution, indicating continuous absorption of supply. Analysts are setting $100 as a short-term limit, more like a floor that is being built based on the current market events.
Shortage of Supply Shows Signs of Potential Breakout Phase
In a post on X, financial analyst Lukas Ekweme highlighted that uranium is approaching a breakout above its 2024 high, emphasizing that price pressure continues to build despite short-term volatility. His chart shows uranium compressing beneath resistance before accelerating sharply, a pattern often associated with continuation rather than exhaustion.
Uranium has been shrinking close to its 2024 peak after a multi-year ascending trend and this is an indication of breakout potential due to the continued supply limits. Lukas Ekweme Via X, January 30, 2026.
In addition to technical structure, the price recovery goes in line with the increasing belief that the supply of the token is structurally beyond the ability to ameliorate swift demand increases. In a research report presented by Teniz Capital, the token market in the world has been said to have reached a deficit stage, which may not be won in the coming decade.
The long project lead times, according to the firm, which can take 10-20 years to discover and then produce a product,t imply that shortages in the future are already in the supply curve.
The report described the present situation as a tipping point, with the warning that utilities that are not making long-term contracting now will have mounting difficulty in obtaining material towards the end of the decade.
The need estimates support this perception. The world uranium consumption is projected to grow approximately 28 percent by the year 2030 and more than 200% by the year 2040. The core causes of this perspective include reactor building in China and India, renewed Western policy backing of nuclear energy, the data center-generated electricity world boom, and artificial intelligence infrastructure.
Bitcoin has fallen to the 12th-largest asset globally by market capitalization, slipping behind Tesla in the rankings, according to CompaniesMarketCap.
The digital asset’s price tumbled to $81,000 earlier today and continued to fall as trading progressed. At the time of writing, BTC was hovering around $77,300, down 8% over the past 24 hours, TradingView data shows.
The recent decline has pushed Bitcoin’s market capitalization down to approximately $1.5 trillion, allowing Tesla, now valued at $1.6 trillion, to move ahead to the 11th position.
Earlier this week, Bitcoin fell out of the top 10 global assets, placing it behind Meta Platforms and Taiwan Semiconductor Manufacturing Company.
The sharp market correction this morning has triggered widespread deleveraging, wiping out roughly $2.5 billion in leveraged crypto positions in the past day, per CoinGlass .
Long traders bore the brunt of the losses at $2.4 billion, while more than 408,000 traders were liquidated.
Ethereum price has weakened sharply over the past several sessions, extending losses as market sentiment deteriorated. The recent dip reflects broader bearish conditions and also deliberate investor actions.
Increased selling pressure has made recovery more challenging. At the same time, continued distribution risks push ETH further lower before meaningful stabilization occurs.
Ethereum Holders Move To Sell Their Holdings
Whale activity has played a significant role in Ethereum’s latest decline. Over the past week, addresses holding between 10,000 and 100,000 ETH reduced exposure aggressively. These large holders sold more than 1.1 million ETH during this period. At current prices, the value of that distribution exceeds $2.8 billion.
Such large-scale selling adds direct pressure on spot markets. When whales reduce holdings, liquidity absorbs supply at lower prices. This behavior often accelerates short-term downtrends.
In Ethereum’s case, the sell-off reinforced bearish momentum and contributed to the recent breakdown below key technical levels.
Want more token insights like this? Sign up for Editor Harsh Notariya’s Daily Crypto Newsletter here.
Macro indicators present a mixed outlook for Ethereum. Data shows that the total supply in profit has dropped below the 50% threshold. When fewer holders sit on unrealized gains, fear often increases. This environment can temporarily reduce sales, as investors hesitate to realize losses.
However, the same metric also carries downside risk. If losses deepen further, behavior can shift quickly. Investors may sell to prevent additional drawdowns. Under such conditions, the Ethereum price could face renewed pressure despite short-lived stabilization attempts driven by reduced profit-taking.
ETH Price Has A Long Way To Go
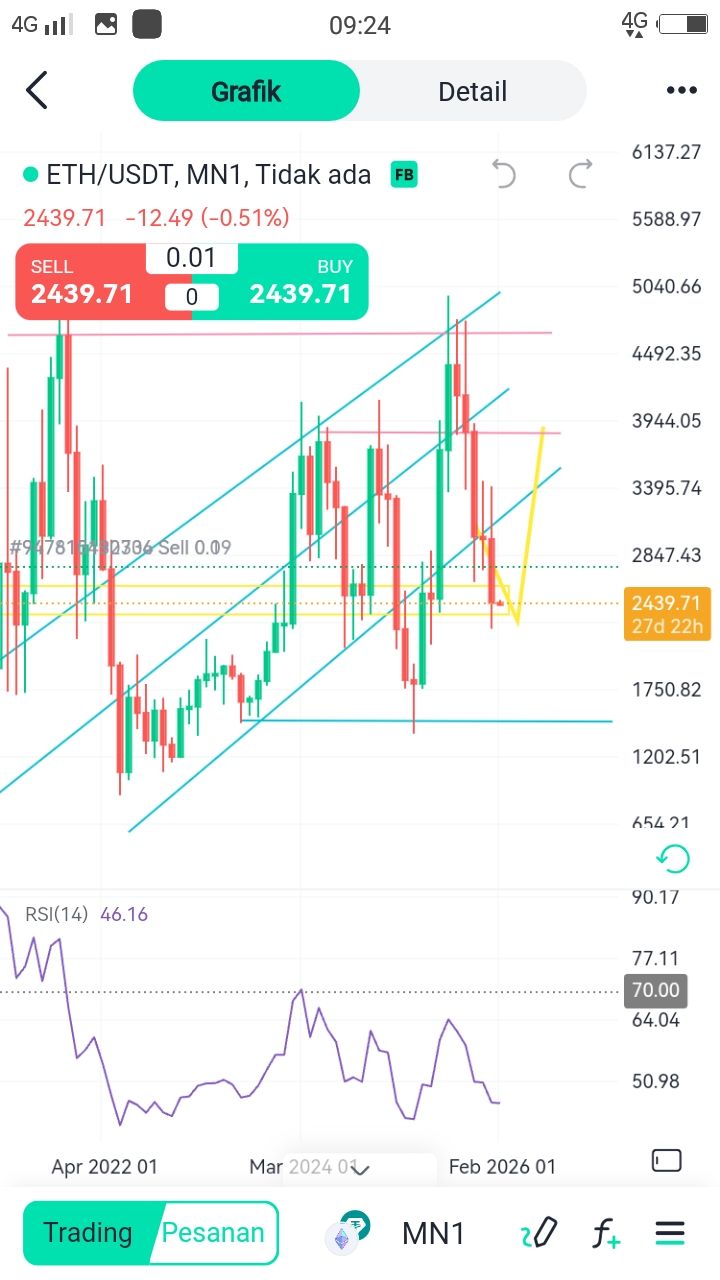
Ethereum is trading near $2,636 at the time of writing. The asset has fallen 12.7% over the past two days. This decline confirmed a bearish ascending wedge pattern. The formation projects a further 16% drop, targeting the $2,465 level if momentum persists.
The probability of this scenario has increased following the loss of key support. ETH broke below $2,802, confirming the pattern’s breakdown. Technical structures often gain credibility once support levels fail. As long as the price remains below the former support, bearish continuation remains the dominant risk.
A recovery path still exists under improved conditions. If Ethereum holds the $2,570 support level, buyers may attempt a rebound. A sustained move back toward $2,802 would be critical. Reclaiming that level as support would invalidate the bearish thesis and signal renewed strength.
U.S. spot bitcoin exchange-traded funds ended January on a sour note, with approximately $1.49 billion exiting the funds during the final week of the month, according to data from SoSoValue.
The selling pressure intensified sharply in the week's final two sessions. Wednesday saw $818 million in net outflows, the largest single-day redemption of 2026, followed by another $510 million leaving the funds on Thursday. The four-day stretch from Tuesday through Friday recorded outflows every session, with a marginal $7 million inflow on Monday.
The week's outflows pushed January's total net redemptions to approximately $1.6 billion, making it the third-largest monthly ETF sell-off in history for bitcoin products, per the data. The figure marks a stark reversal from the optimism that greeted the new year, when bitcoin ETFs pulled in over $1.16 billion in the first two trading days of 2026, with Bloomberg Senior ETF Analyst Eric Balchunas noting at the time that the products were "coming into 2026 like a lion."
The outflows come as Bitocin's price fell below $80,000 on Saturday for the first time since April of last year. BTC is currently trading around $77,800, according to The Block's Bitcoin Price page. The decline in price led BTC to briefly trade below Microstrategy's cost basis of $76,037 per Bitcoin for the first time since Oct. 2023.
ETH, SOL, and XRP show divergent flows
Spot ether ETFs mirrored bitcoin's weakness, recording approximately $353 million in net outflows for January. The final week proved particularly brutal, with Thursday's session alone seeing $253 million exit the funds, led by outflows from BlackRock's industry-leading ETHA and Fidelity's FETH.
Ether also dipped on Saturday, briefly dropping below $2,300. Its price is currently down more than 13% over the past 24 hours, trading at about $2,376, per The Block's Ethereum Price page.
In contrast, newer altcoin ETF products showed resilience. Spot Solana ETFs recorded approximately $105 million in net inflows for January, continuing the momentum that has made Bitwise's BSOL fund the industry leader in SOL ETF assets under management.
XRP ETFs posted modest net inflows of roughly $16 million for the month, though the final week saw a notable $93 million outflow on Wednesday that temporarily disrupted their positive streak. The five XRP funds had previously traded for 36 consecutive days without net outflows following their November launch.
Macro factors weigh on sentiment
The synchronized selling across bitcoin and ether ETFs suggests institutional investors were reducing overall crypto exposure rather than rotating between assets, a shift from earlier in January when ether inflows often offset bitcoin weakness.
The selloff accelerated after former Federal Reserve Governor Kevin Warsh was selected as the next Fed chair, a choice markets have interpreted as bearish for risk assets. Geopolitical flashpoints, including reports of an explosion at Iran's Bandar Abbas port and a brief U.S. government shutdown, added to the risk-off tone.
The ETF landscape continues to expand even amid the outflows. Morgan Stanley filed registration statements with the SEC earlier this month to launch spot Bitcoin and Solana ETFs, signaling that institutional interest in regulated crypto exposure persists despite short-term volatility.
Disclaimer: The Block is an independent media outlet that delivers news, research, and data. As of November 2023, Foresight Ventures is a majority investor of The Block. Foresight Ventures invests in other companies in the crypto space. Crypto exchange Bitget is an anchor LP for Foresight Ventures. The Block continues to operate independently to deliver objective, impactful, and timely information about the crypto industry. Here are our current financial disclosures.
© 2026 The Block. All Rights Reserved. This article is provided for informational purposes only. It is not offered or intended to be used as legal, tax, investment, financial, or other advice.
728 RM B 7/F GEE LOK IND BLDG NO 34 HUNG TO RD KWUN TONG KLN HONG KONG


White Label
Data API
Web Plug-ins
Poster Maker
Affiliate Program
The risk of loss in trading financial instruments such as stocks, FX, commodities, futures, bonds, ETFs and crypto can be substantial. You may sustain a total loss of the funds that you deposit with your broker. Therefore, you should carefully consider whether such trading is suitable for you in light of your circumstances and financial resources.
No decision to invest should be made without thoroughly conducting due diligence by yourself or consulting with your financial advisors. Our web content might not suit you since we don't know your financial conditions and investment needs. Our financial information might have latency or contain inaccuracy, so you should be fully responsible for any of your trading and investment decisions. The company will not be responsible for your capital loss.
Without getting permission from the website, you are not allowed to copy the website's graphics, texts, or trademarks. Intellectual property rights in the content or data incorporated into this website belong to its providers and exchange merchants.
Not Logged In
Log in to access more features


Log In
Sign Up


