• Trade
  • Markets
  • Copy
  • Contests
  • 24/7
  • Calendar
  • Q&A
  • Chats
Screeners
SYMBOL
LAST
BID
ASK
HIGH
LOW
NET CHG.
%CHG.
SPREAD
SOURCE
SPX
S&P 500 Index
7175.83
7175.83
7175.83
7415.64
7173.63
-147.80
-2.02%
--
--
DJI
Dow Jones Industrial Average
49097.06
49097.06
49097.06
50454.81
49091.92
-1101.11
-2.19%
--
--
IXIC
NASDAQ Composite Index
23879.21
23879.21
23879.21
24939.62
23870.70
-550.67
-2.25%
--
--
USDX
US Dollar Index
103.638
103.638
103.718
103.852
103.610
-0.199
-0.19%
--
--
EURUSD
Euro / US Dollar
1.09858
1.09858
1.09867
1.09886
1.09610
+0.00203
+ 0.19%
--
--
GBPUSD
Pound Sterling / US Dollar
1.31168
1.31168
1.31181
1.31198
1.30780
+0.00319
+ 0.24%
--
--
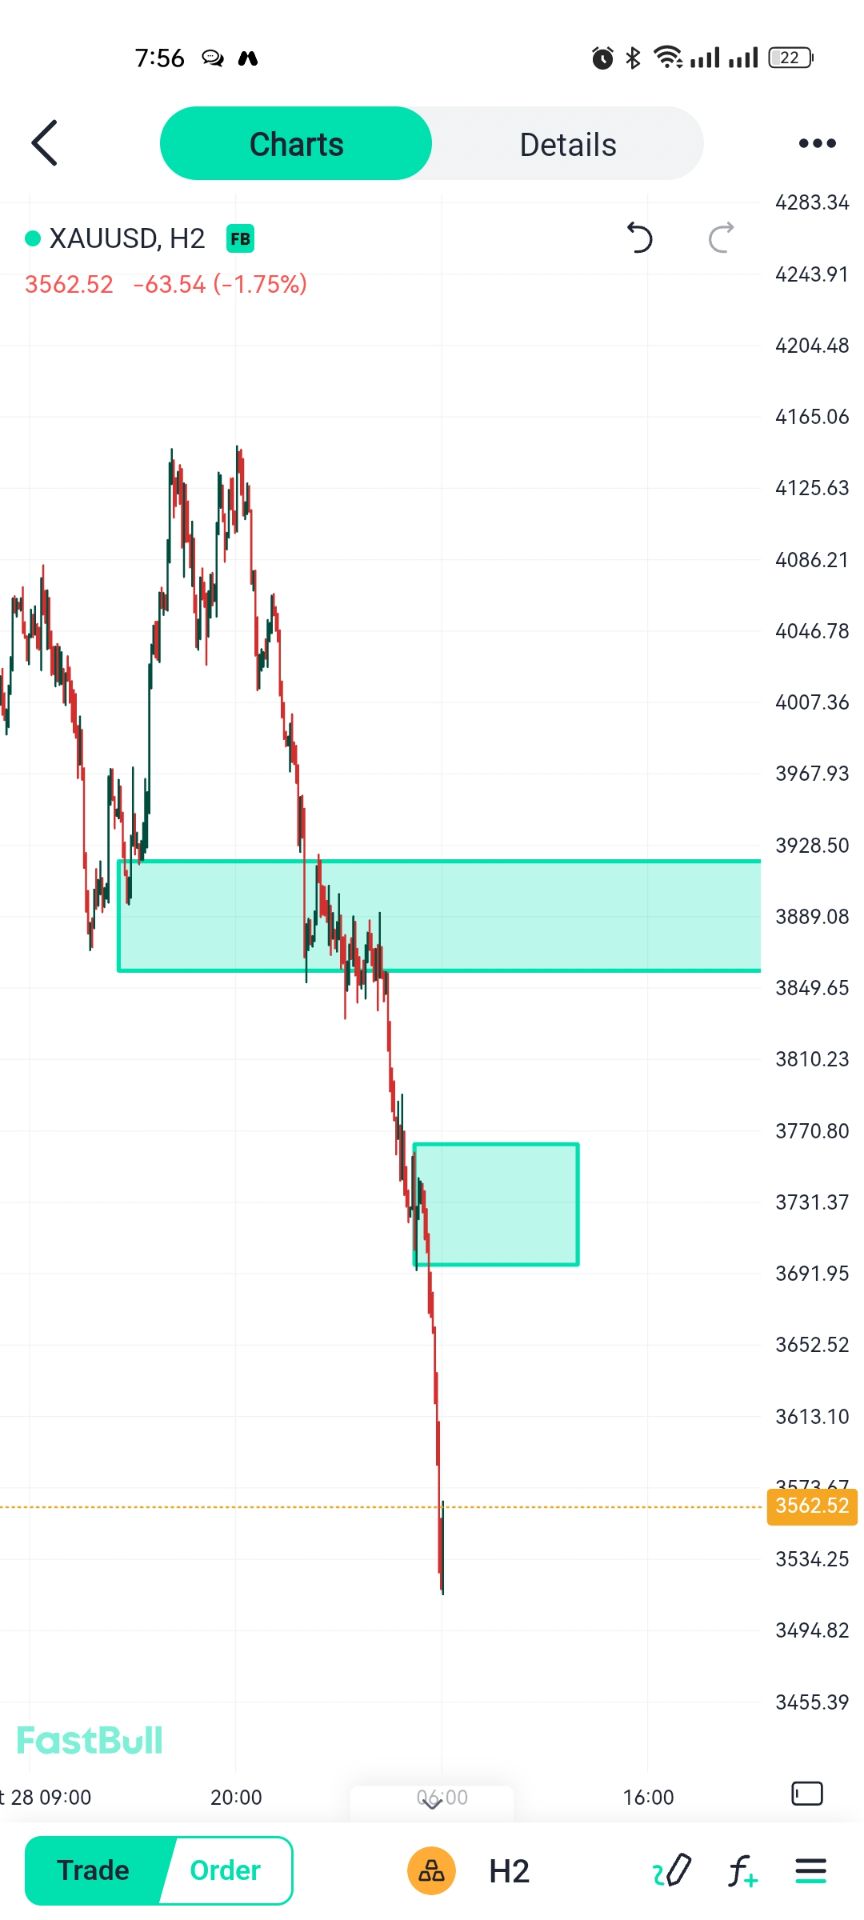
XAUUSD
Gold / US Dollar
3551.32
3551.32
3551.73
3636.65
3514.30
-74.74
-2.06%
--
--
WTI
Light Sweet Crude Oil
82.752
82.752
82.782
83.097
82.229
-0.290
-0.35%
--
--

Community Accounts

Signal Accounts
--
Profit Accounts
--
Loss Accounts
--
View More

Become a signal provider

Sell trading signals to earn additional income

View More

Guide to Copy Trading

Get started with ease and confidence

View More

Signal Accounts for Members

All Signal Accounts

Best Return
  • Best Return
  • Best P/L
  • Best MDD
Past 1W
  • Past 1W
  • Past 1M
  • Past 1Y

All Contests

  • All
  • Recommend
  • Stocks
  • Cryptocurrencies
  • Central Banks
  • Trump Updates
  • Featured News
Top News Only
Share

Central Bank Of Turkey: Turkey's Net External Debt Stock Was $206.73 Billion At The End Of The Third Quarter

Share

UK Office For National Statistics: UK Supermarket Sales Strengthened In October After The Government Advised Buying Durable Goods

Share

According To AmSpec, An Independent Inspection Agency In Malaysia, Malaysia's Palm Oil Exports From November 1 To 20 Totaled 973,805 Tons, A Decrease Of 10.24% Compared To 1,084,928 Tons In The Same Period Last Month

Share

Ding Xuexiang Will Visit Singapore And Chair A Meeting Of The China-Singapore Bilateral Cooperation Mechanism

Share

Viewpoint: Current Short-term Bitcoin Holders Are Realizing An Average Loss Of About 15%, And The SOPR Indicator Is Signaling An Entry Point

Share

Polish Prime Minister Tusk: I Have Received Reports From The Ministers Regarding The Entry Into Polish Airspace; There Is No Threat From The Air

Share

Russian Deputy Foreign Minister Ryabkov Stated That NATO's Granting Of "quasi-member" Status To Ukraine Is Unacceptable

Share

Russian Foreign Ministry: No Agreement Reached On The Next Round Of Ukraine Talks

Share

Russian Foreign Ministry: Preparations Are Underway For A Visit By EU Representatives

Share

Sri Lanka Central Bank Governor: There Are Many Policies That Affect Economic Growth, Not Just Monetary Policy

Share

The Commander Of The Ukrainian Drone Force Stated That In The Past 50 Days, Ukrainian Drone Forces Have Struck 41 Russian Oil Refineries And Weapons Production Facilities

Share

Sri Lanka Central Bank Governor: A Buffer Mechanism Will Be Established To Cope With Headwinds

Share

Sri Lanka Central Bank Governor: Hope To See The Impact Of The Current Global Oil Price Decline

Share

Hungarian Finance Minister Kármán Stated That A New Medium-term Agreement Is Being Developed To Ensure That Nominal Wages Are Aligned With Economic Performance

Share

Sri Lanka Central Bank Governor: Even With Fuel Subsidies, Inflation Remains Higher Than Expected

Share

Sri Lanka Central Bank Governor: Once Inflation Enters A Downward Trend, The Central Bank Will Return To An Easing Policy

Share

The Governor Of The Central Bank Of Sri Lanka Said That The Reserve Requirement Ratio Will Be Used To Absorb About 150 Billion Rupees Flowing Back To The Central Bank

Share

Sri Lanka Central Bank Governor: Reserve Requirement Ratio Will Help Maintain Short-term Interest Rates

Share

The Governor Of The Central Bank Of Sri Lanka Said He Hopes To Bring The Inflation Rate Down To The Target Level Of 5% As Soon As Possible

Share

Tanker Shipping Company Frontline: The Current Supply Disruptions Will Have A Lasting Impact On Crude Oil Purchasing Patterns, With Asian Buyers Maintaining A Diversified Supply Base And Holding Larger Inventories

TIME
ACT
FCST
PREV
IMPACT
Canada Industrial Product Price Index YoY (Oct)

A:--

F: --

P: --
USDCAD
  • USDCAD
  • XAUUSD
  • XAGUSD
  • WTI
  • USDX
U.S. Philadelphia Fed Business Activity Index (SA) (Nov)

A:--

F: --

P: --

USDX
  • USDX
  • XAUUSD
  • XAGUSD
  • WTI
U.S. Initial Jobless Claims 4-Week Avg. (SA)

A:--

F: --

P: --
XAUUSD
  • XAUUSD
  • XAGUSD
  • WTI
  • USDX
U.S. Weekly Continued Jobless Claims (SA)

A:--

F: --

P: --
XAUUSD
  • XAUUSD
  • XAGUSD
  • WTI
  • USDX
U.S. Philadelphia Fed Manufacturing Employment Index (Nov)

A:--

F: --

P: --

USDX
  • USDX
  • XAUUSD
  • XAGUSD
  • WTI
ECB President Lagarde Speaks
FOMC Member Hammack Speaks
U.S. Conference Board Leading Economic Index MoM (Oct)

A:--

F: --

P: --

USDX
  • USDX
  • XAUUSD
  • XAGUSD
  • WTI
U.S. Conference Board Lagging Economic Index MoM (Oct)

A:--

F: --

P: --

USDX
  • USDX
  • XAUUSD
  • XAGUSD
  • WTI
U.S. Conference Board Coincident Economic Index MoM (Oct)

A:--

F: --

P: --

USDX
  • USDX
  • XAUUSD
  • XAGUSD
  • WTI
U.S. Conference Board Leading Economic Index (Oct)

A:--

F: --

P: --

USDX
  • USDX
  • XAUUSD
  • XAGUSD
  • WTI
U.S. EIA Weekly Natural Gas Stocks Change

A:--

F: --

P: --

WTI
  • WTI
  • XAUUSD
  • XAGUSD
  • USDX
U.S. Kansas Fed Manufacturing Production Index (Nov)

A:--

F: --

P: --

USDX
  • USDX
  • XAUUSD
  • XAGUSD
  • WTI
U.S. Kansas Fed Manufacturing Composite Index (Nov)

A:--

F: --

P: --

USDX
  • USDX
  • XAUUSD
  • XAGUSD
  • WTI
U.S. 10-Year TIPS Auction Avg. Yield

A:--

F: --

P: --

XAUUSD
  • XAUUSD
  • XAGUSD
  • WTI
  • USDX
Argentina Trade Balance (Oct)

A:--

F: --

P: --

XAUUSD
  • XAUUSD
  • XAGUSD
  • WTI
  • USDX
Richmond Federal Reserve President Barkin delivered a speech.
South Korea PPI MoM (Oct)

A:--

F: --

P: --
XAUUSD
  • XAUUSD
  • XAGUSD
  • WTI
  • USDX
Richmond Federal Reserve President Barkin delivered a speech.
U.S. Weekly Treasuries Held by Foreign Central Banks

A:--

F: --

P: --

USDX
  • USDX
  • XAUUSD
  • XAGUSD
  • WTI
Japan National CPI MoM (Oct)

A:--

F: --

P: --

USDJPY
  • USDJPY
  • XAUUSD
  • XAGUSD
  • WTI
Japan National CPI MoM (Not SA) (Oct)

A:--

F: --

P: --

USDJPY
  • USDJPY
  • XAUUSD
  • XAGUSD
  • WTI
Japan National Core CPI YoY (Oct)

A:--

F: --

P: --

USDJPY
  • USDJPY
  • XAUUSD
  • XAGUSD
  • WTI
Japan National CPI YoY (Oct)

A:--

F: --

P: --

USDJPY
  • USDJPY
  • XAUUSD
  • XAGUSD
  • WTI
Philadelphia Fed President Henry Paulson delivers a speech
U.K. GfK Consumer Confidence Index (Nov)

A:--

F: --

P: --

GBPUSD
  • GBPUSD
  • XAUUSD
  • XAGUSD
  • WTI
China, Mainland 5-Year Loan Prime Rate

A:--

F: --

P: --

XAUUSD
  • XAUUSD
  • XAGUSD
  • WTI
  • USDX
China, Mainland 1-Year Loan Prime Rate (LPR)

A:--

F: --

P: --

XAUUSD
  • XAUUSD
  • XAGUSD
  • WTI
  • USDX
Turkey Capacity Utilization (Nov)

A:--

F: --

P: --

XAUUSD
  • XAUUSD
  • XAGUSD
  • WTI
  • USDX
Turkey Consumer Confidence Index (Nov)

A:--

F: --

P: --

XAUUSD
  • XAUUSD
  • XAGUSD
  • WTI
  • USDX
Germany PPI MoM (Oct)

A:--

F: --

P: --

EURUSD
  • EURUSD
  • XAUUSD
  • XAGUSD
  • WTI
  • USDX
Germany PPI YoY (Oct)

A:--

F: --

P: --

EURUSD
  • EURUSD
  • XAUUSD
  • XAGUSD
  • WTI
  • USDX
U.K. Core Retail Sales YoY (SA) (Oct)

A:--

F: --

P: --
GBPUSD
  • GBPUSD
  • XAUUSD
  • XAGUSD
  • WTI
  • USDX
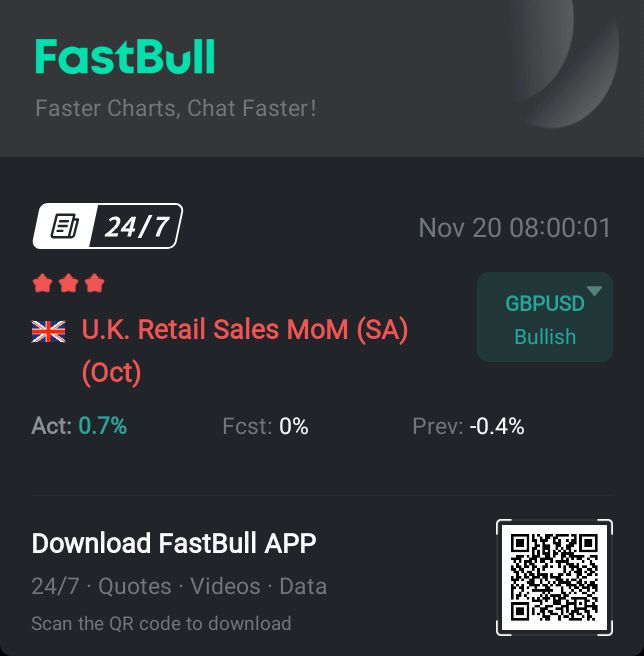
U.K. Retail Sales MoM (SA) (Oct)

A:--

F: --

P: --
GBPUSD
  • GBPUSD
  • XAUUSD
  • XAGUSD
  • WTI
  • USDX
U.K. Retail Sales YoY (SA) (Oct)

A:--

F: --

P: --
GBPUSD
  • GBPUSD
  • XAUUSD
  • XAGUSD
  • WTI
  • USDX
ECB President Lagarde Speaks
India Industrial Production Index YoY (Oct)

--

F: --

P: --

Mexico Retail Sales MoM (Sept)

--

F: --

P: --

Canada Core Retail Sales MoM (SA) (Sept)

--

F: --

P: --

Canada Retail Sales MoM (SA) (Sept)

--

F: --

P: --

U.S. UMich Current Economic Conditions Index Final (Nov)

--

F: --

P: --

U.S. UMich 1-Year-Ahead Inflation Expectations Final (Nov)

--

F: --

P: --

U.S. UMich Consumer Expectations Index Final (Nov)

--

F: --

P: --

U.S. UMich Consumer Sentiment Index Final (Nov)

--

F: --

P: --

Euro Zone Consumer Confidence Index Prelim (Nov)

--

F: --

P: --

U.S. Weekly Total Oil Rig Count

--

F: --

P: --

U.S. Weekly Total Rig Count

--

F: --

P: --

Australia Composite PMI Prelim (Nov)

--

F: --

P: --

Australia Manufacturing PMI Prelim (Nov)

--

F: --

P: --

France Services PMI Prelim (SA) (Nov)

--

F: --

P: --

France Manufacturing PMI Prelim (Nov)

--

F: --

P: --

France Composite PMI Prelim (SA) (Nov)

--

F: --

P: --

Germany Composite PMI Prelim (SA) (Nov)

--

F: --

P: --

Germany Services PMI Prelim (SA) (Nov)

--

F: --

P: --

Germany Manufacturing PMI Prelim (SA) (Nov)

--

F: --

P: --

Euro Zone Composite PMI Prelim (SA) (Nov)

--

F: --

P: --

Euro Zone Services PMI Prelim (SA) (Nov)

--

F: --

P: --

Euro Zone Manufacturing PMI Prelim (SA) (Nov)

--

F: --

P: --

U.K. Composite PMI Prelim (Nov)

--

F: --

P: --

Q&A with Experts
    • All
    • Chatrooms
    • Groups
    • Friends
    Size flag
    6088176
    What level of gold do you think could be a good starting point for a long‑term purchase?
    @Visitor6088176I'd be watching the $3,500–$3,480 region as a potential long-term accumulation area
    EuroTrader flag
    EuroTrader
    This is what I am waiting for on Xauusd. If it retraces higher then I would be entering the new shorts @Sanjeev Ku
    SlowBear ⛅ flag
    Qw
    goldd any ideaa
    @Qwhi mate, how are you doing, i hope you are doing good
    Skylark flag
    6088176
    What level of gold do you think could be a good starting point for a long‑term purchase?
    @Visitor6088176 For a long term purchase, I think a good starting point is around $3,500 because that is a major support from April 2025 and many analysts are watching it closely.
    Size flag
    6088176
    What level of gold do you think could be a good starting point for a long‑term purchase?
    With $3,250 as a deeper zone to keep in mind if selling pressure continues.@Visitor6088176
    Size flag
    6088176
    What level of gold do you think could be a good starting point for a long‑term purchase?
    With $3,250 as a deeper zone to keep in mind if selling pressure continues.@Visitor6088176
    Skylark flag
    6088176
    What level of gold do you think could be a good starting point for a long‑term purchase?
    Gold is currently trading near $3,560 after falling from $5,600, so buying near $3,500 would mean you are entering close to the bottom of this long correction phase right now. @Visitor6088176
    Size flag
    6088176
    What level of gold do you think could be a good starting point for a long‑term purchase?
    Gold has been under significant pressure from dollar strength and expectations of further Fed tightening@Visitor6088176
    Skylark flag
    6088176
    What level of gold do you think could be a good starting point for a long‑term purchase?
    I would not put all your money in at one level, but rather split your purchase into three parts around $3,500, $3,400 and $3,300 to reduce your average entry price. @Visitor6088176
    Size flag
    6088176
    What level of gold do you think could be a good starting point for a long‑term purchase?
    I wouldn't rush into buying just because price is falling, though@Visitor6088176
    Skylark flag
    Skylark flag
    6088176
    What level of gold do you think could be a good starting point for a long‑term purchase?
    The long term story is still strong because central banks keep buying gold, inflation remains a risk, and the Fed is expected to cut rates in late 2027 for support. @Visitor6088176
    SlowBear ⛅ flag
    Qw
    goldd any ideaa
    @Qwhi mate, how are you doing, i hope you are doing good
    Skylark flag
    6088176
    What level of gold do you think could be a good starting point for a long‑term purchase?
    Analysts like Goldman Sachs still see gold reaching around $4,650 by end of 2027 and $5,600 by end of 2028, which makes $3,500 look like a good value zone today.@Visitor6088176
    Size flag
    6088176
    What level of gold do you think could be a good starting point for a long‑term purchase?
    I'd prefer to see weekly stabilization and a clear shift in market structure before building a long-term position.@Visitor6088176
    "Size" recalled a message
    Skylark flag
    6088176
    What level of gold do you think could be a good starting point for a long‑term purchase?
    If price breaks strongly below $3,500 on a weekly close, then do not panic, because the next support is near $3,300 and that would be an even better buying chance. @Visitor6088176
    Size flag
    Qw
    goldd any ideaa
    @QwHey mate, how are you doing today? welcome here..
    Skylark flag
    6088176
    What level of gold do you think could be a good starting point for a long‑term purchase?
    Just remember this is not financial advice, so always do your own research, buy from trusted sources, and only invest money you can afford to hold long term without panic.@Visitor6088176
    Size flag
    Qw
    goldd any ideaa
    @QwGold is still showing strong selling pressure.
    Type here...
    Add Symbol or Code

      No matching data

      All
      Recommend
      Stocks
      Cryptocurrencies
      Central Banks
      Trump Updates
      Featured News
      • All
      • Russia-Ukraine Conflict
      • Middle East Flashpoint
      • All
      • Russia-Ukraine Conflict
      • Middle East Flashpoint
      Search
      Products

      Charts Free Forever

      Chats Q&A with Experts
      Screeners Economic Calendar Data Tools
      Membership Features
      Data Warehouse Market Trends Institutional Data Policy Rates Macro

      Market Trends

      Market Sentiment Order Book Forex Correlations

      Top Indicators

      Charts Free Forever
      Markets

      News

      24/7 Analysis Education

      Latest Views

      Latest Update

      Signals

      Copy Rankings Latest Signals Become a signal provider AI Rating
      Contests
      Brokers

      Overview Brokers Assessment Rankings Regulators News Claims
      Broker listing Forex Brokers Comparison Tool Live Spread Comparison Scam
      Q&A Complaint Scam Alert Videos Tips to Detect Scam
      More

      Business
      Events
      Careers About Us Advertising Help Center

      White Label

      Broker API

      Data API

      Web Plug-ins

      Affiliate Program

      Awards Institution Evaluation IB Seminar Salon Event Exhibition
      Vietnam Thailand Singapore Dubai
      Fans Party Investment Sharing Session
      FastBull Summit BrokersView Expo
      Recent Searches
        Top Searches
          Markets
          Analysis
          User
          24/7
          Economic Calendar
          Education
          Data
          • Names
          • Latest
          • Prev

          View All

          No data

          Scan to Download

          Faster Charts, Chat Faster!

          Download
          English
          • English
          • Español
          • العربية
          • Bahasa Indonesia
          • Bahasa Melayu
          • Tiếng Việt
          • ภาษาไทย
          • Français
          • Italiano
          • Türkçe
          • Русский язык
          • 简中
          • 繁中
          Open Account
          Search
          Products
          Charts Free Forever
          Markets
          News
          Signals

          Copy Rankings Latest Signals Become a signal provider AI Rating
          Contests
          Brokers

          Overview Brokers Assessment Rankings Regulators News Claims
          Broker listing Forex Brokers Comparison Tool Live Spread Comparison Scam
          Q&A Complaint Scam Alert Videos Tips to Detect Scam
          More

          Business
          Events
          Careers About Us Advertising Help Center

          White Label

          Broker API

          Data API

          Web Plug-ins

          Affiliate Program

          Awards Institution Evaluation IB Seminar Salon Event Exhibition
          Vietnam Thailand Singapore Dubai
          Fans Party Investment Sharing Session
          FastBull Summit BrokersView Expo

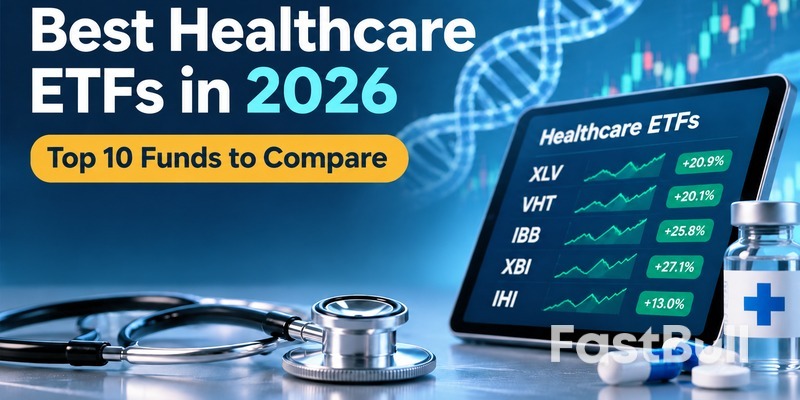
          Best Healthcare ETFs in 2026: Top 10 Funds to Compare

          zhan chen
          Summary:

          Compare the 10 best healthcare ETFs in 2026, including XLV, VHT, IBB, and XBI. Explore expense ratios, holdings, investment strategies, and risks.

          Healthcare ETFs range from diversified sector funds to focused biotechnology, pharmaceutical, medical device, and healthcare provider funds. A fund with strong recent returns may also carry concentrated holdings or industry-specific risks. The best choice depends on your investment goals, preferred exposure, and tolerance for volatility.
          Best Healthcare ETFs in 2026: Top 10 Funds to Compare_1

          What Are the Best Healthcare ETFs in 2026?

          The following 10 healthcare ETFs cover the main ways to invest in the healthcare industry. Rather than ranking them solely by recent performance, this comparison considers their investment focus, index methodology, and costs.

          ETFTickerInvestment FocusExpense Ratio
          Health Care Select Sector SPDR FundXLVLarge U.S. healthcare companies0.08%
          Vanguard Health Care ETFVHTBroad U.S. healthcare market0.09%
          Fidelity MSCI Health Care Index ETFFHLCBroad U.S. healthcare market0.084%
          iShares U.S. Healthcare ETFIYHU.S. healthcare companies0.37%
          iShares Biotechnology ETFIBBBiotechnology companies0.44%
          SPDR S&P Biotech ETFXBIBiotechnology companies0.35%
          iShares U.S. Medical Devices ETFIHIMedical device manufacturers0.37%
          VanEck Pharmaceutical ETFPPHPharmaceutical companies0.36%
          iShares U.S. Healthcare Providers ETFIHFHealthcare insurers and providers0.37%
          iShares Global Healthcare ETFIXJGlobal healthcare companies0.38%

          Expense ratios reflect the latest available issuer disclosures checked in November 2026. Fees can change, so investors should confirm current figures in each fund's prospectus.

          These funds are not direct substitutes. XLV, VHT, FHLC, and IYH provide broad U.S. healthcare exposure, while IBB and XBI concentrate on biotechnology. IHI, PPH, and IHF target specific healthcare industries, and IXJ provides international diversification.

          Which Healthcare ETFs Stand Out by Investment Focus?

          Healthcare includes businesses with very different revenue sources and growth drivers. Choosing a fund by industry exposure can help investors avoid buying a portfolio that does not match their expectations.

          Broad Healthcare ETFs: XLV, VHT, FHLC, and IYH

          These four funds provide exposure to multiple healthcare industries, but their index construction affects which companies receive the most weight.

          • XLV: Tracks the Health Care Select Sector Index, which represents healthcare companies in the S&P 500. It focuses on established large-cap businesses across pharmaceuticals, biotechnology, medical equipment, and healthcare services. Its 0.08% expense ratio makes it a relatively inexpensive sector option.
          • VHT: Tracks the MSCI US Investable Market Health Care 25/50 Index. It covers large-, mid-, and small-cap healthcare companies, giving investors exposure beyond the largest publicly traded businesses.
          • FHLC: Tracks the MSCI USA IMI Health Care 25/50 Index and also covers different market-cap segments. Its 0.084% expense ratio makes it one of the lower-cost broad healthcare ETFs.
          • IYH: Tracks a U.S. healthcare equity index based on the Russell 1000 Health Care RIC 22.5/45 Capped Index. It provides exposure to larger U.S. healthcare companies, but its 0.37% expense ratio is considerably higher than those of XLV, VHT, and FHLC.

          The main distinction is not simply the number of stocks each fund owns. Their benchmarks determine which companies qualify and how much influence larger holdings have on overall performance.

          Biotechnology ETFs: IBB and XBI

          Biotechnology companies develop drugs, treatments, and other medical technologies. Their business prospects often depend on clinical trial results, regulatory approvals, research funding, and the ability to bring new products to market.

          • IBB: The iShares Biotechnology ETF tracks the NYSE Biotechnology Index. Its index methodology gives larger biotechnology businesses greater influence over the portfolio, providing exposure to established developers as well as other biotech companies.
          • XBI: The SPDR S&P Biotech ETF tracks the S&P Biotechnology Select Industry Index, which uses a modified equal-weighted approach. This gives smaller and mid-sized companies a more meaningful role than in a conventional market-cap-weighted portfolio.

          IBB may suit investors who prefer greater exposure to larger biotechnology companies. XBI provides a more balanced allocation across company sizes, but its exposure to smaller businesses can increase sensitivity to financing conditions and clinical trial setbacks.

          Healthcare Subsector ETFs: IHI, PPH, and IHF

          Investors who want exposure to a particular part of healthcare can use specialized ETFs rather than buying the entire sector.

          • IHI: The iShares U.S. Medical Devices ETF focuses on manufacturers and distributors of medical equipment. Its portfolio includes businesses involved in surgical instruments, diagnostic equipment, and medical technologies. Its performance is closely tied to demand for medical devices and the growth of healthcare procedures.
          • PPH: The VanEck Pharmaceutical ETF tracks the MVIS US Listed Pharmaceutical 25 Index. It focuses on established pharmaceutical companies involved in drug research, development, production, and sales, providing more concentrated exposure to the drug industry.
          • IHF: The iShares U.S. Healthcare Providers ETF targets healthcare insurers and service operators, including businesses involved in health insurance, diagnostics, and specialized treatment services. Its results can be affected by insurance costs, patient demand, and reimbursement policies.

          These ETFs respond to different business drivers. Medical device manufacturers depend on equipment demand and product adoption, pharmaceutical companies rely on drug sales and patent protection, and healthcare providers are more exposed to insurance economics and medical service costs.

          Global Healthcare ETFs: IXJ

          The iShares Global Healthcare ETF (IXJ) tracks the S&P Global 1200 Health Care Sector Capped Index. It invests in healthcare companies across the U.S. and international markets, including pharmaceutical manufacturers, biotechnology businesses, and medical equipment companies.

          IXJ provides access to companies such as Roche, Novartis, and AstraZeneca alongside U.S. healthcare businesses. However, global exposure does not mean equal geographic allocation. As of November 4, 2026, U.S. companies accounted for about 73% of its portfolio, with Switzerland, the U.K., and Japan among its other major country exposures.

          IXJ can help investors diversify beyond U.S.-listed healthcare stocks, although currency movements and different regulatory environments introduce additional risks.

          How Do the Leading Healthcare ETFs Compare?

          Investors choosing between healthcare ETFs should focus on differences that affect portfolio exposure, not just ticker symbols or historical returns.

          XLV vs. VHT vs. FHLC vs. IYH

          ETFMarket CoverageExpense RatioMain Difference
          XLVS&P 500 healthcare stocks0.08%Focuses on large-cap companies
          VHTLarge-, mid-, and small-cap U.S. stocks0.09%Broader market coverage
          FHLCLarge-, mid-, and small-cap U.S. stocks0.084%Broad exposure at a low cost
          IYHU.S. large- and mid-cap healthcare stocks0.37%Higher cost for similar broad-sector exposure

          XLV is a straightforward option for investors who want exposure to established S&P 500 healthcare companies. VHT and FHLC cover a wider range of market capitalizations, making them useful alternatives for investors who want exposure to smaller healthcare businesses as well.

          VHT and FHLC are particularly close alternatives in terms of broad market coverage, while their fees are also similar. IYH is worth comparing for its index exposure, but its higher expense ratio makes the cost difference important for long-term investors.

          U.S. Healthcare ETFs vs. Global Healthcare ETFs

          The choice between a U.S.-focused fund such as VHT and a global fund such as IXJ depends on how much international exposure you want.

          VHT invests in U.S. healthcare companies across different market-cap segments. IXJ includes companies from multiple countries, allowing investors to access international pharmaceutical and medical technology businesses that may not be represented in the same way in a U.S.-only fund.

          However, investors should examine IXJ's geographic allocation before assuming it provides balanced global exposure. Its portfolio remains heavily weighted toward U.S. companies, so it adds international holdings without removing most of its U.S. market exposure.

          What Should You Consider Before Choosing a Healthcare ETF?

          After identifying the type of healthcare exposure you want, compare the costs, underlying holdings, and distribution policies of the available funds.

          Expense Ratios and Trading Liquidity

          An expense ratio is the annual operating cost of an ETF, expressed as a percentage of assets. For example, a 0.10% expense ratio costs approximately $10 per year on a $10,000 investment, while a 0.40% ratio costs about $40.

          Lower fees can improve long-term results when funds provide similar exposure. Trading liquidity also matters: ETFs with higher trading volume and narrower bid-ask spreads can be cheaper to buy and sell.

          Holdings, Diversification, and Overlap

          Check the fund's largest holdings and how much of the portfolio they represent. A healthcare ETF may hold dozens or hundreds of stocks but still be heavily influenced by a small number of large companies.

          Also consider overlap between funds. Holding XLV and VHT together, for example, may add less diversification than expected because both invest in many of the same major U.S. healthcare businesses.

          Specialized ETFs can increase exposure to a particular industry, but they also make portfolio results more dependent on that segment.

          Dividend Yield vs. Total Return

          Many healthcare ETFs distribute dividends, but a higher yield does not automatically make a fund a better investment.

          Dividend yield measures distributions relative to the ETF's share price. Total return also includes changes in the share price and reinvested distributions. Investors seeking income should compare trailing distribution yields and payment schedules, while long-term investors should evaluate total returns across different market conditions.

          ETF distributions can change and are not guaranteed. A fund's yield should therefore be considered alongside its holdings, costs, and investment strategy.

          What Risks Should Investors Understand?

          Healthcare demand can remain relatively resilient, but healthcare ETFs are still equity investments. Their prices can fall when company earnings weaken, valuations decline, or industry conditions change.

          Regulatory Changes and Healthcare Policy

          Healthcare companies operate under extensive government and regulatory oversight. Changes in drug pricing rules, insurance coverage, reimbursement rates, and approval requirements can affect revenue and profitability.

          Pharmaceutical companies may face pricing pressure, while insurers and healthcare providers can be affected by changes in government healthcare programs and medical reimbursement policies.

          Patent Expirations, Clinical Trials, and Industry Concentration

          Drug manufacturers rely on successful research, regulatory approvals, and patent protection. When a major drug loses patent protection, generic competition can reduce sales and profit margins.

          Biotechnology companies face additional uncertainty because clinical trials can fail, regulatory decisions can be delayed, and research programs often require substantial funding. These developments can cause sharp price movements in specialized biotechnology ETFs.

          Concentration is another concern. A fund that relies heavily on a few large holdings may be affected disproportionately when one of those companies encounters financial or regulatory problems. Global funds also face currency and country-specific risks.

          Frequently Asked Questions About Healthcare ETFs

          Are Healthcare ETFs Good for Long-Term Investing?

          Healthcare ETFs can be suitable for long-term investors seeking exposure to pharmaceutical innovation, medical technology, biotechnology, and healthcare services. Demand for medical treatments and services is supported by factors such as aging populations and ongoing research.

          However, long-term industry growth does not guarantee strong investment returns. Valuations, competition, regulation, and company performance still matter. Broad funds such as XLV and VHT can provide sector diversification, while specialized funds carry more concentrated risks.

          Are Healthcare ETFs Defensive During a Recession?

          Healthcare is often considered a defensive sector because many medical treatments and services remain necessary during economic downturns. However, healthcare ETFs can still decline during market sell-offs.

          The level of resilience depends on the fund's holdings. Pharmaceutical and healthcare service companies may have different earnings patterns from biotechnology developers or medical device manufacturers. A healthcare ETF should not be treated as a guaranteed downside hedge.

          Do Healthcare ETFs Pay Dividends?

          Yes. Many healthcare ETFs distribute dividends from the income generated by their underlying holdings. However, distribution amounts, yields, and payment frequency vary by fund.

          Investors seeking dividend income should compare trailing yields, distribution history, and the businesses generating the underlying income. A higher yield alone does not guarantee a more reliable income stream or better total returns.

          Risk Warnings and Disclaimers
          You understand and acknowledge that there is a high degree of risk involved in trading. Following any strategies or investment methods may lead to potential losses. The content on the site is provided by our contributors and analysts for information purposes only. You are solely responsible for determining whether any trading assets, securities, strategy, or any other product is suitable for investing based on your own investment objectives and financial situation.
          Add to Favorites
          Share
          FastBull
          Copyright © 2026 FastBull Ltd

          728 RM B 7/F GEE LOK IND BLDG NO 34 HUNG TO RD KWUN TONG KLN HONG KONG

          TelegramInstagramTwitterfacebooklinkedin
          App Store Google Play Android Windows
          Products
          Charts

          Chats

          Q&A with Experts
          Screeners
          Economic Calendar
          Data
          Tools
          Membership
          Features
          Function
          Markets
          Copy Trading
          Latest Signals
          Contests
          24/7
          Analysis
          Education
          Company
          Careers
          About Us
          Contact Us
          Advertising
          Download FastBull
          Help Center
          Feedback
          User Agreement
          Privacy Policy
          Personal Information Protection Statement
          Business

          White Label

          Broker API

          Data API

          Web Plug-ins

          Poster Maker

          Affiliate Program

          Risk Disclosure

          The risk of loss in trading financial instruments such as stocks, FX, commodities, futures, bonds, ETFs and crypto can be substantial. You may sustain a total loss of the funds that you deposit with your broker. Therefore, you should carefully consider whether such trading is suitable for you in light of your circumstances and financial resources.

          No decision to invest should be made without thoroughly conducting due diligence by yourself or consulting with your financial advisors. Our web content might not suit you since we don't know your financial conditions and investment needs. Our financial information might have latency or contain inaccuracy, so you should be fully responsible for any of your trading and investment decisions. The company will not be responsible for your capital loss.

          Without getting permission from the website, you are not allowed to copy the website's graphics, texts, or trademarks. Intellectual property rights in the content or data incorporated into this website belong to its providers and exchange merchants.

          Not Logged In

          Log in to access more features

          Connect Broker
          Become a signal provider
          Help Center
          Customer Service
          Dark Mode
          Price Up/Down Colors

          Log In

          Sign Up

          Position
          Layout
          Fullscreen
          Default to Chart
          The chart page opens by default when you visit fastbull.com