• Trade
  • Markets
  • Copy
  • Contests
  • 24/7
  • Calendar
  • Q&A
  • Chats
Screeners
SYMBOL
LAST
BID
ASK
HIGH
LOW
NET CHG.
%CHG.
SPREAD
SOURCE
SPX
S&P 500 Index
6910.39
6910.39
6910.39
7198.67
6882.66
-265.44
-3.70%
--
--
DJI
Dow Jones Industrial Average
48147.33
48147.33
48147.33
49594.90
47998.86
-949.73
-1.93%
--
--
IXIC
NASDAQ Composite Index
22617.74
22617.74
22617.74
23837.76
22513.01
-1261.47
-5.28%
--
--
USDX
US Dollar Index
103.740
103.740
103.820
103.852
103.480
-0.097
-0.09%
--
--
EURUSD
Euro / US Dollar
1.09661
1.09661
1.09705
1.09996
1.09566
+0.00006
+ 0.01%
--
--
GBPUSD
Pound Sterling / US Dollar
1.30840
1.30840
1.30930
1.31286
1.30737
-0.00009
-0.01%
--
--
XAUUSD
Gold / US Dollar
3539.43
3539.43
3539.43
3636.65
3502.67
-86.63
-2.39%
--
--
WTI
Light Sweet Crude Oil
83.384
83.384
83.414
83.902
80.653
+0.342
+ 0.41%
--
--

Community Accounts

Signal Accounts
--
Profit Accounts
--
Loss Accounts
--
View More

Become a signal provider

Sell trading signals to earn additional income

View More

Guide to Copy Trading

Get started with ease and confidence

View More

Signal Accounts for Members

All Signal Accounts

Best Return
  • Best Return
  • Best P/L
  • Best MDD
Past 1W
  • Past 1W
  • Past 1M
  • Past 1Y

All Contests

  • All
  • Recommend
  • Stocks
  • Cryptocurrencies
  • Central Banks
  • Trump Updates
  • Featured News
Top News Only
Share

The Governor Of Dnipropetrovsk Oblast, Ukraine, Said That Five Regions In Ukraine Were Attacked By Russian Drone Strikes, Which Killed Two People And Injured 55

Share

S&P: We Expect Copper Prices To Remain Favorable, Supporting Zambia's Economic Growth And The Reduction Of Its Fiscal Deficit

Share

The Austrian Foreign Ministry Has Not Yet Confirmed The Identity Of The Attacker

Share

Austrian Foreign Ministry: The Website Of The Austrian Foreign Ministry Was Attacked, And The Attackers Obtained Contact Information Of Staff Members Of The Central Office And Diplomatic Missions Abroad

Share

The Russian Ministry Of Defense Stated That Drones Attacked Energy Facilities And Ships Serving The Ukrainian Army

Share

According To TASS, The Governor Of Russia's Leningrad Region Said That 49 Drones Were Shot Down Over The Region

Share

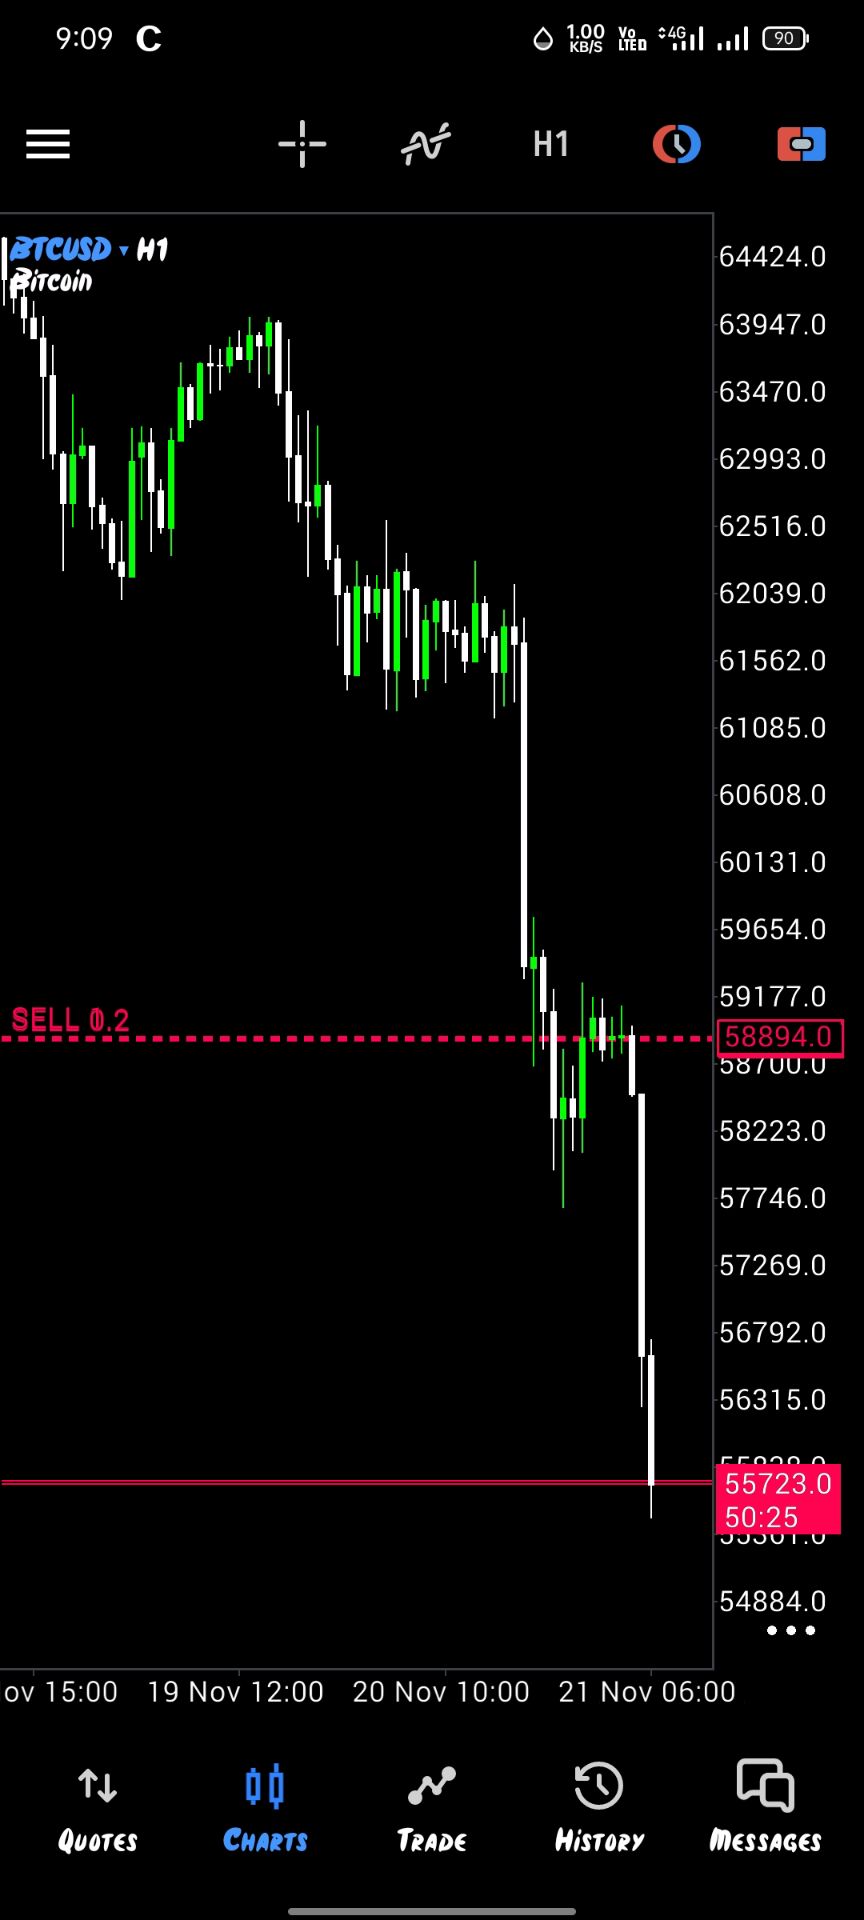
Bitcoin Fell Below $56,000, Down More Than 6% On The Day

Share

Bitcoin Fell Below $56,000, Down 5.12% On The Day

Share

Diplomats From Multiple Countries Have Stated That Nations Have Agreed To Further Consultations Within The Framework Of The United Nations To Develop Measures Regarding Lethal Autonomous Weapons By 2028

Share

Silver Prices Fell Below $37 Per Ounce In Grey Market Trading, Down 1% On The Day

Share

Bitcoin Fell Below $57,000, Down More Than 4% On The Day

Share

Bitcoin Fell Below $57,000, Down 3.42% On The Day

Share

The White House: Federal Contractors Must Immediately Inform The White House And Contracting Agencies Of Any Pending Or Future Requests From Congress Regarding The Contractor’s Communications Or Work With The Administration

Share

The White House: Trump Signed An Executive Order On “protecting Executive Branch Privileges And Improving The Efficiency Of Federal Contracts.”

Share

The European-Mediterranean Seismological Centre Reports That A 4.4-magnitude Earthquake Struck Off The East Coast Of The Kamchatka Peninsula In Russia At A Depth Of 88.9 Kilometers

Share

Copper Futures In The Grey Market Fell Below $5.60, Down 1.8% On The Day

Share

U.S. Treasury Secretary Bessenter: The IRS Will Take Tough Measures Against Companies That Exploit Tax Schemes

Share

U.S. Treasury Secretary Bessant Stated That Wall Street Has Been Peddling Abusive Tax Proposals

Share

Bitcoin Broke Through $59,000, Up 0.09% On The Day

Share

New York Crude Oil Broke Through $83 In Grey Market Trading, Rising More Than 1% On The Day

TIME
ACT
FCST
PREV
IMPACT
U.S. 10-Year TIPS Auction Avg. Yield

A:--

F: --

P: --

XAUUSD
  • XAUUSD
  • XAGUSD
  • WTI
  • USDX
Argentina Trade Balance (Oct)

A:--

F: --

P: --

XAUUSD
  • XAUUSD
  • XAGUSD
  • WTI
  • USDX
Richmond Federal Reserve President Barkin delivered a speech.
South Korea PPI MoM (Oct)

A:--

F: --

P: --
XAUUSD
  • XAUUSD
  • XAGUSD
  • WTI
  • USDX
Richmond Federal Reserve President Barkin delivered a speech.
U.S. Weekly Treasuries Held by Foreign Central Banks

A:--

F: --

P: --

USDX
  • USDX
  • XAUUSD
  • XAGUSD
  • WTI
Japan National CPI MoM (Oct)

A:--

F: --

P: --

USDJPY
  • USDJPY
  • XAUUSD
  • XAGUSD
  • WTI
Japan National CPI MoM (Not SA) (Oct)

A:--

F: --

P: --

USDJPY
  • USDJPY
  • XAUUSD
  • XAGUSD
  • WTI
Japan National Core CPI YoY (Oct)

A:--

F: --

P: --

USDJPY
  • USDJPY
  • XAUUSD
  • XAGUSD
  • WTI
Japan National CPI YoY (Oct)

A:--

F: --

P: --

USDJPY
  • USDJPY
  • XAUUSD
  • XAGUSD
  • WTI
Philadelphia Fed President Henry Paulson delivers a speech
U.K. GfK Consumer Confidence Index (Nov)

A:--

F: --

P: --

GBPUSD
  • GBPUSD
  • XAUUSD
  • XAGUSD
  • WTI
China, Mainland 5-Year Loan Prime Rate

A:--

F: --

P: --

XAUUSD
  • XAUUSD
  • XAGUSD
  • WTI
  • USDX
China, Mainland 1-Year Loan Prime Rate (LPR)

A:--

F: --

P: --

XAUUSD
  • XAUUSD
  • XAGUSD
  • WTI
  • USDX
Turkey Capacity Utilization (Nov)

A:--

F: --

P: --

XAUUSD
  • XAUUSD
  • XAGUSD
  • WTI
  • USDX
Turkey Consumer Confidence Index (Nov)

A:--

F: --

P: --

XAUUSD
  • XAUUSD
  • XAGUSD
  • WTI
  • USDX
Germany PPI MoM (Oct)

A:--

F: --

P: --

EURUSD
  • EURUSD
  • XAUUSD
  • XAGUSD
  • WTI
  • USDX
Germany PPI YoY (Oct)

A:--

F: --

P: --

EURUSD
  • EURUSD
  • XAUUSD
  • XAGUSD
  • WTI
  • USDX
U.K. Core Retail Sales YoY (SA) (Oct)

A:--

F: --

P: --
GBPUSD
  • GBPUSD
  • XAUUSD
  • XAGUSD
  • WTI
  • USDX
U.K. Retail Sales MoM (SA) (Oct)

A:--

F: --

P: --
GBPUSD
  • GBPUSD
  • XAUUSD
  • XAGUSD
  • WTI
  • USDX
U.K. Retail Sales YoY (SA) (Oct)

A:--

F: --

P: --
GBPUSD
  • GBPUSD
  • XAUUSD
  • XAGUSD
  • WTI
  • USDX
ECB President Lagarde Speaks
Mexico Retail Sales MoM (Sept)

A:--

F: --

P: --

XAUUSD
  • XAUUSD
  • XAGUSD
  • WTI
  • USDX
Canada Core Retail Sales MoM (SA) (Sept)

A:--

F: --

P: --
USDCAD
  • USDCAD
  • XAUUSD
  • XAGUSD
  • WTI
  • USDX
Canada Retail Sales MoM (SA) (Sept)

A:--

F: --

P: --
USDCAD
  • USDCAD
  • XAUUSD
  • XAGUSD
  • WTI
  • USDX
U.S. UMich Current Economic Conditions Index Final (Nov)

A:--

F: --

P: --

USDX
  • USDX
  • XAUUSD
  • XAGUSD
  • WTI
U.S. UMich 1-Year-Ahead Inflation Expectations Final (Nov)

A:--

F: --

P: --

USDX
  • USDX
  • XAUUSD
  • XAGUSD
  • WTI
U.S. UMich Consumer Expectations Index Final (Nov)

A:--

F: --

P: --

USDX
  • USDX
  • XAUUSD
  • XAGUSD
  • WTI
U.S. UMich Consumer Sentiment Index Final (Nov)

A:--

F: --

P: --

USDX
  • USDX
  • XAUUSD
  • XAGUSD
  • WTI
Euro Zone Consumer Confidence Index Prelim (Nov)

A:--

F: --

P: --

EURUSD
  • EURUSD
  • XAUUSD
  • XAGUSD
  • WTI
  • USDX
U.S. Weekly Total Oil Rig Count

A:--

F: --

P: --

WTI
  • WTI
  • XAUUSD
  • XAGUSD
  • USDX
U.S. Weekly Total Rig Count

A:--

F: --

P: --

WTI
  • WTI
  • XAUUSD
  • XAGUSD
  • USDX
Australia Composite PMI Prelim (Nov)

--

F: --

P: --

Australia Manufacturing PMI Prelim (Nov)

--

F: --

P: --

France Services PMI Prelim (SA) (Nov)

--

F: --

P: --

France Manufacturing PMI Prelim (Nov)

--

F: --

P: --

France Composite PMI Prelim (SA) (Nov)

--

F: --

P: --

Germany Composite PMI Prelim (SA) (Nov)

--

F: --

P: --

Germany Services PMI Prelim (SA) (Nov)

--

F: --

P: --

Germany Manufacturing PMI Prelim (SA) (Nov)

--

F: --

P: --

Euro Zone Composite PMI Prelim (SA) (Nov)

--

F: --

P: --

Euro Zone Services PMI Prelim (SA) (Nov)

--

F: --

P: --

Euro Zone Manufacturing PMI Prelim (SA) (Nov)

--

F: --

P: --

U.K. Composite PMI Prelim (Nov)

--

F: --

P: --

U.K. Services PMI Prelim (Nov)

--

F: --

P: --

U.K. Manufacturing PMI Prelim (Nov)

--

F: --

P: --

Mexico Economic Activity Index YoY (Sept)

--

F: --

P: --

Canada National Economic Confidence Index

--

F: --

P: --

U.S. Chicago Fed National Activity Index (Oct)

--

F: --

P: --

U.S. IHS Markit Manufacturing PMI Prelim (SA) (Nov)

--

F: --

P: --

U.S. IHS Markit Composite PMI Prelim (SA) (Nov)

--

F: --

P: --

U.S. IHS Markit Services PMI Prelim (SA) (Nov)

--

F: --

P: --

U.S. 2-Year Note Auction Avg. Yield

--

F: --

P: --

Japan Manufacturing PMI Prelim (SA) (Nov)

--

F: --

P: --

Germany IFO Business Climate Index (SA) (Nov)

--

F: --

P: --

Germany Ifo Business Expectations Index (SA) (Nov)

--

F: --

P: --

Germany Ifo Current Business Situation Index (SA) (Nov)

--

F: --

P: --

U.K. CBI Distributive Trades (Nov)

--

F: --

P: --

U.K. CBI Retail Sales Expectations Index (Nov)

--

F: --

P: --

U.S. Weekly Redbook Index YoY

--

F: --

P: --

U.S. FHFA House Price Index MoM (Sept)

--

F: --

P: --

Q&A with Experts
    • All
    • Chatrooms
    • Groups
    • Friends
    Sanjeev Ku flag
    Skylark
    @Sanjeev KuAll good. I also share my entries most times, but I've been quite busy with some stuff. That's why I don't really do analysis on the market.
    @Skylark bro i am talking about demo haha. suddenly flooding
    Rehan Mouz flag
    buy
    Areeba Mini❣️❣️ flag
    🤣🤣🎯🎯
    Areeba Mini❣️❣️ flag
    Areeba Mini❣️❣️ flag
    55000 TP 😎😎
    goldtrader flag
    还在聊黄金
    Nawhdir flag
    Nawhdir flag
    Nawhdir flag
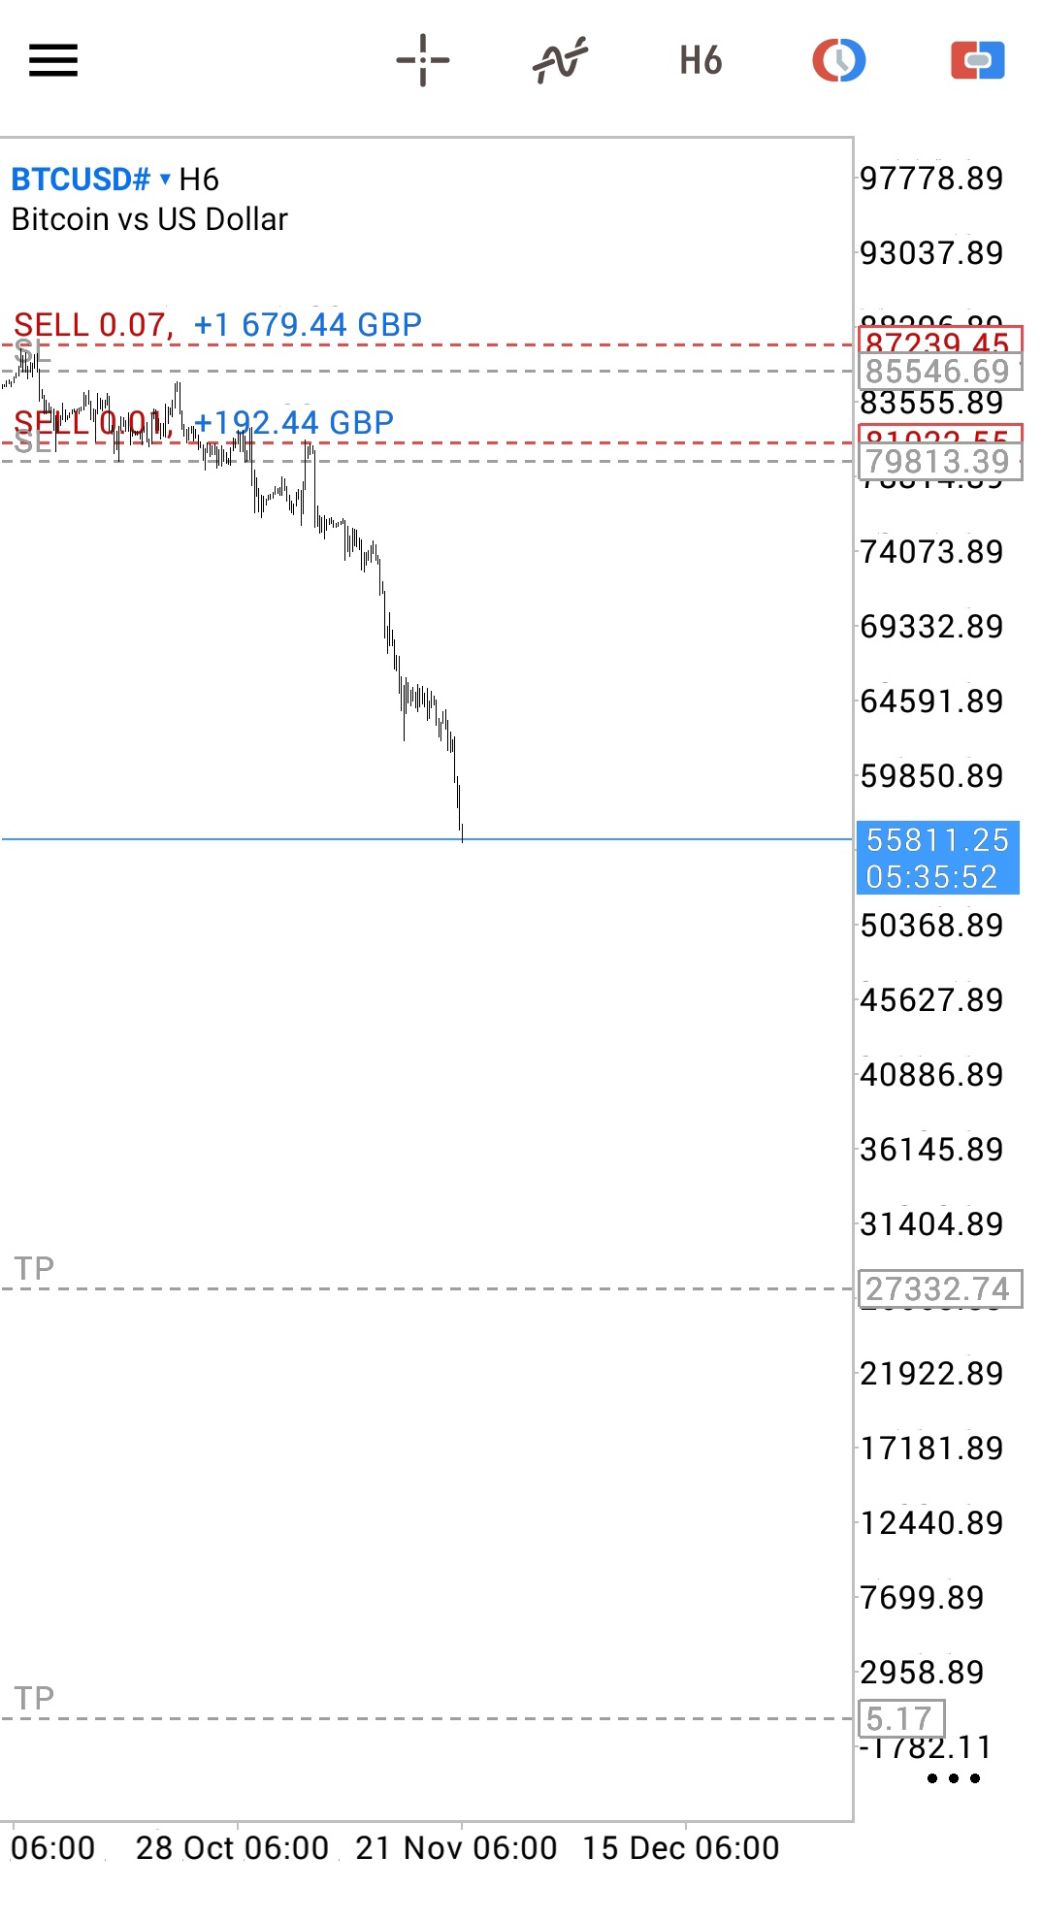
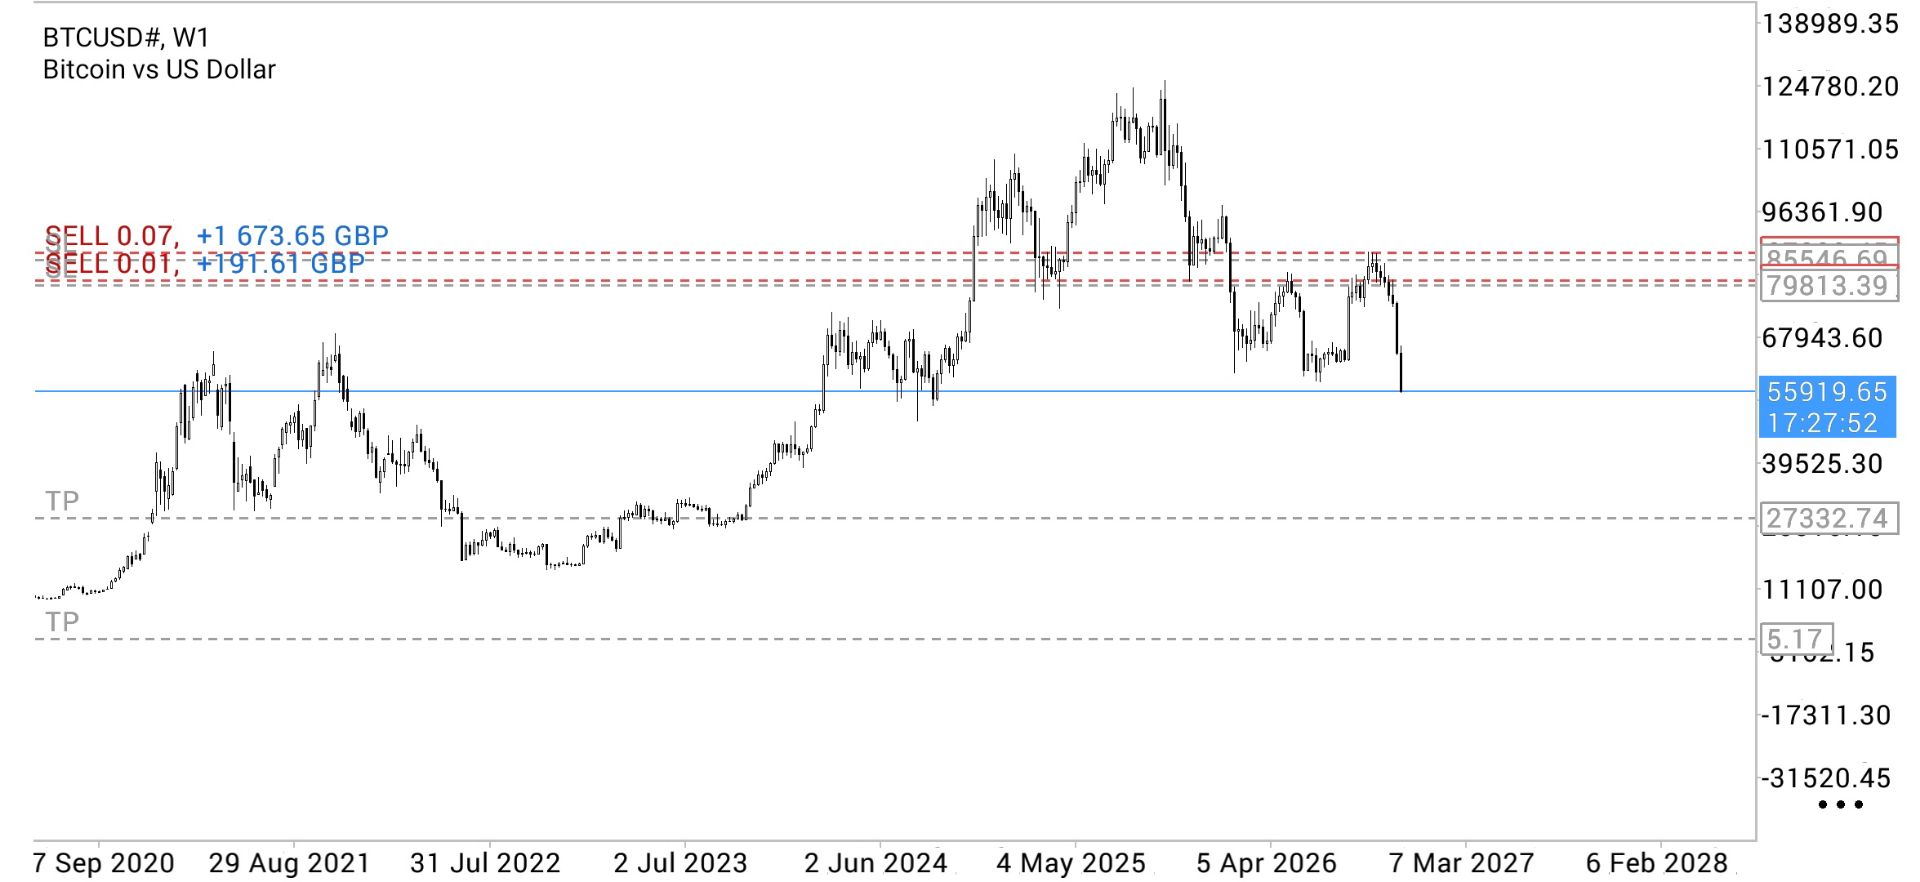
    $27K / $5 ?
    6079081 flag
    Nên nhớ khủng hoảng tài chính vàng là thứ được bán đầu để cứu các tài sản khác nhưng khi các tài sản khác bị bán tháo vàng sẽ được tìm kiếm để tru an
    Sanjeev Ku flag
    Sanjeev Ku
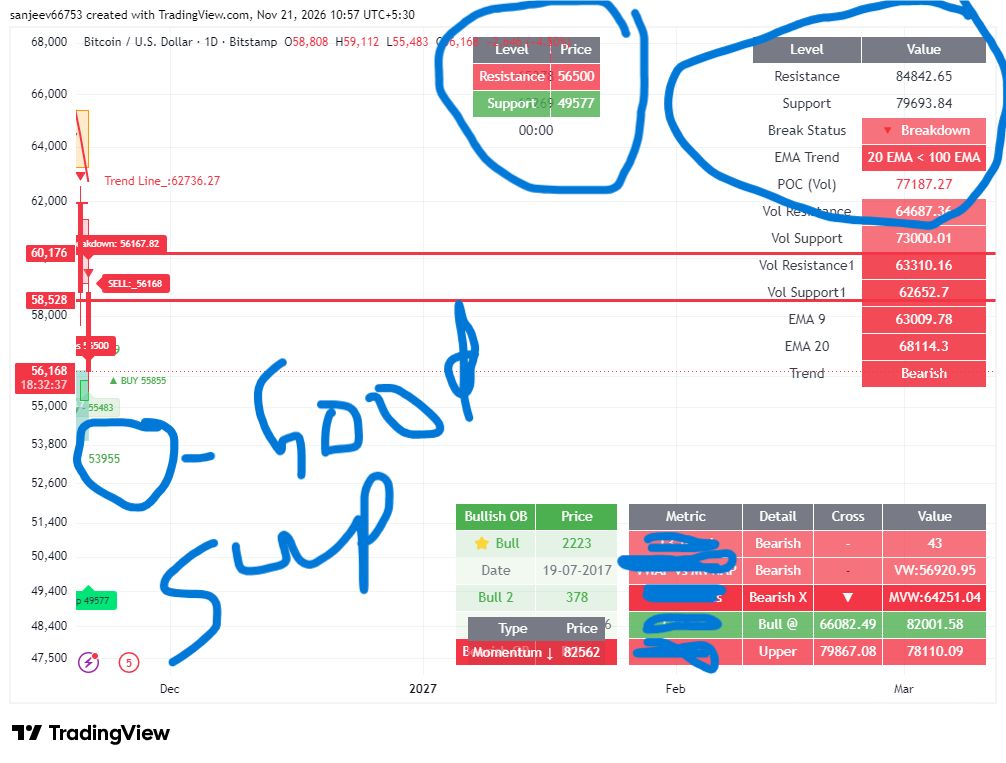
    58528 breaks aim 56179/53955.
    👍
    Sanjeev Ku flag
    Nawhdir
    $27K / $5 ?
    @Nawhdir bro 53955 breaks then 49577 beyond that dont have for now
    Sanjeev Ku flag
    Sanjeev Ku
    @Nawhdir bro 53955 breaks then 49577 beyond that dont have for now
    maybe then 5
    Sanjeev Ku flag
    institutional entry
    Areeba Mini❣️❣️ flag
    BTC...Next Target $38000🧐🧐
    Sanjeev Ku flag
    Sanjeev Ku
    from cmp support and resistance calculated
    Nawhdir flag
    6079081
    Nên nhớ khủng hoảng tài chính vàng là thứ được bán đầu để cứu các tài sản khác nhưng khi các tài sản khác bị bán tháo vàng sẽ được tìm kiếm để tru an
    @Pengunjung6079081remeber there is no theory
    Nawhdir flag
    Sanjeev Ku
    @Nawhdir bro 53955 breaks then 49577 beyond that dont have for now
    @Sanjeev Ku🤣🤣.We must exit on target before brokers maybe delete ctypo derivative from retail asset list 🤣🤣
    Nawhdir flag
    Sanjeev Ku
    maybe then 5
    @Sanjeev KuI want see crypto likely $0, some cents likes year 2009 🤣🤣
    Sanjeev Ku flag
    Nawhdir
    @Sanjeev Ku🤣🤣.We must exit on target before brokers maybe delete ctypo derivative from retail asset list 🤣🤣
    @Nawhdir bro lets wait for 49577 to 49111 if comes there will definately exit once 53900 is also an level i am watching
    Type here...
    Add Symbol or Code

      No matching data

      All
      Recommend
      Stocks
      Cryptocurrencies
      Central Banks
      Trump Updates
      Featured News
      • All
      • Russia-Ukraine Conflict
      • Middle East Flashpoint
      • All
      • Russia-Ukraine Conflict
      • Middle East Flashpoint
      Search
      Products

      Charts Free Forever

      Chats Q&A with Experts
      Screeners Economic Calendar Data Tools
      Membership Features
      Data Warehouse Market Trends Institutional Data Policy Rates Macro

      Market Trends

      Market Sentiment Order Book Forex Correlations

      Top Indicators

      Charts Free Forever
      Markets

      News

      24/7 Analysis Education

      Latest Views

      Latest Update

      Signals

      Copy Rankings Latest Signals Become a signal provider AI Rating
      Contests
      Brokers

      Overview Brokers Assessment Rankings Regulators News Claims
      Broker listing Forex Brokers Comparison Tool Live Spread Comparison Scam
      Q&A Complaint Scam Alert Videos Tips to Detect Scam
      More

      Business
      Events
      Careers About Us Advertising Help Center

      White Label

      Broker API

      Data API

      Web Plug-ins

      Affiliate Program

      Awards Institution Evaluation IB Seminar Salon Event Exhibition
      Vietnam Thailand Singapore Dubai
      Fans Party Investment Sharing Session
      FastBull Summit BrokersView Expo
      Recent Searches
        Top Searches
          Markets
          Analysis
          User
          24/7
          Economic Calendar
          Education
          Data
          • Names
          • Latest
          • Prev

          View All

          No data

          Scan to Download

          Faster Charts, Chat Faster!

          Download
          English
          • English
          • Español
          • العربية
          • Bahasa Indonesia
          • Bahasa Melayu
          • Tiếng Việt
          • ภาษาไทย
          • Français
          • Italiano
          • Türkçe
          • Русский язык
          • 简中
          • 繁中
          Open Account
          Search
          Products
          Charts Free Forever
          Markets
          News
          Signals

          Copy Rankings Latest Signals Become a signal provider AI Rating
          Contests
          Brokers

          Overview Brokers Assessment Rankings Regulators News Claims
          Broker listing Forex Brokers Comparison Tool Live Spread Comparison Scam
          Q&A Complaint Scam Alert Videos Tips to Detect Scam
          More

          Business
          Events
          Careers About Us Advertising Help Center

          White Label

          Broker API

          Data API

          Web Plug-ins

          Affiliate Program

          Awards Institution Evaluation IB Seminar Salon Event Exhibition
          Vietnam Thailand Singapore Dubai
          Fans Party Investment Sharing Session
          FastBull Summit BrokersView Expo

          Assets With Low Correlation to U.S. Equities for 2027

          zhan chen
          Summary:

          Discover assets with low correlation to U.S. equities in 2027. Compare gold, commodities, Treasury bonds, managed futures, and other portfolio diversifiers.

          Investors heavily exposed to U.S. equities may seek assets driven by different economic forces. Gold, commodities, Treasuries, and managed futures can diversify a portfolio because their returns do not always move with the S&P 500. However, low correlation does not guarantee gains when stocks decline.

          Assets With Low Correlation to U.S. Equities for 2027_1

          What Does Low Correlation to U.S. Equities Mean?

          Correlation measures how closely the returns of two investments move in relation to each other. Its coefficient ranges from -1 to +1:

          • +1: The assets have a perfectly positive linear relationship and move in the same direction.
          • 0: There is no linear relationship between their returns.
          • -1: The assets have a perfectly negative linear relationship and move in opposite directions.

          Assets with low or negative correlation to U.S. equities can reduce a portfolio's dependence on stock market performance. If an investor holds only U.S. stocks, a broad market decline can affect most of the portfolio at once. Adding investments with different return drivers may help reduce the impact.

          Low correlation is not the same as negative correlation. An asset with a correlation close to zero does not necessarily rise when stocks fall; its returns may simply follow different factors. Correlation can also change with inflation, interest rates, liquidity, and market stress.

          For a meaningful comparison, use the same measurement period, return frequency, and currency. A correlation based on monthly returns over ten years may look very different from one based on weekly returns over the past year. A zero correlation also means no linear relationship, not necessarily that two assets have no connection at all.

          Which Assets Have Low Correlation to U.S. Equities?

          Several asset classes have historically offered relatively low correlation with U.S. stocks. Their diversification potential comes from different sources of demand, economic sensitivities, and investment strategies. They do not all provide the same level of protection during market downturns.

          Gold and Precious Metals

          Gold is widely used to diversify equity portfolios. Unlike stocks, which depend heavily on corporate earnings and economic growth, gold is influenced by investment demand, central bank purchases, real interest rates, currency movements, and geopolitical uncertainty.

          These different price drivers can make gold less correlated with U.S. equities. Its diversification role can become more visible during financial stress, when investors seek liquid assets outside traditional financial markets.

          Historical examples illustrate the difference. The World Gold Council reports that during the fourth-quarter 2018 equity selloff, the MSCI USA Index fell 14%, while gold rose 8%. During the first-quarter 2020 COVID-19 selloff, the MSCI USA Index fell 20% and broad commodities declined 23%, while gold gained 6%. These episodes show that gold can behave differently from both equities and broad commodity markets.

          Other precious metals do not necessarily behave like gold. Silver, for example, has greater exposure to industrial demand, making it more sensitive to economic growth and manufacturing activity. Investors should not assume that all precious metals provide the same defensive characteristics. See the World Gold Council's 2026 analysis of gold and portfolio diversification.

          Commodities

          Broad commodity investments provide exposure to resources such as crude oil, natural gas, industrial metals, and agricultural products. Their prices are influenced by supply and demand, production disruptions, inventory levels, weather, and geopolitical events rather than corporate earnings alone.

          This can create diversification opportunities. Rising energy prices or supply shortages may support some commodity returns even when parts of the stock market are struggling. Commodities can also respond differently from equities during unexpected inflation.

          However, commodities are not consistently low-correlated with stocks. During strong economic growth, both commodity demand and corporate earnings may rise. During a recession, weaker industrial activity can push commodity prices and equities lower at the same time. Different commodities also have different drivers, so a broad index, oil, and agricultural products should not be treated as interchangeable.

          Managed Futures

          Managed futures strategies, often run by commodity trading advisors (CTAs), trade futures across markets such as equities, bonds, currencies, and commodities. Many use systematic trend-following models to identify sustained price movements and take long or short positions as trends develop.

          This flexibility can allow a strategy to pursue returns from both rising and falling markets, although results depend on the models, markets traded, and timing. Fidelity Investments reported that the SG Trend Index had a correlation of -0.12 with equities and 0.01 with bonds from January 1, 2000, to March 30, 2025. In that analysis, equities were represented by the S&P 500 and bonds by the Bloomberg U.S. Aggregate Bond Index.

          The figures describe one benchmark over a specific historical period, not every managed futures fund. Trend-following strategies can also suffer when markets reverse sharply or move sideways. Fees, leverage, derivatives exposure, and drawdowns should be reviewed before investing. See Fidelity's research on managed futures as a portfolio diversifier.

          U.S. Treasury Bonds

          U.S. Treasuries can diversify equities because their returns respond to interest rates, inflation expectations, and demand for government debt rather than company earnings. During a growth scare, investors may seek Treasuries as expectations for interest-rate cuts increase. Falling yields can support bond prices while stocks weaken.

          This relationship is not constant. Long-term Treasuries are sensitive to changes in yields and can fall alongside equities when inflation pushes rates higher. Short-term Treasuries have less interest-rate sensitivity, but also less potential price appreciation.

          Cash and Cash Equivalents

          Cash, money market funds, and short-term Treasury bills generally have low correlation with equities and provide liquidity during volatile markets. Their main role is capital stability and ready access to funds, rather than long-term growth. If the yield on cash falls below inflation, its purchasing power declines.

          Real Estate, Farmland, and Infrastructure

          Direct real estate, farmland, and infrastructure can generate income from rents, crop production, usage fees, or long-term contracts. Their returns may depend on property supply, agricultural conditions, regulated revenues, and demand for essential services rather than listed-company earnings.

          The investment structure matters. Publicly traded REITs and listed infrastructure companies trade on stock exchanges and can fall during broad market selloffs. Private assets may show smoother reported returns because they are valued less frequently, but appraisal lags can understate volatility and make correlations with public markets appear lower. Fees, leverage, and limited liquidity also matter.

          Which Investments May Not Diversify as Much as Expected?

          REITs and High-Yield Bonds

          Publicly traded REITs are equity securities, so their prices respond to interest rates, financing costs, property valuations, and investor sentiment. They can fall with the broader stock market even when rental income remains stable. High-yield bonds carry meaningful credit risk and are sensitive to recession fears and widening credit spreads, making them less defensive than high-quality government bonds.

          Private Equity and Private Credit

          Private market returns may look less volatile because holdings are valued periodically rather than continuously. Appraisal lags and valuation smoothing can make reported correlations appear lower than the underlying economic relationship. These investments remain exposed to business performance, borrowing costs, refinancing conditions, and credit quality. Limited liquidity can also make it difficult to exit during market stress.

          Cryptocurrency

          Bitcoin and other cryptocurrencies may sometimes show low correlation with U.S. equities, but the relationship can change quickly. Prices are influenced by liquidity, risk appetite, regulation, and crypto-specific developments. During risk-off periods, cryptocurrencies can fall alongside technology stocks and other high-volatility assets, so they should not be treated as dependable downside hedges.

          Does Correlation Change During Different Market Conditions?

          Yes. Correlation changes as the dominant economic shock changes. During growth scares, high-quality Treasuries may rise as investors expect rate cuts. During inflation or supply shocks, stocks and bonds can fall together as yields rise, while some commodities may benefit from supply constraints and higher input prices.

          Liquidity can also cause correlations to rise temporarily. When investors face margin calls or need cash, they may sell assets across several categories at once. A low long-term average correlation therefore does not guarantee protection during a severe selloff.

          Recent data illustrates why the measurement period matters. PGIM reported that, over a five-year lookback using monthly returns through September 2026, the correlation with the S&P 500 was about 0.15 for the Bloomberg Commodity Index and about 0.60 for the Bloomberg U.S. Aggregate Bond Total Return Index. These are historical readings, not forecasts for 2027. See PGIM's November 2026 analysis of commodity diversification.

          How to Choose Low-Correlation Assets for a 2027 Portfolio?

          Compare Rolling Correlation and Volatility

          Do not rely on one long-term correlation figure. Compare rolling one-year, three-year, and five-year correlations with the S&P 500, then review volatility, maximum drawdown, and performance during past declines. This helps show whether an asset has remained a diversifier across different market environments.

          Consider Liquidity, Costs, and Risks

          Review fees, trading costs, leverage, tax treatment, redemption limits, and the liquidity of the underlying assets. A low correlation is less useful if an investment is expensive to hold or cannot be sold when funds are needed.

          Combine Different Return Drivers

          Avoid relying on one alternative asset to offset equity risk. Combining investments influenced by interest rates, inflation, commodity supply, and trend-following strategies may create a more balanced portfolio. The allocation should reflect investment goals, risk tolerance, time horizon, and each asset's intended role.

          Risk Warnings and Disclaimers
          You understand and acknowledge that there is a high degree of risk involved in trading. Following any strategies or investment methods may lead to potential losses. The content on the site is provided by our contributors and analysts for information purposes only. You are solely responsible for determining whether any trading assets, securities, strategy, or any other product is suitable for investing based on your own investment objectives and financial situation.
          Add to Favorites
          Share
          FastBull
          Copyright © 2026 FastBull Ltd

          728 RM B 7/F GEE LOK IND BLDG NO 34 HUNG TO RD KWUN TONG KLN HONG KONG

          TelegramInstagramTwitterfacebooklinkedin
          App Store Google Play Android Windows
          Products
          Charts

          Chats

          Q&A with Experts
          Screeners
          Economic Calendar
          Data
          Tools
          Membership
          Features
          Function
          Markets
          Copy Trading
          Latest Signals
          Contests
          24/7
          Analysis
          Education
          Company
          Careers
          About Us
          Contact Us
          Advertising
          Download FastBull
          Help Center
          Feedback
          User Agreement
          Privacy Policy
          Personal Information Protection Statement
          Business

          White Label

          Broker API

          Data API

          Web Plug-ins

          Poster Maker

          Affiliate Program

          Risk Disclosure

          The risk of loss in trading financial instruments such as stocks, FX, commodities, futures, bonds, ETFs and crypto can be substantial. You may sustain a total loss of the funds that you deposit with your broker. Therefore, you should carefully consider whether such trading is suitable for you in light of your circumstances and financial resources.

          No decision to invest should be made without thoroughly conducting due diligence by yourself or consulting with your financial advisors. Our web content might not suit you since we don't know your financial conditions and investment needs. Our financial information might have latency or contain inaccuracy, so you should be fully responsible for any of your trading and investment decisions. The company will not be responsible for your capital loss.

          Without getting permission from the website, you are not allowed to copy the website's graphics, texts, or trademarks. Intellectual property rights in the content or data incorporated into this website belong to its providers and exchange merchants.

          Not Logged In

          Log in to access more features

          Connect Broker
          Become a signal provider
          Help Center
          Customer Service
          Dark Mode
          Price Up/Down Colors

          Log In

          Sign Up

          Position
          Layout
          Fullscreen
          Default to Chart
          The chart page opens by default when you visit fastbull.com