• Trade
  • Markets
  • Copy
  • Contests
  • News
  • 24/7
  • Calendar
  • Q&A
  • Chats
Trending
Screeners
SYMBOL
LAST
BID
ASK
HIGH
LOW
NET CHG.
%CHG.
SPREAD
SPX
S&P 500 Index
6827.42
6827.42
6827.42
6899.86
6801.80
-73.58
-1.07%
--
DJI
Dow Jones Industrial Average
48458.04
48458.04
48458.04
48886.86
48334.10
-245.98
-0.51%
--
IXIC
NASDAQ Composite Index
23195.16
23195.16
23195.16
23554.89
23094.51
-398.69
-1.69%
--
USDX
US Dollar Index
97.950
98.030
97.950
98.500
97.950
-0.370
-0.38%
--
EURUSD
Euro / US Dollar
1.17394
1.17409
1.17394
1.17496
1.17192
+0.00011
+ 0.01%
--
GBPUSD
Pound Sterling / US Dollar
1.33707
1.33732
1.33707
1.33997
1.33419
-0.00148
-0.11%
--
XAUUSD
Gold / US Dollar
4299.39
4299.39
4299.39
4353.41
4257.10
+20.10
+ 0.47%
--
WTI
Light Sweet Crude Oil
57.233
57.485
57.233
58.011
56.969
-0.408
-0.71%
--

Community Accounts

Signal Accounts
--
Profit Accounts
--
Loss Accounts
--
View More

Become a signal provider

Sell trading signals to earn additional income

View More

Guide to Copy Trading

Get started with ease and confidence

View More

Signal Accounts for Members

All Signal Accounts

Best Return
  • Best Return
  • Best P/L
  • Best MDD
Past 1W
  • Past 1W
  • Past 1M
  • Past 1Y

All Contests

  • All
  • Trump Updates
  • Recommend
  • Stocks
  • Cryptocurrencies
  • Central Banks
  • Featured News
Top News Only
Share

Norwegian Nobel Committee: Calls On The Belarusian Authorities To Release All Political Prisoners

Share

Norwegian Nobel Committee: His Freedom Is A Deeply Welcome And Long-Awaited Moment

Share

Ukraine Says It Received 114 Prisoners From Belarus

Share

USA Embassy In Lithuania: Maria Kalesnikava Is Not Going To Vilnius

Share

USA Embassy In Lithuania: Other Prisoners Are Being Sent From Belarus To Ukraine

Share

Ukraine President Zelenskiy: Five Ukrainians Released By Belarus In US-Brokered Deal

Share

USA Vilnius Embassy: USA Stands Ready For "Additional Engagement With Belarus That Advances USA Interests"

Share

USA Vilnius Embassy: Belarus, USA, Other Citizens Among The Prisoners Released Into Lithuania

Share

USA Vilnius Embassy: USA Will Continue Diplomatic Efforts To Free The Remaining Political Prisoners In Belarus

Share

USA Vilnius Embassy: Belarus Releases 123 Prisoners Following Meeting Of President Trump's Envoy Coale And Belarus President Lukashenko

Share

USA Vilnius Embassy: Masatoshi Nakanishi, Aliaksandr Syrytsa Are Among The Prisoners Released By Belarus

Share

USA Vilnius Embassy: Maria Kalesnikava And Viktor Babaryka Are Among The Prisoners Released By Belarus

Share

USA Vilnius Embassy: Nobel Peace Prize Laureate Ales Bialiatski Is Among The Prisoners Released By Belarus

Share

Belarusian Presidential Administration Telegram Channel: Lukashenko Has Pardoned 123 Prisoners As Part Of Deal With US

Share

Two Local Syrian Officials: Joint US-Syrian Military Patrol In Central Syria Came Under Fire From Unknown Assailants

Share

Israeli Military Says It Targeted 'Key Hamas Terrorist' In Gaza City

Share

Rwanda's Actions In Eastern Drc Are A Clear Violation Of Washington Accords Signed By President Trump - Secretary Of State Rubio

Share

Israeli Military Issues Evacuation Warning In Southern Lebanon Village Ahead Of Strike - Spokesperson On X

Share

Belarusian State Media Cites US Envoy Coale As Saying He Discussed Ukraine And Venezuela With Lukashenko

Share

Belarusian State Media Cites US Envoy Coale As Saying That US Removes Sanctions On Belarusian Potassium

TIME
ACT
FCST
PREV
U.K. Trade Balance Non-EU (SA) (Oct)

A:--

F: --

P: --

U.K. Trade Balance (Oct)

A:--

F: --

P: --

U.K. Services Index MoM

A:--

F: --

P: --

U.K. Construction Output MoM (SA) (Oct)

A:--

F: --

P: --

U.K. Industrial Output YoY (Oct)

A:--

F: --

P: --

U.K. Trade Balance (SA) (Oct)

A:--

F: --

P: --

U.K. Trade Balance EU (SA) (Oct)

A:--

F: --

P: --

U.K. Manufacturing Output YoY (Oct)

A:--

F: --

P: --

U.K. GDP MoM (Oct)

A:--

F: --

P: --

U.K. GDP YoY (SA) (Oct)

A:--

F: --

P: --

U.K. Industrial Output MoM (Oct)

A:--

F: --

P: --

U.K. Construction Output YoY (Oct)

A:--

F: --

P: --

France HICP Final MoM (Nov)

A:--

F: --

P: --

China, Mainland Outstanding Loans Growth YoY (Nov)

A:--

F: --

P: --

China, Mainland M2 Money Supply YoY (Nov)

A:--

F: --

P: --

China, Mainland M0 Money Supply YoY (Nov)

A:--

F: --

P: --

China, Mainland M1 Money Supply YoY (Nov)

A:--

F: --

P: --

India CPI YoY (Nov)

A:--

F: --

P: --

India Deposit Gowth YoY

A:--

F: --

P: --

Brazil Services Growth YoY (Oct)

A:--

F: --

P: --

Mexico Industrial Output YoY (Oct)

A:--

F: --

P: --

Russia Trade Balance (Oct)

A:--

F: --

P: --

Philadelphia Fed President Henry Paulson delivers a speech
Canada Building Permits MoM (SA) (Oct)

A:--

F: --

P: --

Canada Wholesale Sales YoY (Oct)

A:--

F: --

P: --

Canada Wholesale Inventory MoM (Oct)

A:--

F: --

P: --

Canada Wholesale Inventory YoY (Oct)

A:--

F: --

P: --

Canada Wholesale Sales MoM (SA) (Oct)

A:--

F: --

P: --

Germany Current Account (Not SA) (Oct)

A:--

F: --

P: --

U.S. Weekly Total Rig Count

A:--

F: --

P: --

U.S. Weekly Total Oil Rig Count

A:--

F: --

P: --

Japan Tankan Large Non-Manufacturing Diffusion Index (Q4)

--

F: --

P: --

Japan Tankan Small Manufacturing Outlook Index (Q4)

--

F: --

P: --

Japan Tankan Large Non-Manufacturing Outlook Index (Q4)

--

F: --

P: --

Japan Tankan Large Manufacturing Outlook Index (Q4)

--

F: --

P: --

Japan Tankan Small Manufacturing Diffusion Index (Q4)

--

F: --

P: --

Japan Tankan Large Manufacturing Diffusion Index (Q4)

--

F: --

P: --

Japan Tankan Large-Enterprise Capital Expenditure YoY (Q4)

--

F: --

P: --

U.K. Rightmove House Price Index YoY (Dec)

--

F: --

P: --

China, Mainland Industrial Output YoY (YTD) (Nov)

--

F: --

P: --

China, Mainland Urban Area Unemployment Rate (Nov)

--

F: --

P: --

Saudi Arabia CPI YoY (Nov)

--

F: --

P: --

Euro Zone Industrial Output YoY (Oct)

--

F: --

P: --

Euro Zone Industrial Output MoM (Oct)

--

F: --

P: --

Canada Existing Home Sales MoM (Nov)

--

F: --

P: --

Euro Zone Total Reserve Assets (Nov)

--

F: --

P: --

U.K. Inflation Rate Expectations

--

F: --

P: --

Canada National Economic Confidence Index

--

F: --

P: --

Canada New Housing Starts (Nov)

--

F: --

P: --

U.S. NY Fed Manufacturing Employment Index (Dec)

--

F: --

P: --

U.S. NY Fed Manufacturing Index (Dec)

--

F: --

P: --

Canada Core CPI YoY (Nov)

--

F: --

P: --

Canada Manufacturing Unfilled Orders MoM (Oct)

--

F: --

P: --

Canada Manufacturing New Orders MoM (Oct)

--

F: --

P: --

Canada Core CPI MoM (Nov)

--

F: --

P: --

Canada Manufacturing Inventory MoM (Oct)

--

F: --

P: --

Canada CPI YoY (Nov)

--

F: --

P: --

Canada CPI MoM (Nov)

--

F: --

P: --

Canada CPI YoY (SA) (Nov)

--

F: --

P: --

Canada Core CPI MoM (SA) (Nov)

--

F: --

P: --

Q&A with Experts
    • All
    • Chatrooms
    • Groups
    • Friends
    Connecting
    .
    .
    .
    Type here...
    Add Symbol or Code

      No matching data

      All
      Trump Updates
      Recommend
      Stocks
      Cryptocurrencies
      Central Banks
      Featured News
      • All
      • Russia-Ukraine Conflict
      • Middle East Flashpoint
      • All
      • Russia-Ukraine Conflict
      • Middle East Flashpoint
      Search
      Products

      Charts Free Forever

      Chats Q&A with Experts
      Screeners Economic Calendar Data Tools
      Membership Features
      Data Warehouse Market Trends Institutional Data Policy Rates Macro

      Market Trends

      Market Sentiment Order Book Forex Correlations

      Top Indicators

      Charts Free Forever
      Markets

      News

      News Analysis 24/7 Columns Education
      From Institutions From Analysts
      Topics Columnists

      Latest Views

      Latest Views

      Trending Topics

      Top Columnists

      Latest Update

      Signals

      Copy Rankings Latest Signals Become a signal provider AI Rating
      Contests
      Brokers

      Overview Brokers Assessment Rankings Regulators News Claims
      Broker listing Forex Brokers Comparison Tool Live Spread Comparison Scam
      Q&A Complaint Scam Alert Videos Tips to Detect Scam
      More

      Business
      Events
      Careers About Us Advertising Help Center

      White Label

      Data API

      Web Plug-ins

      Affiliate Program

      Awards Institution Evaluation IB Seminar Salon Event Exhibition
      Vietnam Thailand Singapore Dubai
      Fans Party Investment Sharing Session
      FastBull Summit BrokersView Expo
      Recent Searches
        Top Searches
          Markets
          News
          Analysis
          User
          24/7
          Economic Calendar
          Education
          Data
          • Names
          • Latest
          • Prev

          View All

          No data

          Scan to Download

          Faster Charts, Chat Faster!

          Download App
          English
          • English
          • Español
          • العربية
          • Bahasa Indonesia
          • Bahasa Melayu
          • Tiếng Việt
          • ภาษาไทย
          • Français
          • Italiano
          • Türkçe
          • Русский язык
          • 简中
          • 繁中
          Open Account
          Search
          Products
          Charts Free Forever
          Markets
          News
          Signals

          Copy Rankings Latest Signals Become a signal provider AI Rating
          Contests
          Brokers

          Overview Brokers Assessment Rankings Regulators News Claims
          Broker listing Forex Brokers Comparison Tool Live Spread Comparison Scam
          Q&A Complaint Scam Alert Videos Tips to Detect Scam
          More

          Business
          Events
          Careers About Us Advertising Help Center

          White Label

          Data API

          Web Plug-ins

          Affiliate Program

          Awards Institution Evaluation IB Seminar Salon Event Exhibition
          Vietnam Thailand Singapore Dubai
          Fans Party Investment Sharing Session
          FastBull Summit BrokersView Expo

          Amid Bitcoin Hype, Seasoned Trader Predicts Sudden Drop To This Level

          NewsBTC
          Solana / Tether
          -0.03%
          1inch / Tether
          -0.39%
          Vaulta / Tether
          +0.11%
          AAVE / Tether
          -0.10%

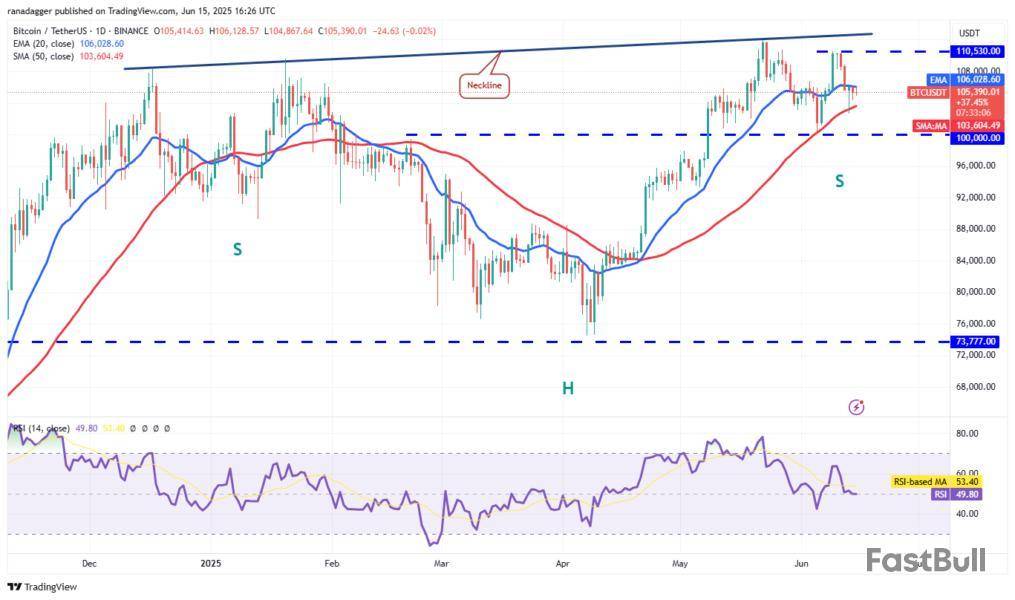
          Bitcoin is at a crossroads again. Prices have been bouncing between $61,000 and $104,000 for about seven months. That range looks a lot like the $31,000–$64,000 sideways move before the sharp drop in early 2022. Traders and analysts are split over whether history is about to repeat itself or if fresh demand will keep Bitcoin aloft.

          Price Stuck In Familiar Range

          According to reports, Bitcoin’s stretch from $61k to $104k mirrors the 2020–2021 “distribution zone” when it traded between $31,000 and $64,000 for nearly a year. Back then, the slide came fast: Bitcoin peaked around $69,000 in November 2021, then sank to roughly $15,600 by November 2022. That was a nearly 78% plunge.

          Breakouts Keep Falling Flat

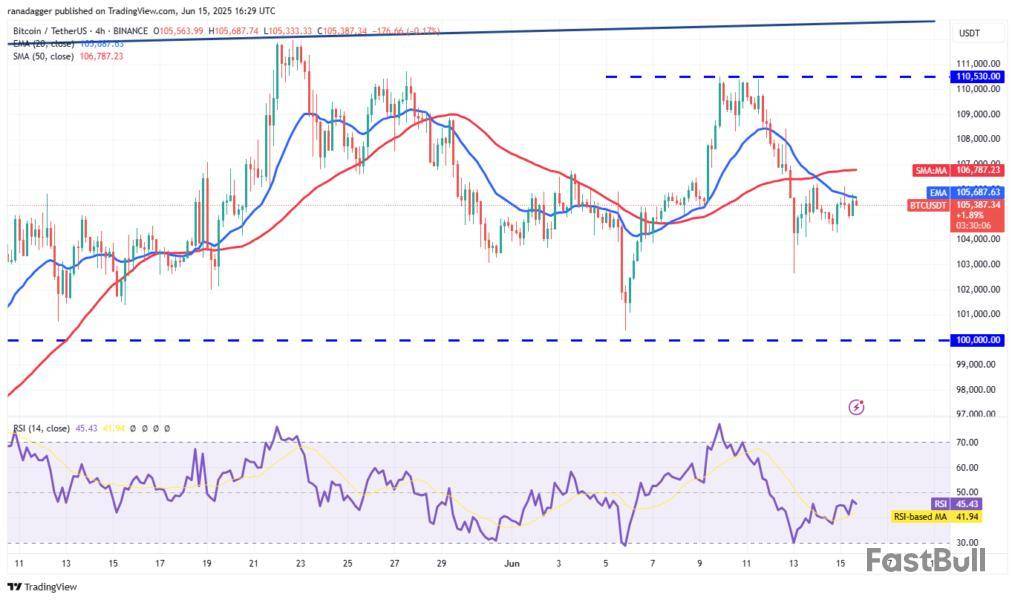
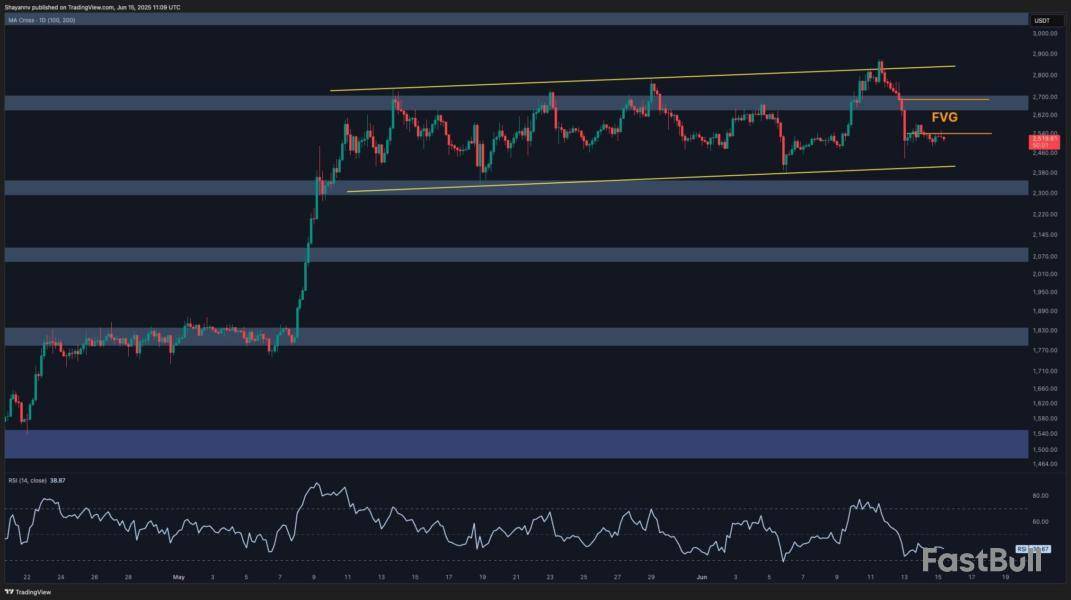
          Based on analysis from Michaël van de Poppe, Bitcoin tried and failed to stay above the $106k level this month. His chart showed a quick rejection at that barrier, triggering long‑side liquidations. The price slipped back to the $104k–$105k zone after the failed push higher. Traders see each unsuccessful breakout as a warning sign of distribution.

          Peter Brandt
          @PeterLBrandt

          November 2021 all over again? pic.twitter.com/lIA6QFhD9S

          Jun 14, 2025

          Risk Of Steep Slide

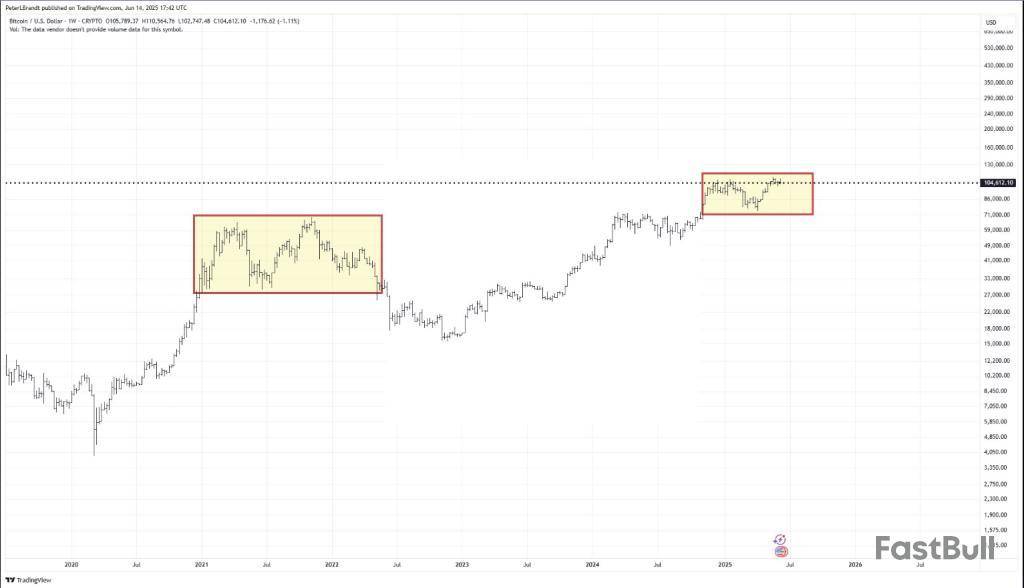
          According to veteran trader Peter Brandt, strong fundamentals often shine brightest right before a market top. He pointed out that if today’s setup leads to a similar 78% drop from the $105k band, Bitcoin could fall toward $23,600. His simple math recalls last cycle’s move from around $69k down to $15,500.Growing Demand Meets Technical Barriers

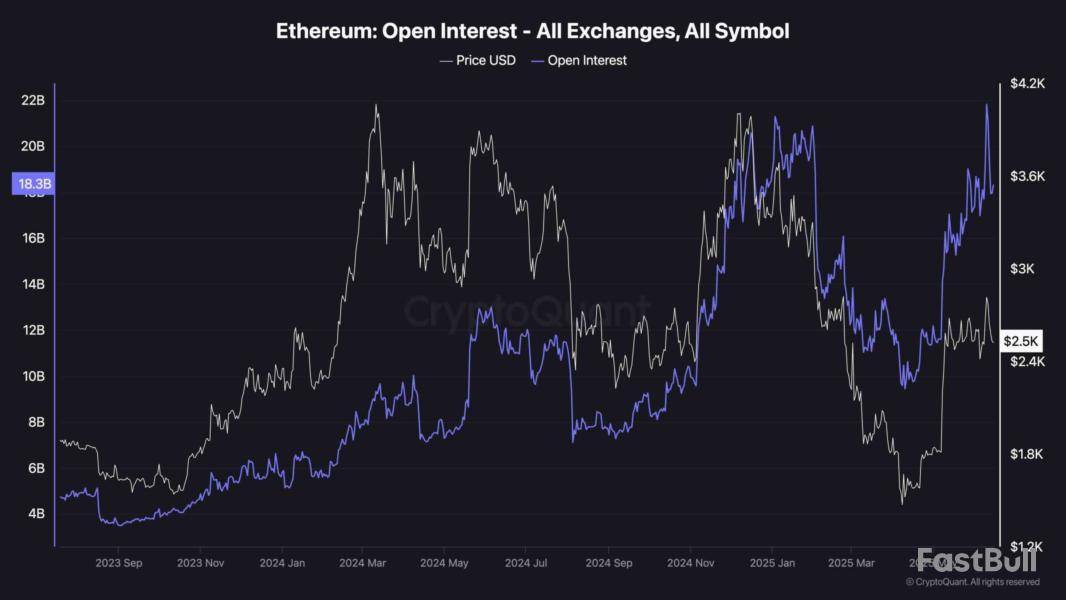
          Based on reports of spot ETFs and growing buys by institutions and governments, some believe the floor is firmer now. Huge investment flows into Bitcoin have never been higher. Yet technical hurdles remain. The inability to clear $105k makes some analysts cautious.Long Term Signals Still Bullish

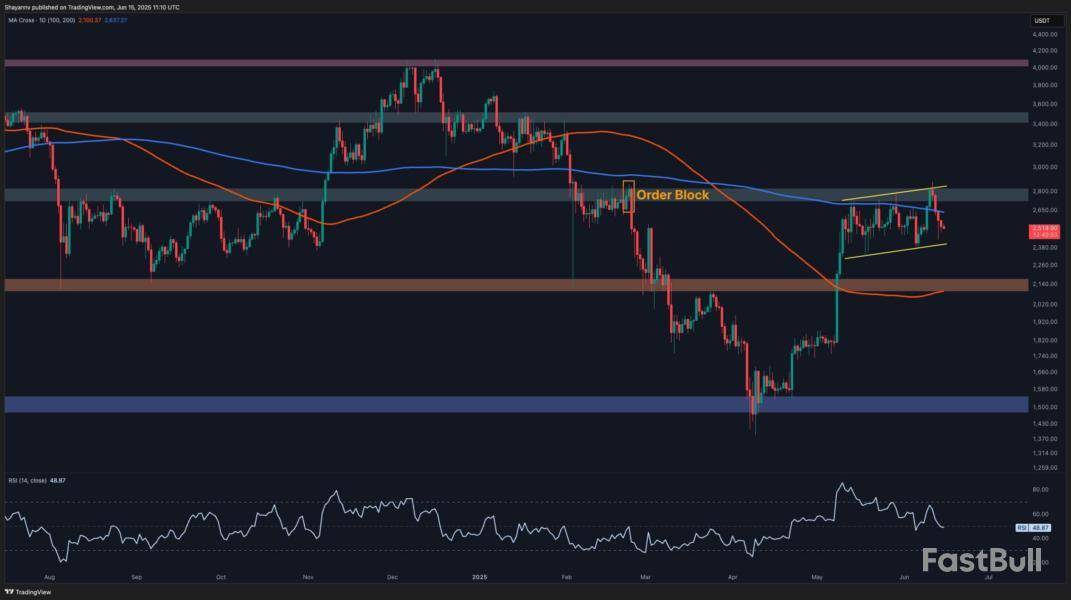
          Trader Tardigrade noted that Bitcoin’s 50‑day and 200‑day simple moving averages recently formed a golden cross. In past cycles, that pattern led to gains of 50%, 125%, and 65%. It points to a possible rally if buyers step in around current levels.What It Means For Investors

          Bitcoin’s tug‑of‑war between caution and optimism is clear. On one side, pattern watchers warn of a big drop if support breaks. On the other, strong hands from big players may cushion any slide and spark a rally. Investors should keep an eye on $104k–$105k for signs of weakness or strength.

          A break below could open the door to a move toward $23,500. Conversely, a clean break above $106k might signal the next leg up. Regardless, volatility looks set to stay high, so risk management remains key.

          Featured image from Imagen, chart from TradingView

          Risk Warnings and Disclaimers
          You understand and acknowledge that there is a high degree of risk involved in trading. Following any strategies or investment methods may lead to potential losses. The content on the site is provided by our contributors and analysts for information purposes only. You are solely responsible for determining whether any trading assets, securities, strategy, or any other product is suitable for investing based on your own investment objectives and financial situation.
          Add to Favorites
          Share

          Bitcoin holds $105K as HYPE, AAVE, BCH, OKB aim to lead altcoins higher

          Cointelegraph
          Solana / Tether
          -0.03%
          1inch / Tether
          -0.39%
          Vaulta / Tether
          +0.11%
          AAVE / Tether
          -0.10%

          Key points:

          • A week of solid inflows into the spot Bitcoin ETFs improves the prospects of a rally toward $110,000.

          • HYPE, BCH, AAVE, and OKB could march higher if Bitcoin sustains above $105,000.

          Bitcoin is forming a Doji candlestick pattern on the weekly chart, indicating indecision between buyers and sellers. Despite the near-term uncertainty, analysts remain bullish on Bitcoin’s prospects in 2025, expecting a rally from $140,000 to $270,000.

          Another positive sign is that the geopolitical turmoil caused by the conflict between Israel and Iran did not create panic among investors. According to Farside Investors’ data, US-based spot Bitcoin exchange-traded funds witnessed $86.3 million in inflows on Thursday and $301.7 million on Friday, boosting the total weekly inflows to $1.37 billion.

          Bitcoin’s consolidation just below the all-time high has not generated a sell signal in any of the 30 “bull market peak” indicators monitored by CoinGlass. In a post on X, popular trader Cas Abbe said the models project a target between $135,000 to $230,000 for Bitcoin this cycle.

          Could Bitcoin rise toward $110,500, pulling select altcoins higher? If it does, let’s look at the cryptocurrencies that look strong on the charts.

          Bitcoin price prediction

          Bitcoin found support at the 50-day simple moving average ($103,604) on Friday, but the bulls are struggling to push the price above the 20-day exponential moving average ($106,028). That suggests a lack of buying at higher levels.

          The flattish 20-day EMA and the relative strength index (RSI) near the midpoint do not give a clear advantage either to the bulls or the bears. If buyers drive the price above the 20-day EMA, the pair could climb to the $110,530 to $111,980 zone. Sellers are expected to fiercely defend the overhead zone, but if the bulls prevail, the pair could skyrocket toward $130,000.

          On the downside, a break below the 50-day SMA could challenge the critical psychological level of $100,000. If the level cracks, the pair may slide to $93,000.

          Sellers are trying to stall the recovery at the 20-EMA on the 4-hour chart. If the price turns down sharply and breaks below $104,000, the short-term advantage tilts in favor of the bears. The pair may descend to $102,664 and then to $100,000. Buyers are expected to vigorously defend the $100,000 level.

          The bulls will have to propel the price above the 50-SMA to seize control. The pair could then surge toward $110,530.

          Hyperliquid price prediction

          Buyers have been struggling to maintain Hyperliquid (HYPE) above $42.50, indicating that bears are active at higher levels.

          The upsloping 20-day EMA ($36.96) indicates that buyers have an edge, but the negative divergence on the RSI suggests that the bullish momentum is slowing down. A break and close above $44 will invalidate the negative divergence, opening the gates for a rally to $50.

          Contrary to this assumption, if the price turns down and breaks below the 20-day EMA, it signals profit-booking by the bulls. That could start a deeper correction to $32.50 and subsequently to $30.50.

          The pullback is taking support at the 50-SMA on the 4-hour chart, suggesting that lower levels are attracting buyers. If the 20-EMA is scaled, the pair could climb to $42.78 and then to $44. The uptrend will resume on a break above $44.

          Contrarily, a break and close below the 50-SMA suggests the bulls have given up. That could accelerate selling, pulling the pair to the uptrend line. This is a crucial near-term support to watch out for because a break below the uptrend line could sink the pair to $30.50.

          Bitcoin Cash price prediction

          Bitcoin Cash (BCH) bounced off the 50-day SMA ($403) on Friday, but the bulls are facing stiff resistance at $462.

          The upsloping moving averages and the RSI in the positive territory indicate the path of least resistance is to the upside. If buyers overcome the barrier at $462, the pair could rally to $500.

          The 50-day SMA is the vital support to watch out for on the downside. If the support cracks, the pair could sink to $375. Buyers will try to arrest the decline at $375. If they succeed, the pair may consolidate between $375 and $462 for a while.

          The pair has reached the $462 resistance, where the bears are expected to step in. If buyers do not allow the price to dip below $450, it improves the prospects of a break above $462. If that happens, the pair could surge toward $500.

          Alternatively, if the $500 level gives way, the pair could drop to the moving averages. If the price rebounds off the moving averages, the bulls will again try to push the price above $462. The short-term trend will favor the bears on a break below the 50-SMA.

          Aave price prediction

          Aave (AAVE) soared above the $285 resistance on Tuesday, but the bulls could not sustain the higher levels.

          The price turned down sharply from $325 on Wednesday and has reached the 20-day EMA ($269). If the price rebounds off the 20-day EMA with force, the bulls will strive to push the pair above $325. If they manage to do that, the pair could soar toward $380.

          On the contrary, a break below the 20-day EMA could pull the pair to the uptrend line. Buyers are expected to defend the uptrend line with vigor. If the price turns up from the uptrend line and breaks above the 20-day EMA, the bulls will again try to drive the pair to $325.

          The 20-EMA is sloping down on the 4-hour chart, and the RSI has dipped into the negative zone, signaling that bears have the upper hand. There is support at $261, but if the level breaks down, the pair could slump to the uptrend line.

          The first sign of strength will be a break and close above the 20-EMA. That opens the doors for a rise to $291 and thereafter to $309. Sellers are expected to vigorously defend the $309 to $325 zone.

          OKB price prediction

          OKB (OKB) has been trading inside a descending channel pattern for several days. Buyers tried to push the price above the channel on Wednesday, but the bears held their ground.

          A minor advantage in favor of the bulls is that they have not allowed the price to fall to the $49 support. That signals buying on dips. If buyers push the price above the moving averages, the OKB/USDT pair could move up to the resistance line. Repeated retest of a resistance level tends to weaken it. If buyers pierce the resistance line, the pair could rally to $56 and then to $60.

          This positive view will be invalidated in the near term if the price turns down and breaks below the $49 support. That suggests the pair may remain stuck inside the channel for a few more days.

          The bulls are trying to start a recovery, but the bears are defending the 20-EMA on the 4-hour chart. If the price turns down from the 20-EMA and breaks below $51, it suggests that bears are in control. The pair could then plummet toward $49.

          On the other hand, a move above the moving averages suggests the bears are losing their grip. That increases the possibility of a rise to the resistance line, which is an important level to watch out for. A break above the resistance line signals a potential trend change.

          This article does not contain investment advice or recommendations. Every investment and trading move involves risk, and readers should conduct their own research when making a decision.

          Risk Warnings and Disclaimers
          You understand and acknowledge that there is a high degree of risk involved in trading. Following any strategies or investment methods may lead to potential losses. The content on the site is provided by our contributors and analysts for information purposes only. You are solely responsible for determining whether any trading assets, securities, strategy, or any other product is suitable for investing based on your own investment objectives and financial situation.
          Add to Favorites
          Share

          Ethereum Price Analysis: ETH at Critical Juncture After $2.5K Support Retest

          CryptoPotato
          Solana / Tether
          -0.03%
          1inch / Tether
          -0.39%
          Vaulta / Tether
          +0.11%
          AAVE / Tether
          -0.10%

          As geopolitical tensions between Iran and Israel escalate once again, global risk appetite is taking a hit. These conflicts often inject short-term volatility across traditional and crypto markets, and Ethereum is no exception.

          While ETH has held relatively steady above $2,500 in recent weeks, the growing fear in macro markets is beginning to surface in price structure and sentiment shifts.

          This is a sensitive moment for traders: ETH sits on the edge of a critical range, and what happens next may hinge as much on external events as technical factors.Technical Analysis

          By ShayanMarketsThe Daily Chart

          Ethereum’s daily chart shows a clear rejection from the $2,800 resistance area, which also aligns with the 200-day moving average and a bearish order block. After a strong relief rally from the $1,500 region earlier this quarter, ETH consolidated in an ascending channel pattern but is now likely to break below the lower trendline of that channel.

          This structure typically signals exhaustion in bullish momentum, especially when the market fails to push higher despite favorable short-term setups. The RSI has also dropped back under the 50 mark, reflecting bearish momentum.

          The price is now re-entering the mid-range zone, between $2,800 and $2,150. If Ethereum fails to reclaim $2,800 soon, the door will open for a possible move back toward the $2,150 support level, which coincides with the 100-day moving average and the top of the last major accumulation range. A bounce from there would be critical to preserve the broader bullish bias in recent months.

          The 4-Hour Chart

          On the 4H chart, the asset has broken down from the ascending channel it had been respecting for weeks. The rejection from the $2,800 order block created a sharp drop that left behind an imbalance (FVG) near the $2,600 zone, currently acting as short-term resistance. The structure now resembles a potential distribution phase, particularly if the price breaks below the channel without fresh buying pressure.

          The RSI also remains weak, hovering just below 50, and shows no signs of bullish divergence. There is also a notable lack of volume on recent bounces, suggesting that demand is drying up as macro uncertainty looms. If the channel breakdown occurs, ETH could retrace toward the $2,300 demand zone. Holding that area would be crucial, as losing it could invite a deeper correction toward $2,100, where stronger bullish interest likely awaits.

          Sentiment Analysis

          Open Interest (OI) on Ethereum derivatives has briefly reached its highest point over the past couple of years, exceeding $21B, before experiencing a marginal drop due to the liquidity caused by the tensions in the Middle East. What makes this development even more interesting is that this surge in OI is occurring while ETH is trading significantly lower than it did the last time OI was this elevated.

          This divergence typically signals a buildup of leveraged positions—both long and short—that are yet to be flushed out of the system.

          Historically, such OI-price divergence often precedes large-scale liquidation events. If the market can’t generate a clean breakout soon, a volatility spike triggered by the unwinding of over-leveraged positions could happen. This aligns with the growing geopolitical risk, which could catalyze a fast repricing if global investors move to risk-off assets. In other words, derivatives are flashing a warning. Even if the price looks calm, the undercurrent is anything but stable.

          Risk Warnings and Disclaimers
          You understand and acknowledge that there is a high degree of risk involved in trading. Following any strategies or investment methods may lead to potential losses. The content on the site is provided by our contributors and analysts for information purposes only. You are solely responsible for determining whether any trading assets, securities, strategy, or any other product is suitable for investing based on your own investment objectives and financial situation.
          Add to Favorites
          Share

          Dormant Ethereum Wallet Awakens After 10 Years With Millions Worth Of ETH

          NewsBTC
          Solana / Tether
          -0.03%
          1inch / Tether
          -0.39%
          Vaulta / Tether
          +0.11%
          AAVE / Tether
          -0.10%

          Ethereum has been consolidating around the $2,500 price level over the past few days, showing little momentum in either direction. The second-largest cryptocurrency by market cap has struggled to sustain a breakout above the $2,600 resistance zone, despite the inflows into Ethereum Spot ETFs last week. 

          One event that has sparked interest, and possibly concern, among Ethereum holders is the reactivation of a dormant whale wallet holding millions worth of ETH. The sudden awakening of this long-inactive address raises questions about a potential selling pressure and its market impact.

          First Transaction From Dormant ETH Address Since 2015

          On-chain tracker Whale Alerts was the first to report the reawakening of a pre-mined Ethereum address that had been inactive for nearly a decade. According to the large on-chain transaction tracker, the wallet, which held 2,000 ETH, initiated its last transaction 9.9 years ago. When the wallet last moved any funds in 2015, the entire stash was worth just $620. Today, that same amount is valued at over $5 million, making the owner’s profit roughly 820x based on current prices. At Ethereum’s all-time high price of $4,878 in 2021, the cryptocurrencies reached an unrealized gain of 1573x.

          Whale Alert
          @whale_alert

          A dormant pre-mine address containing 2,000 #ETH (5,063,918 USD) has just been activated after 9.9 years (worth 620 USD in 2015)!https://t.co/G0i8Rif0XX

          Jun 14, 2025

          The alert by Whale Alerts, which noted the first transaction after 9.9 years, involved the transfer of 0.0001 ETH from the whale address “0xcF26” to address “0x2C12,” which is a newly created ETH address. However, Etherscan’s on-chain transaction data reveals that the whale address sent 500 ETH into the newly created address shortly afterward. 

          Following the string of transaction data from Etherscan shows that these 500 ETH eventually made their way into address “0x28C6,” which is known to be owned and controlled by crypto exchange Binance. This means that the 500 ETH may have already been sold through the exchange or are currently being prepared for liquidation.

          Brace For Impact: Will The Remaining 1,500 ETH Be Sold?

          As of now, the original whale address still holds approximately 1,500 ETH, currently valued at $3.796 million. However, it opens up the question of whether the rest of the funds will also be sold. Although we cannot be sure of a planned full liquidation, the pattern of the 500 ETH transfer and the involvement of an exchange address indicate that the possibility cannot be dismissed.

          Right now, Ethereum is in a fragile price action around the $2,500 price level. If more ETH is offloaded by the whale, the added selling pressure could make it even harder for Ethereum to break out of its current consolidation phase, especially if there isn’t enough buying pressure to absorb the ETH sold off. 

          At the time of writing, Ethereum is trading at $2,525. The past 24 hours were spent by Ethereum trading between $2,549 and $2,495.

          Featured image from Unsplash, chart from TradingView

          Risk Warnings and Disclaimers
          You understand and acknowledge that there is a high degree of risk involved in trading. Following any strategies or investment methods may lead to potential losses. The content on the site is provided by our contributors and analysts for information purposes only. You are solely responsible for determining whether any trading assets, securities, strategy, or any other product is suitable for investing based on your own investment objectives and financial situation.
          Add to Favorites
          Share

          UXLINK (UXLINK) - R2 Partnership - 15 Jun 2025

          CoinMarketCal
          Solana / Tether
          -0.03%
          1inch / Tether
          -0.39%
          Vaulta / Tether
          +0.11%
          AAVE / Tether
          -0.10%

          UXLINK has created a new partnership with R2 to offer real-world yield through R2USD for millions of users. This is important because real-world yield can attract many investors looking for stable returns. If UXLINK can deliver high yields safely, more people may buy and hold UXLINK tokens. However, if the project cannot provide the promised returns, or if there is risk for users' funds, the price might not move much. Overall, good partnerships often bring positive attention and could help start a price increase. source

          R2 Community
          @r2yield

          We’re excited to announce our strategic partnership with @UXLINKofficial to bring real-world yield via R2USD to millions of retail users worldwide.

          Let’s make yield go viral! pic.twitter.com/CLvzdIMVFL

          Jun 14, 2025
          Risk Warnings and Disclaimers
          You understand and acknowledge that there is a high degree of risk involved in trading. Following any strategies or investment methods may lead to potential losses. The content on the site is provided by our contributors and analysts for information purposes only. You are solely responsible for determining whether any trading assets, securities, strategy, or any other product is suitable for investing based on your own investment objectives and financial situation.
          Add to Favorites
          Share

          Coreum (COREUM) - Cruise Control Beta - 15 Jun 2025

          CoinMarketCal
          Solana / Tether
          -0.03%
          1inch / Tether
          -0.39%
          Vaulta / Tether
          +0.11%
          AAVE / Tether
          -0.10%

          Coreum has just started the Cruise Control Beta, offering swaps, staking, and support with Cosmos chains. This can bring more activity and users to the Coreum ecosystem, making it easier for traders to use their tokens in one place. If many people use these new features, demand could rise for the COREUM token. However, as it is only a beta, some users might wait for full release. If bugs or problems happen, price reaction might be weaker. Still, new user growth can be a good sign for long-term value. source

          Coreum
          @CoreumOfficial

          Cruise Control Beta is now live on Coreum!

          Swap, stake, and send tokens to any Cosmos chain.

          Manage your portfolio, customize your profile, and explore native dApps, all on @JoinCruiseCtrl.

          Test the beta here: https://t.co/vRADSJQNj7 pic.twitter.com/3w3c2LPEF6

          Jun 15, 2025
          Risk Warnings and Disclaimers
          You understand and acknowledge that there is a high degree of risk involved in trading. Following any strategies or investment methods may lead to potential losses. The content on the site is provided by our contributors and analysts for information purposes only. You are solely responsible for determining whether any trading assets, securities, strategy, or any other product is suitable for investing based on your own investment objectives and financial situation.
          Add to Favorites
          Share

          Seedify.fund (SFUND), Seedify NFT Space (SNFTS) - THE P33L IDO - 16 Jun to 17 Jun 2025

          CoinMarketCal
          Solana / Tether
          -0.03%
          1inch / Tether
          -0.39%
          Vaulta / Tether
          +0.11%
          AAVE / Tether
          -0.10%

          Seedify is launching THE P33L IDO, its first $100K project from its Venture Studio. Big launches like this can bring more investors and interest into SFUND and SNFTS tokens, as more people join to get early access to new projects. High demand for registration shows good community interest. If the IDO goes well and the project grows, the price of Seedify tokens could go up. But if the project does not do well or there are problems, price growth may be slow. Still, strong activity can help in the short-term. source

          Seedify
          @SeedifyFund

          Hi everybody,

          Due to high demand and some KYCs not being approved/processed yet, we’re extending registrations for @thep33l IDO until June 16th, 9AM UTC.

          IDO start date/time and TGE date will remain unchanged.

          Thank you https://t.co/e9taYJrDz8

          Jun 15, 2025
          Risk Warnings and Disclaimers
          You understand and acknowledge that there is a high degree of risk involved in trading. Following any strategies or investment methods may lead to potential losses. The content on the site is provided by our contributors and analysts for information purposes only. You are solely responsible for determining whether any trading assets, securities, strategy, or any other product is suitable for investing based on your own investment objectives and financial situation.
          Add to Favorites
          Share
          FastBull
          Copyright © 2025 FastBull Ltd

          728 RM B 7/F GEE LOK IND BLDG NO 34 HUNG TO RD KWUN TONG KLN HONG KONG

          TelegramInstagramTwitterfacebooklinkedin
          App Store Google Play Google Play
          Products
          Charts

          Chats

          Q&A with Experts
          Screeners
          Economic Calendar
          Data
          Tools
          Membership
          Features
          Function
          Markets
          Copy Trading
          Latest Signals
          Contests
          News
          Analysis
          24/7
          Columns
          Education
          Company
          Careers
          About Us
          Contact Us
          Advertising
          Help Center
          Feedback
          User Agreement
          Privacy Policy
          Business

          White Label

          Data API

          Web Plug-ins

          Poster Maker

          Affiliate Program

          Risk Disclosure

          The risk of loss in trading financial instruments such as stocks, FX, commodities, futures, bonds, ETFs and crypto can be substantial. You may sustain a total loss of the funds that you deposit with your broker. Therefore, you should carefully consider whether such trading is suitable for you in light of your circumstances and financial resources.

          No decision to invest should be made without thoroughly conducting due diligence by yourself or consulting with your financial advisors. Our web content might not suit you since we don't know your financial conditions and investment needs. Our financial information might have latency or contain inaccuracy, so you should be fully responsible for any of your trading and investment decisions. The company will not be responsible for your capital loss.

          Without getting permission from the website, you are not allowed to copy the website's graphics, texts, or trademarks. Intellectual property rights in the content or data incorporated into this website belong to its providers and exchange merchants.

          Not Logged In

          Log in to access more features

          FastBull Membership

          Not yet

          Purchase

          Become a signal provider
          Help Center
          Customer Service
          Dark Mode
          Price Up/Down Colors

          Log In

          Sign Up

          Position
          Layout
          Fullscreen
          Default to Chart
          The chart page opens by default when you visit fastbull.com