


- XAUUSD
- XAGUSD
- WTI
- USDX



Markets
Analysis
User
24/7
Economic Calendar
Education
Data
- Names
- Latest
- Prev









Explore the U.S. dollar value over time with historical CPI data, purchasing power comparisons, inflation trends, and dollar index charts from 1913 to 2026.
The U.S. dollar's value has changed significantly over time. It can be measured in two ways: how much it buys in the United States and how much it is worth against other currencies. Historical CPI data reveal changes in purchasing power, while dollar indexes show how the currency has performed internationally.
The value of the U.S. dollar has two important dimensions: domestic purchasing power and international exchange value. They are related, but they measure different things and do not always move in the same direction.
Purchasing power refers to the amount of goods and services a dollar can buy. When consumer prices rise, each dollar buys less, even though the face value of the currency remains unchanged.
The Consumer Price Index (CPI), published by the U.S. Bureau of Labor Statistics (BLS), is commonly used to measure changes in consumer prices. It tracks the average price changes of a basket of goods and services purchased by urban consumers.
For example, if the overall price level doubles, $1 generally buys about half as much as before. This is why the dollar can gradually lose purchasing power over time, even without any change to the physical currency.
Exchange value measures how much one U.S. dollar is worth in another currency, such as the euro, Japanese yen, or British pound. Unlike domestic purchasing power, its value can rise or fall depending on conditions in international currency markets.
Several factors influence the dollar's exchange value:
This distinction matters because the dollar can lose purchasing power inside the United States while gaining value against foreign currencies. CPI and exchange-rate indexes therefore measure different aspects of the dollar's value.
The long-term trend is clear: the U.S. dollar buys substantially less than it did more than a century ago. Historical CPI data make it possible to compare its purchasing power across different periods.
The BLS historical CPI-U series shows that the annual average index increased from 9.9 in 1913 to 321.943 in 2025. The 2025 figure is based on 11 available monthly observations because October 2025 data were unavailable.
In practical terms, something that cost $1 in 1913 would have required approximately $32.52 in 2025 to purchase an equivalent basket of consumer goods and services.
The latest available monthly CPI-U index as of November 20, 2026, was 337.511 for October 2026. Based on that reading, $1 in 1913 had the equivalent purchasing power of approximately $34.09 in October 2026.
These figures illustrate the cumulative effect of inflation. Even relatively moderate annual price increases can significantly reduce the purchasing power of money over several decades.
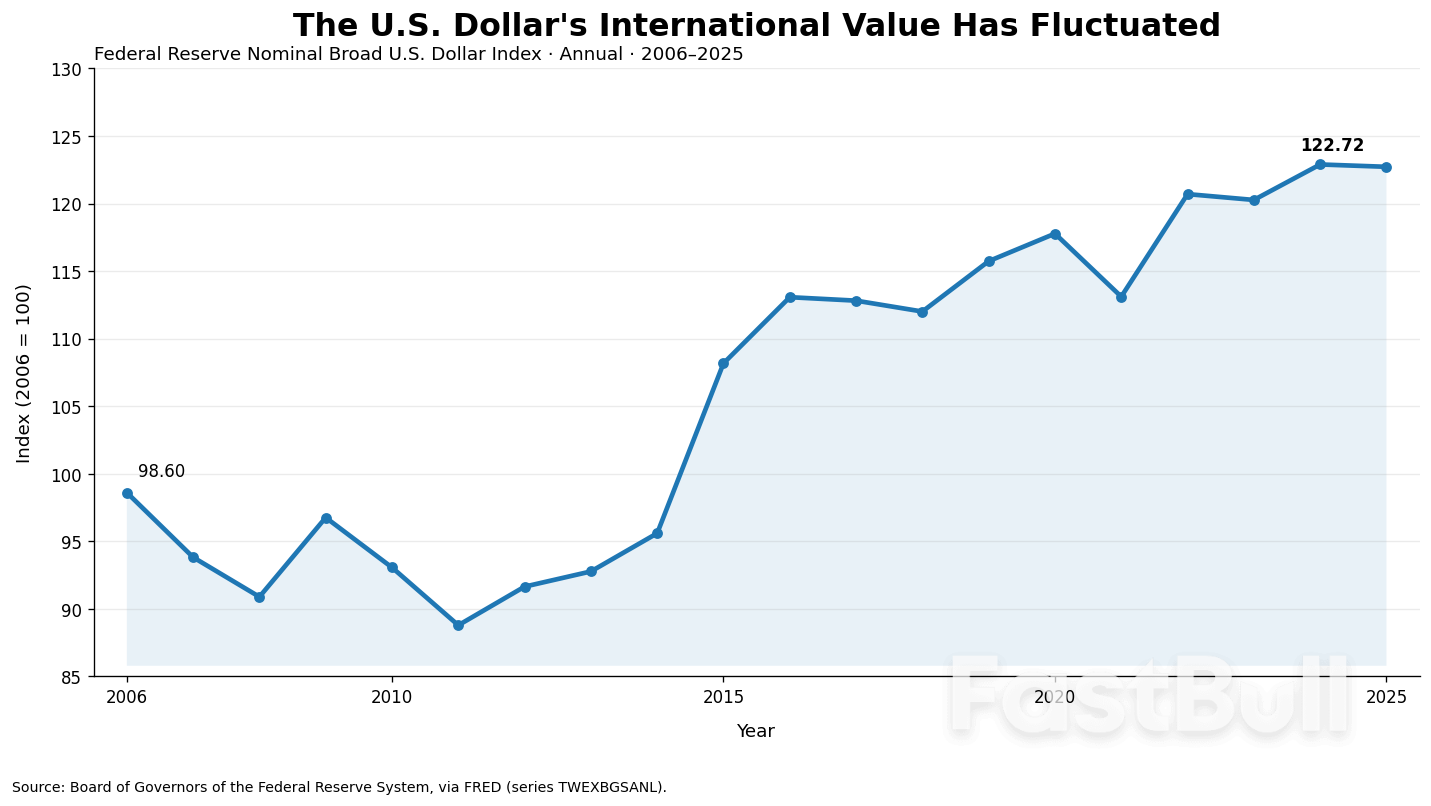
The decline in purchasing power has not been consistent. Different economic conditions have produced periods of rapid inflation, relatively stable prices, and even deflation.
These periods show why cumulative inflation matters. Even when annual inflation slows, consumers do not automatically regain the purchasing power lost during earlier price increases.
The following table compares the purchasing power of $1 in selected years with its equivalent value in 2025 dollars. The calculation uses annual average CPI-U indexes, with the 2025 figure based on 11 available months.
| Year | CPI-U | $1 in That Year (2025 Dollars) |
|---|---|---|
| 1913 | 9.9 | $32.52 |
| 1950 | 24.1 | $13.36 |
| 1980 | 82.4 | $3.91 |
| 2000 | 172.2 | $1.87 |
| 2010 | 218.056 | $1.48 |
| 2020 | 258.811 | $1.24 |
| 2025 | 321.943* | $1.00 |
*The 2025 CPI-U figure is an average of 11 available monthly observations because October 2025 data were unavailable. Source: BLS historical CPI data.
The comparison highlights how much purchasing power has declined. A dollar in 1913 had approximately 32.5 times the purchasing power of a dollar in 2025. These figures represent changes in average consumer prices, not the exact price movement of every individual product or service.
The dollar's international value has fluctuated considerably over the past two decades. Unlike purchasing power, which generally declines as consumer prices rise, the exchange value of the dollar can move in either direction.
One useful measure is the Federal Reserve's Nominal Broad U.S. Dollar Index. It tracks the dollar against currencies from a broad group of major U.S. trading partners, using trade-based weights. A rising index indicates a stronger dollar against this currency basket.
Federal Reserve annual data show that the nominal broad dollar index increased from 98.60 in 2006 to 122.72 in 2025, representing an overall rise of approximately 24.5%.
| Year | Nominal Broad Dollar Index |
|---|---|
| 2006 | 98.60 |
| 2010 | 93.05 |
| 2015 | 108.17 |
| 2020 | 117.77 |
| 2025 | 122.72 |
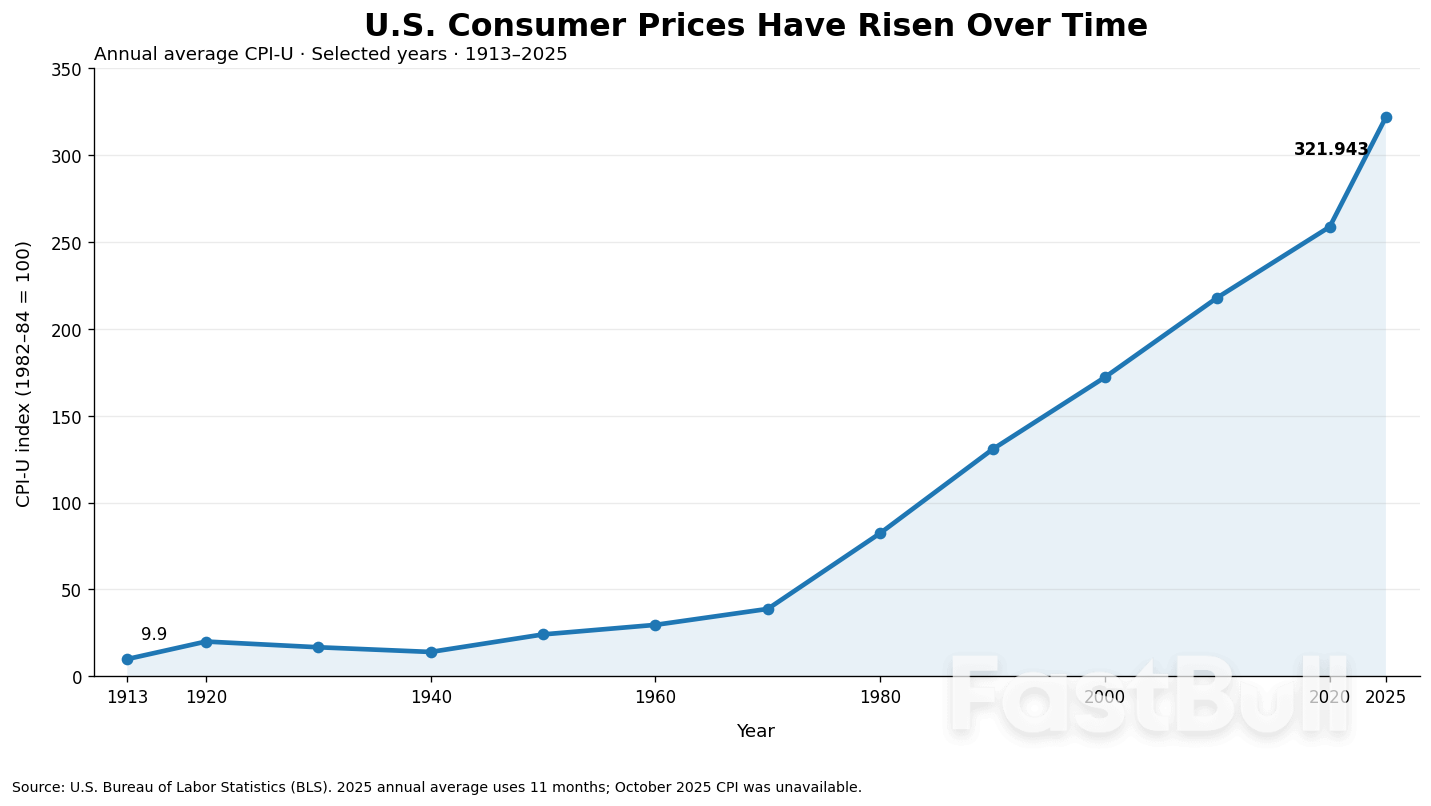
The index weakened between 2006 and 2011 before recovering. A particularly strong increase occurred between 2014 and 2016. It continued to fluctuate afterward, reflecting changing interest-rate expectations, economic conditions, and global demand for dollars.
Over the 2015–2025 period, the annual average broad dollar index rose from 108.17 to 122.72, an increase of approximately 13.5%.
Several developments influenced its performance:
These figures describe the Federal Reserve's broad trade-weighted index, not the ICE U.S. Dollar Index (DXY). The two measures use different currency baskets and weighting systems, so their readings should not be compared directly.
The dollar's value changes because of economic conditions in the United States and abroad. Some factors primarily affect domestic purchasing power, while others influence how investors value the dollar in foreign exchange markets.
Inflation reduces the amount of goods and services a dollar can buy. When consumer prices rise faster than wages, household purchasing power may decline.
Inflation can also influence exchange rates. If U.S. inflation remains higher than inflation in other countries, the dollar may lose competitiveness over time, all else being equal. However, the effect on exchange rates also depends on interest rates, growth expectations, and other economic conditions.
Federal Reserve policy can influence the dollar through interest rates and financial market expectations.
When U.S. interest rates rise relative to those in other countries, dollar-denominated investments may become more attractive to international investors. Increased demand for these assets can support the dollar.
Conversely, lower U.S. interest rates may reduce the relative appeal of dollar assets and put downward pressure on the exchange rate. However, investors also consider expected inflation, economic growth, and future monetary policy.
A strong economy can support the dollar by attracting foreign investment and increasing demand for U.S. financial assets. Other factors also matter:
These factors interact rather than operate independently. A stronger economy may support the dollar, but changes in interest rates or global risk appetite can produce different exchange-rate movements.
You can check historical dollar values using two different types of data: CPI for purchasing power and exchange-rate indexes for international strength. The correct source depends on what you want to measure.
The CPI is one of the most practical tools for comparing the purchasing power of money across different years.
Historical Dollar Value Formula:
Adjusted Value = Original Amount × (Target Year CPI ÷ Starting Year CPI)
For example, to compare $100 from 2000 with its equivalent value in 2025, multiply $100 by the 2025 CPI and divide the result by the 2000 CPI.
You can find the required figures through the BLS historical CPI tables. For completed calendar years, use annual average CPI figures. For a comparison involving the current year, use the latest available monthly index and identify the month being used.
It is important to use consistent CPI measurements when comparing different periods. Annual averages should be compared with annual averages, while monthly calculations should use the corresponding monthly indexes.
If you want to understand whether the dollar has strengthened or weakened against other currencies, use historical exchange-rate indexes instead of CPI.
The Federal Reserve's broad index covers a wider range of trading partners, while DXY focuses on a fixed basket of six currencies. For meaningful historical comparisons, use the same index and methodology throughout the period you are studying.
Has the U.S. dollar lost value over time?
Yes, in terms of domestic purchasing power. Inflation has caused the general price level to rise significantly since 1913, meaning one dollar buys much less today than it did more than a century ago. However, its international exchange value has experienced both gains and declines.
Is the U.S. dollar getting stronger or weaker?
It depends on the comparison period and the index being used. The dollar can strengthen against other currencies while losing domestic purchasing power because of inflation. Check the latest Federal Reserve or ICE index data to assess its exchange-rate performance.
Does the U.S. Dollar Index measure purchasing power?
No. The U.S. Dollar Index measures the dollar's exchange value against a basket of foreign currencies. CPI is the appropriate measure for evaluating changes in domestic purchasing power.
Sources:

728 RM B 7/F GEE LOK IND BLDG NO 34 HUNG TO RD KWUN TONG KLN HONG KONG


The risk of loss in trading financial instruments such as stocks, FX, commodities, futures, bonds, ETFs and crypto can be substantial. You may sustain a total loss of the funds that you deposit with your broker. Therefore, you should carefully consider whether such trading is suitable for you in light of your circumstances and financial resources.
No decision to invest should be made without thoroughly conducting due diligence by yourself or consulting with your financial advisors. Our web content might not suit you since we don't know your financial conditions and investment needs. Our financial information might have latency or contain inaccuracy, so you should be fully responsible for any of your trading and investment decisions. The company will not be responsible for your capital loss.
Without getting permission from the website, you are not allowed to copy the website's graphics, texts, or trademarks. Intellectual property rights in the content or data incorporated into this website belong to its providers and exchange merchants.
Not Logged In
Log in to access more features


Log In
Sign Up