Markets
News
Analysis
User
24/7
Economic Calendar
Education
Data
- Names
- Latest
- Prev


Stocks with low volatility can be a great foundation for a portfolio, especially for investors looking to reduce risk. While they don’t often make headlines, these companies provide consistency in an unpredictable market.
Finding safe investments without sacrificing returns is key, and StockStory is here to help you find the best investments. Keeping that in mind, here are three low-volatility stocks that could succeed under all market conditions.
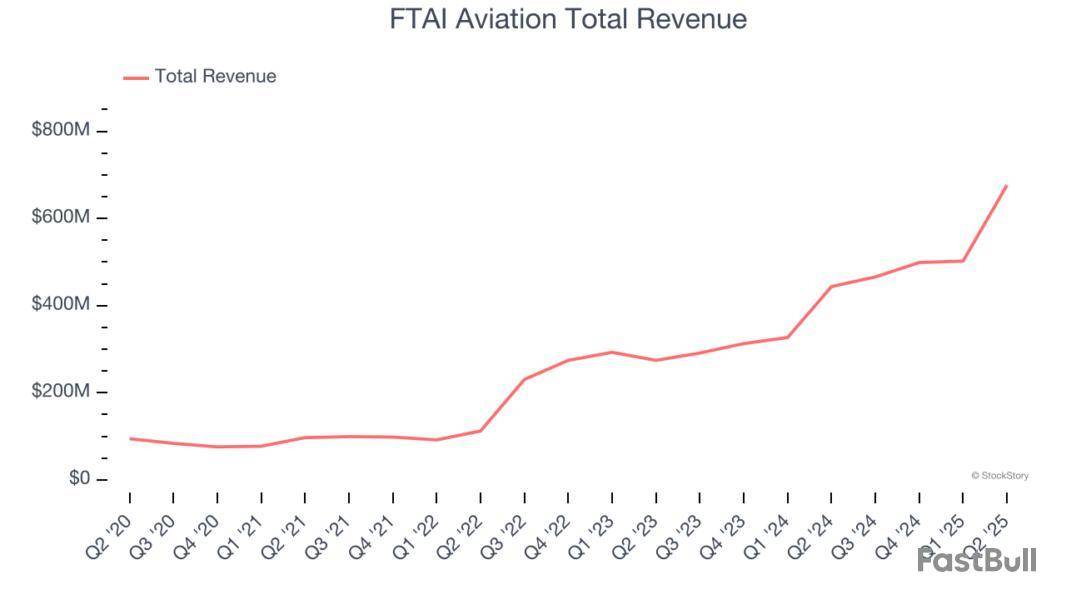
FTAI Aviation (FTAI)
Rolling One-Year Beta: 0.89
With a focus on the CFM56 engine that powers Boeing and Airbus’s planes, FTAI Aviation sells, leases, maintains, and repairs aircraft engines.
Why Is FTAI a Top Pick?
At $170 per share, FTAI Aviation trades at 31.9x forward P/E. Is now the right time to buy? See for yourself in our in-depth research report, it’s free.
Humana (HUM)
Rolling One-Year Beta: 0.90
With over 80% of its revenue derived from federal government contracts, Humana provides health insurance plans and healthcare services to approximately 17 million members, with a strong focus on Medicare Advantage plans for seniors.
Why Does HUM Stand Out?
Humana is trading at $247.70 per share, or 16.6x forward P/E. Is now the time to initiate a position? Find out in our full research report, it’s free.
The Ensign Group (ENSG)
Rolling One-Year Beta: 0.36
Founded in 1999 and named after a naval term for a flag-bearing ship, The Ensign Group operates skilled nursing facilities, senior living communities, and rehabilitation services across 15 states, primarily serving high-acuity patients recovering from various medical conditions.
Why Do We Like ENSG?
The Ensign Group’s stock price of $175.06 implies a valuation ratio of 26.3x forward P/E. Is now a good time to buy? See for yourself in our full research report, it’s free.
High-Quality Stocks for All Market Conditions
Trump’s April 2025 tariff bombshell triggered a massive market selloff, but stocks have since staged an impressive recovery, leaving those who panic sold on the sidelines.
Take advantage of the rebound by checking out our Top 9 Market-Beating Stocks. This is a curated list of our High Quality stocks that have generated a market-beating return of 183% over the last five years (as of March 31st 2025).
Stocks that made our list in 2020 include now familiar names such as Nvidia (+1,545% between March 2020 and March 2025) as well as under-the-radar businesses like the once-micro-cap company Kadant (+351% five-year return).
StockStory is growing and hiring equity analyst and marketing roles. Are you a 0 to 1 builder passionate about the markets and AI? See the open roles here.
728 RM B 7/F GEE LOK IND BLDG NO 34 HUNG TO RD KWUN TONG KLN HONG KONG


The risk of loss in trading financial instruments such as stocks, FX, commodities, futures, bonds, ETFs and crypto can be substantial. You may sustain a total loss of the funds that you deposit with your broker. Therefore, you should carefully consider whether such trading is suitable for you in light of your circumstances and financial resources.
No decision to invest should be made without thoroughly conducting due diligence by yourself or consulting with your financial advisors. Our web content might not suit you since we don't know your financial conditions and investment needs. Our financial information might have latency or contain inaccuracy, so you should be fully responsible for any of your trading and investment decisions. The company will not be responsible for your capital loss.
Without getting permission from the website, you are not allowed to copy the website's graphics, texts, or trademarks. Intellectual property rights in the content or data incorporated into this website belong to its providers and exchange merchants.
Not Logged In
Log in to access more features

FastBull Membership
Not yet
Purchase


Log In
Sign Up