Markets
News
Analysis
User
24/7
Economic Calendar
Education
Data
- Names
- Latest
- Prev


Signal Accounts for Members
All Signal Accounts
All Contests


France Trade Balance (SA) (Oct)A:--
F: --
Euro Zone Employment YoY (SA) (Q3)A:--
F: --
Canada Part-Time Employment (SA) (Nov)A:--
F: --
P: --
Canada Unemployment Rate (SA) (Nov)A:--
F: --
P: --
Canada Full-time Employment (SA) (Nov)A:--
F: --
P: --
Canada Labor Force Participation Rate (SA) (Nov)A:--
F: --
P: --
Canada Employment (SA) (Nov)A:--
F: --
P: --
U.S. PCE Price Index MoM (Sept)A:--
F: --
P: --
U.S. Personal Income MoM (Sept)A:--
F: --
P: --
U.S. Core PCE Price Index MoM (Sept)A:--
F: --
P: --
U.S. PCE Price Index YoY (SA) (Sept)A:--
F: --
P: --
U.S. Core PCE Price Index YoY (Sept)A:--
F: --
P: --
U.S. Personal Outlays MoM (SA) (Sept)A:--
F: --
U.S. 5-10 Year-Ahead Inflation Expectations (Dec)A:--
F: --
P: --
U.S. Real Personal Consumption Expenditures MoM (Sept)A:--
F: --
U.S. Weekly Total Rig CountA:--
F: --
P: --
U.S. Weekly Total Oil Rig CountA:--
F: --
P: --
U.S. Consumer Credit (SA) (Oct)A:--
F: --
China, Mainland Foreign Exchange Reserves (Nov)A:--
F: --
P: --
Japan Trade Balance (Oct)A:--
F: --
P: --
Japan Nominal GDP Revised QoQ (Q3)A:--
F: --
P: --
China, Mainland Imports YoY (CNH) (Nov)A:--
F: --
P: --
China, Mainland Exports (Nov)A:--
F: --
P: --
China, Mainland Imports (CNH) (Nov)A:--
F: --
P: --
China, Mainland Trade Balance (CNH) (Nov)A:--
F: --
P: --
China, Mainland Exports YoY (USD) (Nov)A:--
F: --
P: --
China, Mainland Imports YoY (USD) (Nov)A:--
F: --
P: --
Germany Industrial Output MoM (SA) (Oct)A:--
F: --
Euro Zone Sentix Investor Confidence Index (Dec)A:--
F: --
P: --
Canada National Economic Confidence IndexA:--
F: --
P: --
U.K. BRC Like-For-Like Retail Sales YoY (Nov)--
F: --
P: --
U.K. BRC Overall Retail Sales YoY (Nov)--
F: --
P: --
Australia Overnight (Borrowing) Key Rate--
F: --
P: --
RBA Rate Statement
RBA Press Conference
Germany Exports MoM (SA) (Oct)--
F: --
P: --
U.S. NFIB Small Business Optimism Index (SA) (Nov)--
F: --
P: --
Mexico 12-Month Inflation (CPI) (Nov)--
F: --
P: --
Mexico Core CPI YoY (Nov)--
F: --
P: --
Mexico PPI YoY (Nov)--
F: --
P: --
U.S. Weekly Redbook Index YoY--
F: --
P: --
U.S. JOLTS Job Openings (SA) (Oct)--
F: --
P: --
China, Mainland M1 Money Supply YoY (Nov)--
F: --
P: --
China, Mainland M0 Money Supply YoY (Nov)--
F: --
P: --
China, Mainland M2 Money Supply YoY (Nov)--
F: --
P: --
U.S. EIA Short-Term Crude Production Forecast For The Year (Dec)--
F: --
P: --
U.S. EIA Natural Gas Production Forecast For The Next Year (Dec)--
F: --
P: --
U.S. EIA Short-Term Crude Production Forecast For The Next Year (Dec)--
F: --
P: --
EIA Monthly Short-Term Energy Outlook
U.S. API Weekly Gasoline Stocks--
F: --
P: --
U.S. API Weekly Cushing Crude Oil Stocks--
F: --
P: --
U.S. API Weekly Crude Oil Stocks--
F: --
P: --
U.S. API Weekly Refined Oil Stocks--
F: --
P: --
South Korea Unemployment Rate (SA) (Nov)--
F: --
P: --
Japan Reuters Tankan Non-Manufacturers Index (Dec)--
F: --
P: --
Japan Reuters Tankan Manufacturers Index (Dec)--
F: --
P: --
Japan Domestic Enterprise Commodity Price Index MoM (Nov)--
F: --
P: --
Japan Domestic Enterprise Commodity Price Index YoY (Nov)--
F: --
P: --
China, Mainland PPI YoY (Nov)--
F: --
P: --
China, Mainland CPI MoM (Nov)--
F: --
P: --


No matching data
Latest Views
Latest Views
Trending Topics
Top Columnists
Latest Update
White Label
Data API
Web Plug-ins
Affiliate Program
View All

No data
What a brutal six months it’s been for Insperity. The stock has dropped 21.2% and now trades at $60.36, rattling many shareholders. This was partly driven by its softer quarterly results and may have investors wondering how to approach the situation.
Is there a buying opportunity in Insperity, or does it present a risk to your portfolio? Dive into our full research report to see our analyst team’s opinion, it’s free.
Why Is Insperity Not Exciting?
Even with the cheaper entry price, we don't have much confidence in Insperity. Here are three reasons why NSP doesn't excite us and a stock we'd rather own.
1. Lackluster Revenue Growth
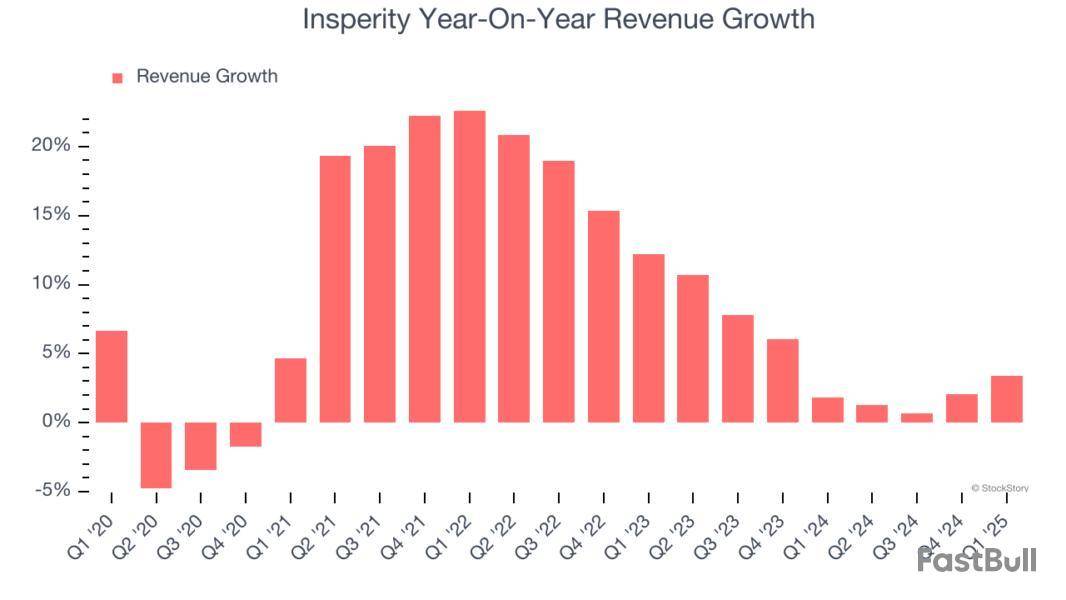
We at StockStory place the most emphasis on long-term growth, but within business services, a stretched historical view may miss recent innovations or disruptive industry trends. Insperity’s recent performance shows its demand has slowed as its annualized revenue growth of 4.1% over the last two years was below its five-year trend.
2. EPS Trending Down
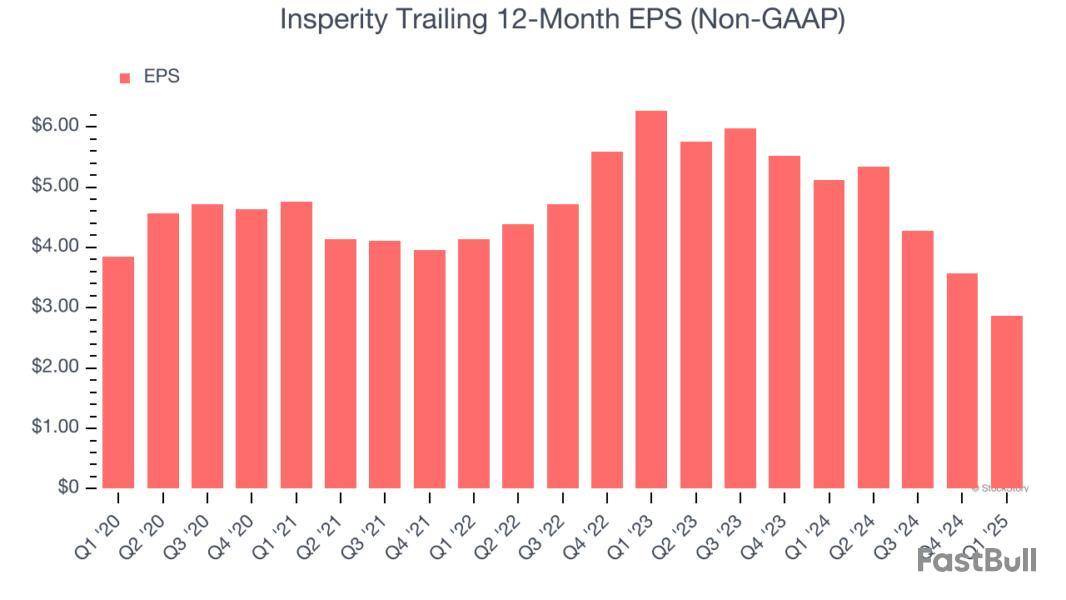
Analyzing the long-term change in earnings per share (EPS) shows whether a company's incremental sales were profitable – for example, revenue could be inflated through excessive spending on advertising and promotions.
Sadly for Insperity, its EPS declined by 5.7% annually over the last five years while its revenue grew by 8.6%. This tells us the company became less profitable on a per-share basis as it expanded.
3. Free Cash Flow Margin Dropping
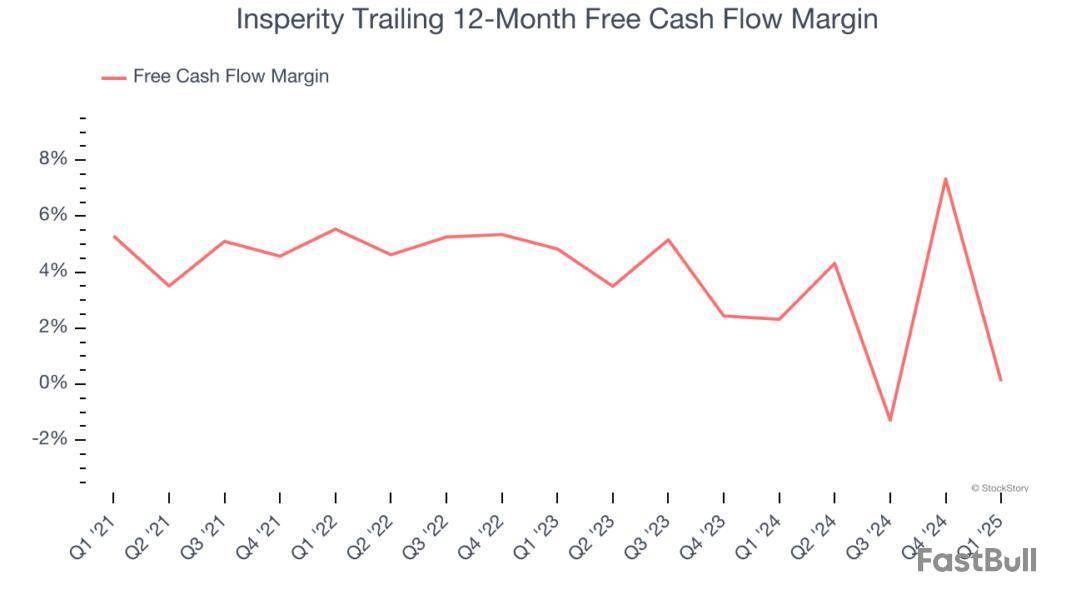
If you’ve followed StockStory for a while, you know we emphasize free cash flow. Why, you ask? We believe that in the end, cash is king, and you can’t use accounting profits to pay the bills.
As you can see below, Insperity’s margin dropped by 5.2 percentage points over the last five years. This along with its unexciting margin put the company in a tough spot, and shareholders are likely hoping it can reverse course. If the trend continues, it could signal it’s becoming a more capital-intensive business. Insperity’s free cash flow margin for the trailing 12 months was breakeven.
Final Judgment
Insperity isn’t a terrible business, but it doesn’t pass our bar. Following the recent decline, the stock trades at 16.3× forward P/E (or $60.36 per share). Beauty is in the eye of the beholder, but our analysis shows the upside isn’t great compared to the potential downside. We're pretty confident there are superior stocks to buy right now. Let us point you toward one of our top digital advertising picks.
High-Quality Stocks for All Market Conditions
The market surged in 2024 and reached record highs after Donald Trump’s presidential victory in November, but questions about new economic policies are adding much uncertainty for 2025.
While the crowd speculates what might happen next, we’re homing in on the companies that can succeed regardless of the political or macroeconomic environment. Put yourself in the driver’s seat and build a durable portfolio by checking out our Top 5 Growth Stocks for this month. This is a curated list of our High Quality stocks that have generated a market-beating return of 183% over the last five years (as of March 31st 2025).
Stocks that made our list in 2020 include now familiar names such as Nvidia (+1,545% between March 2020 and March 2025) as well as under-the-radar businesses like the once-micro-cap company Kadant (+351% five-year return).
Insperity, Inc. NSP reported lower-than-expected first-quarter 2025 results.
The stock has declined 17% since the earnings release on April 29 in response to dismal earnings and a weak earnings-per-share guidance.
For 2025, the company lowered the adjusted earnings per share (EPS) guidance to $2.23-$3.28 from the previous quarter’s view of $3.10-$3.95. The mid-point ($2.76) of the company’s guidance range is higher than the Zacks Consensus Estimate for earnings of $2.48 per share.
Adjusted earnings (excluding 22 cents from non-recurring items) of 1.57 cents per share missed the consensus estimate by 21.9% and decreased 30.8% year over year. Revenues of $1.9 billion missed the Zacks Consensus Estimate by a slight margin but increased 3.4% from the year-ago quarter.
The company’s stock has declined 37.6% over the past year compared with the 33.6% fall of its industry and against the 7.8% rise of the Zacks S&P 500 composite.
The average number of worksite employees paid per month increased 1% year over year to 306,023. Revenue per worksite employee (WSEE) per month increased 3% from the year-ago quarter to $2,029.
Insperity, Inc. Price, Consensus and EPS Surprise
Insperity, Inc. price-consensus-eps-surprise-chart | Insperity, Inc. Quote
Insperity’s Q1 Operating Results
Gross profit declined 10% from the year-ago quarter to $310 million. The gross margin was 16.6%, down 250 basis points from the first quarter of 2024. Operating expenses increased 17% year over year to $233 million. Operating expenses per WSEE per month gained 2% on a year-over-year basis to $264.
NSP reported an operating income of $68 million, down 37% from the year-ago quarter. The company witnessed an operating income per WSEE per month of $74 compared with the year-ago quarter’s $118. Adjusted EBITDA for the reported quarter is $102 million, decreasing 28.2% on a year-over-year basis.
Balance Sheet & Cash Flow of NSP
Insperity exited first-quarter 2025 with cash and cash equivalents of $551 million compared with $1 billion in the preceding quarter. The long-term debt was $369 million, flat sequentially.
In the reported quarter, NSP distributed $23 million as cash dividends. The capital expenditure totaled $6 million.
Insperity’s Q2 & 2025 Guidance
For the second quarter, NSP’s guidance for the bottom line is 29-67 cents per share. The mid-point (48 cents) of the guided range is higher than the Zacks Consensus Estimate for earnings of 41 cents per share. Insperity’s view for adjusted EBITDA is $33-$53 million.
For 2025, the guidance for adjusted EBITDA is reduced to $190-$245 million from the preceding quarter’s view of $240-$285 million.
Insperity carries a Zacks Rank #5 (Sell) at present.
You can see the complete list of today’s Zacks #1 Rank (Strong Buy) stocks here.
Earnings Snapshot
S&P Global Inc. SPGI reported impressive first-quarter 2025 results.
SPGI’s adjusted EPS of $4.37 surpassed the Zacks Consensus Estimate by 3.6% and gained 9% year over year. (Find the latest EPS estimates and surprises on Zacks Earnings Calendar.)
Revenues of $3.8 billion beat the consensus estimate by 2% and grew 8.3% year over year.
Verisk VRSK posted impressive first-quarter fiscal 2025 results.
VRSK’s adjusted earnings were $1.73 per share, surpassing the Zacks Consensus Estimate by 3.6% and increasing 6.1% from the year-ago quarter. Total revenues of $753 million beat the consensus estimate marginally and increased 7% on a year-over-year basis.
This article originally published on Zacks Investment Research (zacks.com).
Zacks Investment Research
White Label
Data API
Web Plug-ins
Poster Maker
Affiliate Program
The risk of loss in trading financial instruments such as stocks, FX, commodities, futures, bonds, ETFs and crypto can be substantial. You may sustain a total loss of the funds that you deposit with your broker. Therefore, you should carefully consider whether such trading is suitable for you in light of your circumstances and financial resources.
No decision to invest should be made without thoroughly conducting due diligence by yourself or consulting with your financial advisors. Our web content might not suit you since we don't know your financial conditions and investment needs. Our financial information might have latency or contain inaccuracy, so you should be fully responsible for any of your trading and investment decisions. The company will not be responsible for your capital loss.
Without getting permission from the website, you are not allowed to copy the website's graphics, texts, or trademarks. Intellectual property rights in the content or data incorporated into this website belong to its providers and exchange merchants.
Not Logged In
Log in to access more features

FastBull Membership
Not yet
Purchase
Log In
Sign Up