

Markets
News
Analysis
User
24/7
Economic Calendar
Education
Data
- Names
- Latest
- Prev


Signal Accounts for Members
All Signal Accounts
All Contests
New York And New Jersey Are Seeking Emergency Assistance In Response To Plans To Suspend Construction On Friday
The U.S. States Of New York And New Jersey Have Filed A Lawsuit Against President Trump For His Decision To Withhold $16 Billion In Tunnel Project Funds
Spot Gold Broke Through $5,000 Per Ounce, With Intraday Gains Widening To 1.1%, Rebounding Nearly $600 From This Week's Low
Spot Silver Rebounded During The Day After Falling More Than 2%, And Is Currently Trading At $85.4 Per Ounce
A U.S. Official Said The Iranian Revolutionary Guard Had Planned To Conduct Live-fire Military Exercises In The Strait Of Hormuz On Sunday And Monday, But Canceled The Exercises After Receiving A Warning From The United States
U.S. Trade Representative Greer: The Government Will Work With Congress To Modernize And Reform The Africa Trade Preference Program
U.S. Trade Representative Greer: The African Growth And Opportunity Act's Trade Preference Program Has Been Authorized To Be Extended To December 31, 2026, With Retroactive Effect Until September 30, 2025
USA Trade Representative Greer: President Trump Signed Into Law Legislation That Reauthorizes African Growth And Opportunity Act
A South Korean Trade Negotiator Stated That Discussions Regarding The Proposed Additional Tariffs On South Korea Are Currently Underway Among Various U.S. Departments
Rare Earth Concept Stocks Generally Closed Higher, With Niocorp Up 21.75%, Critical Metals Up 20.25%, USA Rare Earth Up 17.46%, Uuuu Up 16.75%, Mp Materials Up 9.30%, Metal Mining Etfetf Up 5.02%, And Uuraf Down 2.15%
[Hong Kong And Macao Affairs Office: Panama Embarrassing Itself And Reaping The Consequences] An Article From The Hong Kong And Macao Affairs Office Of The State Council Stated That The Panamanian Supreme Court Recently Ruled On The Grounds Of So-called "unconstitutionality" That The Renewal Of The Panama Canal Port Concession Agreement For A Hong Kong Company Was Invalid. This Ruling Disregards Facts, Breaches Faith, And Seriously Damages The Legitimate Rights And Interests Of Hong Kong Companies. It Is Therefore Rightfully Opposed By The Chinese Government And The Hong Kong SAR Government, And Has Been Strongly Condemned By All Sectors Of Hong Kong Society
 U.S. ISM Inventories Index (Jan)
A:--
F: --
P: --
U.S. ISM Manufacturing Employment Index (Jan)A:--
F: --
P: --
U.S. ISM Manufacturing New Orders Index (Jan)A:--
F: --
P: --
U.S. ISM Manufacturing PMI (Jan)A:--
F: --
P: --
US President Trump delivered a speech South Korea CPI YoY (Jan)
A:--
F: --
P: --
 Japan Monetary Base YoY (SA) (Jan)
A:--
F: --
P: --
 Australia Building Approval Total YoY (Dec)
A:--
F: --
Australia Building Permits MoM (SA) (Dec)A:--
F: --
Australia Building Permits YoY (SA) (Dec)A:--
F: --
P: --
Australia Private Building Permits MoM (SA) (Dec)A:--
F: --
Australia Overnight (Borrowing) Key RateA:--
F: --
P: --
RBA Rate Statement Japan 10-Year Note Auction YieldA:--
F: --
P: --
The U.S. House of Representatives voted on a short-term spending bill to end the partial government shutdown. Saudi Arabia IHS Markit Composite PMI (Jan)
A:--
F: --
P: --
RBA Press Conference Turkey PPI YoY (Jan)
A:--
F: --
P: --
Turkey CPI YoY (Jan)A:--
F: --
P: --
Turkey CPI YoY (Excl. Energy, Food, Beverage, Tobacco & Gold) (Jan)A:--
F: --
P: --
 U.K. 10-Year Note Auction Yield
A:--
F: --
P: --
Richmond Federal Reserve President Barkin delivered a speech. U.S. Weekly Redbook Index YoYA:--
F: --
P: --
 Mexico Manufacturing PMI (Jan)
A:--
F: --
P: --
U.S. API Weekly Refined Oil StocksA:--
F: --
P: --
U.S. API Weekly Gasoline StocksA:--
F: --
P: --
U.S. API Weekly Cushing Crude Oil StocksA:--
F: --
P: --
U.S. API Weekly Crude Oil StocksA:--
F: --
P: --
Japan IHS Markit Services PMI (Jan)A:--
F: --
P: --
Japan IHS Markit Composite PMI (Jan)A:--
F: --
P: --
 China, Mainland Caixin Services PMI (Jan)
--
F: --
P: --
China, Mainland Caixin Composite PMI (Jan)--
F: --
P: --
 India HSBC Services PMI Final (Jan)
--
F: --
P: --
India IHS Markit Composite PMI (Jan)--
F: --
P: --
 Russia IHS Markit Services PMI (Jan)
--
F: --
P: --
 South Africa IHS Markit Composite PMI (SA) (Jan)
--
F: --
P: --
 Italy Services PMI (SA) (Jan)
--
F: --
P: --
Italy Composite PMI (Jan)--
F: --
P: --
 Germany Composite PMI Final (SA) (Jan)
--
F: --
P: --
 Euro Zone Composite PMI Final (Jan)
--
F: --
P: --
Euro Zone Services PMI Final (Jan)--
F: --
P: --
U.K. Composite PMI Final (Jan)--
F: --
P: --
U.K. Total Reserve Assets (Jan)--
F: --
P: --
U.K. Services PMI Final (Jan)--
F: --
P: --
U.K. Official Reserves Changes (Jan)--
F: --
P: --
Euro Zone Core CPI Prelim YoY (Jan)--
F: --
P: --
Euro Zone Core HICP Prelim YoY (Jan)--
F: --
P: --
Euro Zone PPI MoM (Dec)--
F: --
P: --
Euro Zone HICP Prelim YoY (Jan)--
F: --
P: --
Euro Zone Core HICP Prelim MoM (Jan)--
F: --
P: --
Italy HICP Prelim YoY (Jan)--
F: --
P: --
Euro Zone Core CPI Prelim MoM (Jan)--
F: --
P: --
Euro Zone PPI YoY (Dec)--
F: --
P: --
U.S. MBA Mortgage Application Activity Index WoW--
F: --
P: --
 Brazil IHS Markit Composite PMI (Jan)
--
F: --
P: --
Brazil IHS Markit Services PMI (Jan)--
F: --
P: --
U.S. ADP Employment (Jan)--
F: --
P: --
The U.S. Treasury Department released its quarterly refinancing statement. U.S. IHS Markit Composite PMI Final (Jan)--
F: --
P: --
U.S. IHS Markit Services PMI Final (Jan)--
F: --
P: --
U.S. ISM Non-Manufacturing PMI (Jan)--
F: --
P: --


No matching data
View All
No data

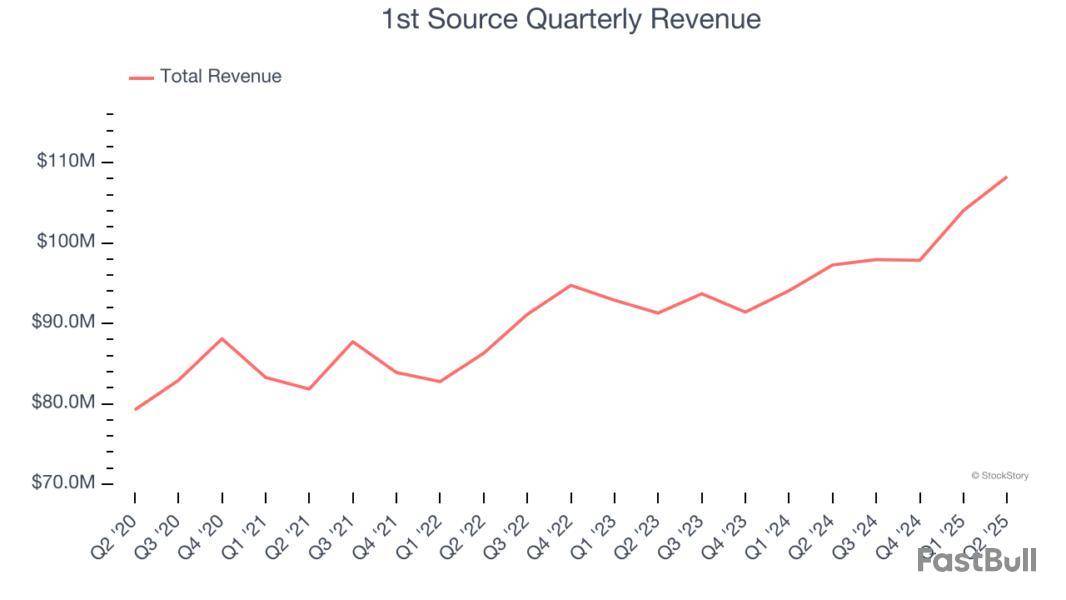
Regional banking company 1st Source reported Q2 CY2025 results topping the market’s revenue expectations, with sales up 11.3% year on year to $108.2 million. Its GAAP profit of $1.51 per share was 2.5% above analysts’ consensus estimates.
Is now the time to buy 1st Source? Find out by accessing our full research report, it’s free.
1st Source (SRCE) Q2 CY2025 Highlights:
Christopher J. Murphy III, Chairman and Chief Executive Officer, commented, "We are pleased that the strong start in 2025 continued through the second quarter. In spite of the noise in the economy and the uncertainty in the market, we are proud to have achieved a sixth consecutive quarter of margin expansion resulting from higher rates on investment securities, increased average loan and lease balances, and lower deposit costs."
Company Overview
Tracing its roots back to 1863 during the Civil War era, 1st Source Corporation is a regional bank holding company that provides commercial, consumer, specialty finance, and wealth management services across Indiana, Michigan, and Florida.
Sales Growth
Two primary revenue streams drive bank earnings. While net interest income, which is earned by charging higher rates on loans than paid on deposits, forms the foundation, fee-based services across banking, credit, wealth management, and trading operations provide additional income.
Unfortunately, 1st Source’s 4.8% annualized revenue growth over the last five years was mediocre. This wasn’t a great result compared to the rest of the bank sector, but there are still things to like about 1st Source.
Long-term growth is the most important, but within financials, a half-decade historical view may miss recent interest rate changes and market returns. 1st Source’s annualized revenue growth of 5% over the last two years aligns with its five-year trend, suggesting its demand was stable.
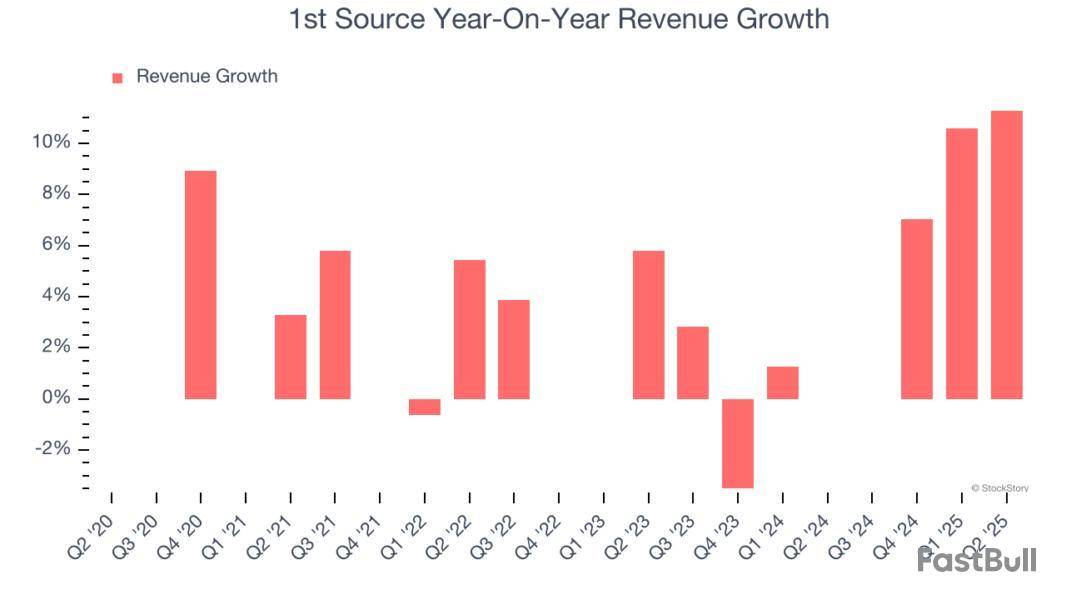
This quarter, 1st Source reported year-on-year revenue growth of 11.3%, and its $108.2 million of revenue exceeded Wall Street’s estimates by 3.4%.
Net interest income made up 74.2% of the company’s total revenue during the last five years, meaning lending operations are 1st Source’s largest source of revenue.
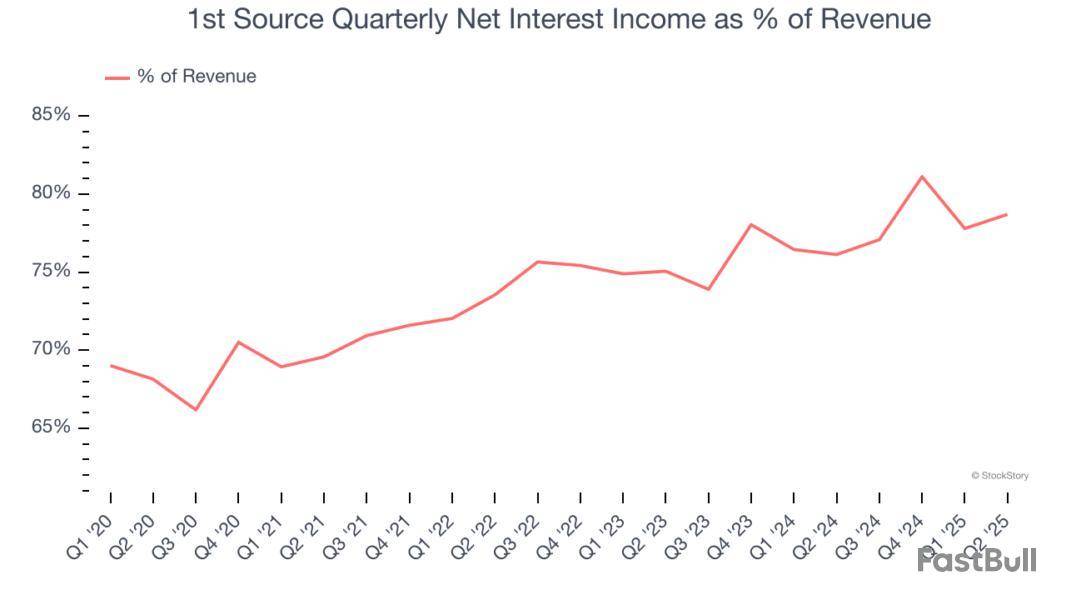
Markets consistently prioritize net interest income growth over fee-based revenue, recognizing its superior quality and recurring nature compared to the more unpredictable non-interest income streams.
Here at StockStory, we certainly understand the potential of thematic investing. Diverse winners from Microsoft (MSFT) to Alphabet (GOOG), Coca-Cola (KO) to Monster Beverage (MNST) could all have been identified as promising growth stories with a megatrend driving the growth. So, in that spirit, we’ve identified a relatively under-the-radar profitable growth stock benefiting from the rise of AI, available to you FREE via this link.
Tangible Book Value Per Share (TBVPS)
The balance sheet drives banking profitability since earnings flow from the spread between borrowing and lending rates. As such, valuations for these companies concentrate on capital strength and sustainable equity accumulation potential.
This explains why tangible book value per share (TBVPS) stands as the premier banking metric. TBVPS strips away questionable intangible assets, revealing concrete per-share net worth that investors can trust. Traditional metrics like EPS are helpful but face distortion from M&A activity and loan loss accounting rules.
1st Source’s TBVPS grew at an excellent 8.3% annual clip over the last five years. TBVPS growth has also accelerated recently, growing by 15.7% annually over the last two years from $33.92 to $45.44 per share.
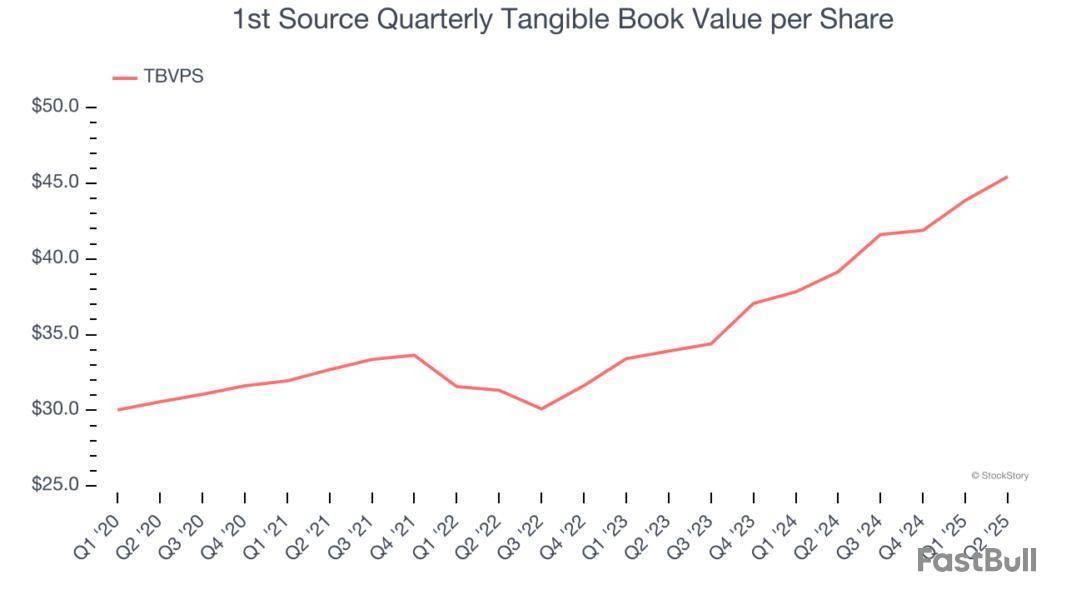
Over the next 12 months, Consensus estimates call for 1st Source’s TBVPS to grow by 10.2% to $50.07, solid growth rate.
Key Takeaways from 1st Source’s Q2 Results
We enjoyed seeing 1st Source beat analysts’ net interest income expectations this quarter. We were also glad its revenue outperformed Wall Street’s estimates. On the other hand, its EPS was in line and its tangible book value per share fell slightly short of Wall Street’s estimates. Overall, this print was mixed but still had some key positives. The stock remained flat at $61.99 immediately after reporting.
So do we think 1st Source is an attractive buy at the current price? What happened in the latest quarter matters, but not as much as longer-term business quality and valuation, when deciding whether to invest in this stock. We cover that in our actionable full research report which you can read here, it’s free.
Net income and EPS rose year-over-year, driven by loan growth and improved net interest margin, but nonperforming assets and credit loss provisions increased amid economic uncertainty and sector-specific risks.
Original document: 1st Source Corporation [SRCE] SEC 10-Q Quarterly Report — Jul. 24 2025
Q2 2025 net income rose 1.43% year-over-year to $37.32 million, with strong loan growth and margin expansion offset by higher credit loss provisions and a $1 million securities loss. Asset quality weakened, but capital and liquidity remain robust.
Original document: 1st Source Corporation [SRCE] SEC 8-K Current Report — Jul. 24 2025
QUARTERLY HIGHLIGHTS
Net income was $37.32 million for the quarter, down slightly from the previous quarter and up $0.53 million or 1.43% from the second quarter of 2024. Diluted net income per common share was $1.51, down $0.01 or 0.66% from the previous quarter and up $0.02 or 1.34% from the prior year's second quarter of $1.49. These results include $1.00 million in pre-tax losses from the sale of approximately $26 million available-for-sale securities executed in the second quarter.
Return on average assets decreased to 1.67% from 1.72% in the previous quarter and 1.69% in the second quarter of 2024. Return on average common shareholders' equity decreased to 12.61% from 13.33% in the previous quarter and 14.41% in the second quarter of 2024.
Cash dividend of $0.38 per common share for the quarter was approved, up 5.56% from the cash dividend declared a year ago.
Average loans and leases grew $169.51 million in the second quarter, up 2.49% from the previous quarter and increased $362.25 million, up 5.48% from the second quarter of 2024.
Tax-equivalent net interest income was $85.35 million, up $4.26 million or 5.25% from the previous quarter and up $11.15 million, or 15.03% from the second quarter a year ago. Tax-equivalent net interest margin was 4.01%, up 11 basis points from the previous quarter and up 42 basis points from the second quarter a year ago.
Provision for credit losses of $7.69 million was recorded during the quarter compared to $3.27 million in the previous quarter and a recovery of provision for credit losses of $0.31 million during the previous year's second quarter. The allowance for loan and lease losses as a percentage of total loans and leases remained consistent with historical levels, rising to 2.30% at June 30, 2025, up from 2.29% at March 31, 2025, and 2.26% at June 30, 2024.
South Bend, Indiana--(Newsfile Corp. - July 24, 2025) - 1st Source Corporation , parent company of 1st Source Bank, today reported quarterly net income of $37.32 million for the second quarter of 2025, down 0.54% compared to $37.52 million in the previous quarter and up 1.43% from the $36.79 million reported in the second quarter a year ago. Year-to-date 2025 net income was $74.84 million, up 12.97% compared to $66.25 million during the first six months of 2024. Diluted net income per common share for the second quarter of 2025 was $1.51, down 0.66% compared to $1.52 in the previous quarter and up 1.34% versus $1.49 in the second quarter of 2024. Diluted net income per common share for the first half of 2025 was $3.02 compared to $2.68 a year earlier. It was another good quarter with solid growth in net interest income offset by higher provision for credit losses and realized losses from strategic repositioning trades in the investment portfolio.
At its July 2025 meeting, the Board of Directors approved a cash dividend of $0.38 per common share, up 5.56% from the cash dividend declared a year ago. The cash dividend is payable to shareholders of record on August 5, 2025, and will be paid on August 15, 2025.
Christopher J. Murphy III, Chairman and Chief Executive Officer, commented, "We are pleased that the strong start in 2025 continued through the second quarter. In spite of the noise in the economy and the uncertainty in the market, we are proud to have achieved a sixth consecutive quarter of margin expansion resulting from higher rates on investment securities, increased average loan and lease balances, and lower deposit costs.
"While still very good, credit was challenged during the quarter with elevated net charge-offs, the majority of which were from one Auto and Light Truck account. Nonperforming assets to loans and leases at June 30, 2025 was 1.06% up from 0.63% at March 31, 2025 and the allowance for loans and lease losses as a percentage of total loans and leases remained strong at 2.30% up from 2.29% the previous quarter.
"Our balance sheet remained healthy during the quarter and is well positioned to handle the continued economic uncertainty, which is impacting our customers and their businesses. Our liquidity position is solid and our historically conservative capital position has been maintained.
"During the second quarter of 2025, we were pleased to learn that 1st Source was named to the annual Bank Honor Roll by Keefe, Bruyette & Woods, Inc. for the seventh consecutive year. We were among just 16 U.S. Banks on the list, placing our long-term performance among the top 5% of eligible banks in the United States. To be eligible, Banks must have more than $500 million in total assets and meet at least one of two criteria: consistent earnings growth over each of the past 10 years, and/or the top 5% of eligible banks based on a 10-year earnings per share compounded annual growth rate. To be named to this list for the seventh year in a row is evidence that our mission to help our clients achieve security, build wealth, and realize their dreams directly correlates with strong financial performance for the long term.
"Additionally, we were honored with the Indiana Banker's Association's (IBA) Commitment to Community award in the category of banks with $3 billion and above in assets. We were excited to be chosen for this award that celebrates bank community service efforts in Indiana. In 2024, 1st Source colleagues taught more than 200 Financial Education classes attracting more than 2,200 estimated attendees in Indiana alone. Additionally, our colleagues logged more than 14,500 volunteer hours, which included holding more than 110 Board seats for a variety of organizations in our communities. This award speaks directly to our Core Value of Community Leadership and we couldn't be more pleased to have accepted it in person at the IBA's Mega Conference in May.
"And finally, our recently opened Carmel Indiana Banking Center celebrated its Grand Opening and Ribbon Cutting in May. This new banking center showcases the Bank's side-by-side banking model. Side-by-side banking invites the client behind the "teller line," enabling the Bank's clients and bankers to have a more transparent and inclusive experience and relationship. We are thrilled to have expanded into Hamilton County, Indiana and are pleased to be able to serve new and existing clients in that market and are welcoming them to come and experience the high level of convenience and service from our banking team right in their hometown," Mr. Murphy concluded.
SECOND QUARTER 2025 FINANCIAL RESULTS
Loans and Leases
Second quarter average loans and leases were $6.97 billion, which was up $169.51 million or 2.49% from the previous quarter, and increased $362.25 million, up 5.48% from the second quarter a year ago. Year-to-date average loans and leases increased $329.04 million to $6.88 billion, up 5.02% from the first six months of 2024. Growth during the quarter occurred primarily within the Commercial and Agricultural, Renewable Energy, and Construction Equipment portfolios.
Deposits
Second quarter average deposits were $7.35 billion, which was up $15.54 million, or 0.21%, from the previous quarter, and up $165.41 million or 2.30% compared to the quarter ended June 30, 2024. Average deposits for the first six months of 2025 were $7.34 billion, an increase of $243.97 million, up 3.44% from the same period a year ago. Average deposit balance growth from the second quarter of 2024 was primarily in interest-bearing demand, savings and non-brokered time deposit balances offset by decreased brokered deposits and noninterest-bearing demand deposits.
Net Interest Income and Net Interest Margin
Second quarter 2025 tax-equivalent net interest income increased $4.26 million to $85.35 million, up 5.25% from the previous quarter and increased $11.15 million, up 15.03% from the second quarter a year ago. For the first six months of 2025, tax equivalent net interest income increased $20.17 million to $166.43 million, up 13.79% from the first half of 2024.
Second quarter 2025 net interest margin was 4.00%, an increase of 11 basis points from the 3.89% in the previous quarter and an increase of 41 basis points from the same period in 2024. On a fully tax-equivalent basis, second quarter 2025 net interest margin was 4.01%, up 11 basis points compared to the 3.90% in the previous quarter, and an increase of 42 basis points from the same period in 2024. The increase from the prior quarter and second quarter of 2024 was primarily due to higher rates on investment securities, increased average loan and lease balances and lower deposit costs. Immaterial net interest charge-offs during the current quarter had no impact on the net interest margin while net interest recoveries contributed seven basis points in the previous quarter and four basis points in the prior year second quarter.
Net interest margin for the first six months of 2025 was 3.95%, an increase of 39 basis points compared 3.56% for the first six months of 2024. Net interest margin on a fully-tax equivalent basis for the first half of 2025 was 3.95% an increase of 38 basis points compared to 3.57% for the first half of the prior year. Net interest recoveries positively contributed four basis points to both the current and previous year-to-date net interest margin.
Noninterest Income
Second quarter 2025 noninterest income of $23.06 million was relatively flat compared to the previous quarter, and to the second quarter a year ago. For the first six months of 2025, noninterest income increased $0.78 million, up 1.73% from the first six months of 2024.
Total noninterest income was lower by 0.20% compared to the previous quarter. The slight decrease from the previous quarter was mainly due to realized losses of $1.00 million from repositioning of available-for-sale securities. The securities sold had a weighted average yield of 1.04% and were replaced with securities having a weighted average yield of 4.18%. Additional decreases in the quarter were from lower insurance contingent commissions received and reduced equipment rental income as demand for operating leases continued to decline. These decreases were almost entirely offset by higher trust and wealth advisory income primarily from seasonal tax preparation fees, a rise in debit card income, higher partnership investment gains from a small business capital investment, and an increase in bank owned life insurance policy claims recognized.
The increase in noninterest income compared to the first six months of 2024 was mainly the result of gains on the sale of renewable energy tax equity investments and gains from a small business capital investment, increased insurance commissions, higher brokerage and commission fees and increased interest rate swap fees. These increases were offset by reduced equipment rental income as demand for operating leases continued to decline, available-for-sale securities losses of $1.00 million and decreases in mortgage banking income from lower sales volumes.
Noninterest Expense
Second quarter 2025 noninterest expense of $52.43 million decreased $0.65 million or 1.22% compared to the prior quarter and increased $2.57 million or 5.15% from the second quarter a year ago. For the first six months of 2025, noninterest expense increased $6.94 million, up 7.04% from the first six months of 2024.
The decrease in noninterest expense compared to the prior quarter, was the result of reduced group insurance claims, and lower leased equipment depreciation offset by higher salaries from normal merit increases and higher incentive compensation, increased furniture and equipment costs and higher data processing costs.
The increase in noninterest expense compared to the second quarter and first six months of 2024 was the result of higher salaries and wages from normal merit increases, increased incentive compensation and higher group insurance claims. Additionally, we saw increased data processing costs from technology projects, fewer gains on the sale of fixed assets and off-lease equipment, and increased furniture, equipment and occupancy expenses. These increases were offset by lower leased equipment depreciation and decreased blanket insurance premiums.
Credit
The allowance for loan and lease losses increased to $163.48 million as of June 30, 2025, or 2.30% of total loans and leases primarily as a result of a weakened forward economic outlook with increased uncertainty. This percentage compared to 2.29% at March 31, 2025, and 2.26% at June 30, 2024. Net charge-offs of $1.87 million were recorded for the second quarter of 2025, compared with net charge-offs of $0.18 million in the prior quarter and net recoveries of $1.99 million in the same quarter a year ago.
The provision for credit losses was $7.69 million for the second quarter of 2025, an increase of $4.43 million from the previous quarter and an increase of $8.00 million compared with the same period in 2024. The increase in the provision expense compared to the prior quarter was due to loan growth, increased net charge-offs and nonaccrual loans and leases, an increase in specific impairments, and higher special attention outstandings, offset by a decrease in the provision for unfunded commitments. The ratio of nonperforming assets to loans and leases was 1.06% as of June 30, 2025, compared to 0.63% on March 31, 2025, and 0.31% on June 30, 2024. The increase in nonperforming assets during the quarter was primarily from one Auto and Light Truck relationship
Capital
As of June 30, 2025, the common equity-to-assets ratio was 13.19%, compared to 12.96% at March 31, 2025, and 11.75% a year ago. The tangible common equity-to-tangible assets ratio was 12.38% at June 30, 2025, compared to 12.14% at March 31, 2025, and 10.91% a year earlier. The Common Equity Tier 1 ratio, calculated under banking regulatory guidelines, was 14.60% at June 30, 2025, compared to 14.71% at March 31, 2025, and 13.74% a year ago.
Capital accretion over the last twelve months has been driven primarily by growth in retained earnings and a reduction in unrealized losses in our short-duration investment securities available-for-sale portfolio.
During the second quarter of 2025, 47,428 shares were repurchased for treasury reducing common shareholders' equity by $2.84 million. Total year-to-date repurchased shares of 54,982 have reduced common shareholder's equity by $3.30 million.
ABOUT 1ST SOURCE CORPORATION
1st Source common stock is traded on the NASDAQ Global Select Market under "SRCE" and appears in the National Market System tables in many daily newspapers under the code name "1st Src." Since 1863, 1st Source has been committed to the success of its clients, individuals, businesses and the communities it serves. For more information, visit www.1stsource.com.
1st Source serves the northern half of Indiana and southwest Michigan and is the largest locally controlled financial institution headquartered in the area. While delivering a comprehensive range of consumer and commercial banking services through its community bank offices, 1st Source has distinguished itself with highly personalized services. 1st Source Bank also competes for business nationally by offering specialized financing services for new and used private and cargo aircraft, automobiles for leasing and rental agencies, medium and heavy-duty trucks, and construction equipment. The Corporation includes 78 banking centers, 18 1st Source Bank Specialty Finance Group locations nationwide, nine Wealth Advisory Services locations, 10 1st Source Insurance offices, and three loan production offices.
FORWARD-LOOKING STATEMENTS
Except for historical information contained herein, the matters discussed in this document express "forward-looking statements." Generally, the words "believe," "contemplate," "seek," "plan," "possible," "assume," "hope," "expect," "intend," "targeted," "continue," "remain," "estimate," "anticipate," "project," "will," "should," "indicate," "would," "may" and similar expressions indicate forward-looking statements. Those statements, including statements, projections, estimates or assumptions concerning future events or performance, and other statements that are other than statements of historical fact, are subject to material risks and uncertainties. 1st Source cautions readers not to place undue reliance on any forward-looking statements, which speak only as of the date made.
1st Source may make other written or oral forward-looking statements from time to time. Readers are advised that various important factors could cause 1st Source's actual results or circumstances for future periods to differ materially from those anticipated or projected in such forward-looking statements. Such factors, among others, include changes in laws, regulations or accounting principles generally accepted in the United States; 1st Source's competitive position within its markets served; increasing consolidation within the banking industry; unforeseen changes in interest rates; unforeseen downturns in the local, regional or national economies or in the industries in which 1st Source has credit concentrations; and other risks discussed in 1st Source's filings with the Securities and Exchange Commission, including its Annual Report on Form 10-K, which filings are available from the SEC. 1st Source undertakes no obligation to publicly update or revise any forward-looking statements.
NON-GAAP FINANCIAL MEASURES
The accounting and reporting policies of 1st Source conform to generally accepted accounting principles ("GAAP") in the United States and prevailing practices in the banking industry. However, certain non-GAAP performance measures are used by management to evaluate and measure the Company's performance. Although these non-GAAP financial measures are frequently used by investors to evaluate a financial institution, they have limitations as analytical tools, and should not be considered in isolation, or as a substitute for analyses of results as reported under GAAP. These include taxable-equivalent net interest income (including its individual components), net interest margin (including its individual components), the efficiency ratio, tangible common equity-to-tangible assets ratio and tangible book value per common share. Management believes that these measures provide users of the Company's financial information a more meaningful view of the performance of the interest-earning assets and interest-bearing liabilities and of the Company's operating efficiency. Other financial holding companies may define or calculate these measures differently.
Management reviews yields on certain asset categories and the net interest margin of the Company and its banking subsidiaries on a fully taxable-equivalent ("FTE") basis. In this non-GAAP presentation, net interest income is adjusted to reflect tax-exempt interest income on an equivalent before-tax basis. This measure ensures comparability of net interest income arising from both taxable and tax-exempt sources. Net interest income on a FTE basis is also used in the calculation of the Company's efficiency ratio. The efficiency ratio, which is calculated by dividing non-interest expense by total taxable-equivalent net revenue (less securities gains or losses and lease depreciation), measures how much it costs to produce one dollar of revenue. Securities gains or losses and lease depreciation are excluded from this calculation to better match revenue from daily operations to operational expenses. Management considers the tangible common equity-to-tangible assets ratio and tangible book value per common share as useful measurements of the Company's equity.
See the table marked "Reconciliation of Non-GAAP Financial Measures" for a reconciliation of certain non-GAAP financial measures used by the Company with their most closely related GAAP measures.
# # #
(charts attached)
| 1st SOURCE CORPORATION | ||||||||||||||
| 2nd QUARTER 2025 FINANCIAL HIGHLIGHTS | ||||||||||||||
| (Unaudited - Dollars in thousands, except per share data) | ||||||||||||||
| Three Months Ended | Six Months Ended | |||||||||||||
| June 30, | March 31, | June 30, | June 30, | June 30, | ||||||||||
| 2025 | 2025 | 2024 | 2025 | 2024 | ||||||||||
| AVERAGE BALANCES | ||||||||||||||
| Assets | $ | 8,962,134 | $ | 8,856,278 | $ | 8,761,006 | $ | 8,909,499 | $ | 8,706,575 | ||||
| Earning assets | 8,543,938 | 8,434,790 | 8,303,518 | 8,489,665 | 8,242,841 | |||||||||
| Investments | 1,476,621 | 1,519,177 | 1,554,362 | 1,497,782 | 1,581,228 | |||||||||
| Loans and leases | 6,968,463 | 6,798,952 | 6,606,209 | 6,884,176 | 6,555,139 | |||||||||
| Deposits | 7,349,084 | 7,333,542 | 7,183,678 | 7,341,356 | 7,097,391 | |||||||||
| Interest bearing liabilities | 5,997,624 | 5,920,255 | 5,922,916 | 5,959,154 | 5,853,199 | |||||||||
| Common shareholders' equity | 1,187,076 | 1,141,922 | 1,027,138 | 1,164,624 | 1,016,712 | |||||||||
| Total equity | 1,246,121 | 1,208,236 | 1,098,740 | 1,227,283 | 1,091,697 | |||||||||
| INCOME STATEMENT DATA | ||||||||||||||
| Net interest income | $ | 85,192 | $ | 80,938 | $ | 74,050 | $ | 166,130 | $ | 145,965 | ||||
| Net interest income - FTE(1) | 85,345 | 81,085 | 74,194 | 166,430 | 146,257 | |||||||||
| Provision (recovery of provision) for credit losses | 7,690 | 3,265 | (314) | 10,955 | 7,163 | |||||||||
| Noninterest income | 23,057 | 23,103 | 23,221 | 46,160 | 45,377 | |||||||||
| Noninterest expense | 52,430 | 53,076 | 49,861 | 105,506 | 98,565 | |||||||||
| Net income | 37,326 | 37,523 | 36,805 | 74,849 | 66,267 | |||||||||
| Net income available to common shareholders | 37,319 | 37,520 | 36,793 | 74,839 | 66,248 | |||||||||
| PER SHARE DATA | ||||||||||||||
| Basic net income per common share | $ | 1.51 | $ | 1.52 | $ | 1.49 | $ | 3.02 | $ | 2.68 | ||||
| Diluted net income per common share | 1.51 | 1.52 | 1.49 | 3.02 | 2.68 | |||||||||
| Common cash dividends declared | 0.38 | 0.36 | 0.34 | 0.74 | 0.68 | |||||||||
| Book value per common share(2) | 48.86 | 47.29 | 42.58 | 48.86 | 42.58 | |||||||||
| Tangible book value per common share(1) | 45.44 | 43.87 | 39.16 | 45.44 | 39.16 | |||||||||
| Market value - High | 63.90 | 67.77 | 53.74 | 67.77 | 55.25 | |||||||||
| Market value - Low | 52.14 | 53.23 | 47.30 | 52.14 | 47.30 | |||||||||
| Basic weighted average common shares outstanding | 24,541,385 | 24,546,819 | 24,495,495 | 24,544,120 | 24,477,292 | |||||||||
| Diluted weighted average common shares outstanding | 24,541,385 | 24,546,819 | 24,495,495 | 24,544,120 | 24,477,292 | |||||||||
| KEY RATIOS | ||||||||||||||
| Return on average assets | 1.67 % | 1.72% | 1.69 % | 1.69 % | 1.53 % | |||||||||
| Return on average common shareholders' equity | 12.61 | 13.33 | 14.41 | 12.96 | 13.10 | |||||||||
| Average common shareholders' equity to average assets | 13.25 | 12.89 | 11.72 | 13.07 | 11.68 | |||||||||
| End of period tangible common equity to tangible assets(1) | 12.38 | 12.14 | 10.91 | 12.38 | 10.91 | |||||||||
| Risk-based capital - Common Equity Tier 1(3) | 14.60 | 14.71 | 13.74 | 14.60 | 13.74 | |||||||||
| Risk-based capital - Tier 1(3) | 16.04 | 16.20 | 15.38 | 16.04 | 15.38 | |||||||||
| Risk-based capital - Total(3) | 17.30 | 17.46 | 16.64 | 17.30 | 16.64 | |||||||||
| Net interest margin | 4.00 | 3.89 | 3.59 | 3.95 | 3.56 | |||||||||
| Net interest margin - FTE(1) | 4.01 | 3.90 | 3.59 | 3.95 | 3.57 | |||||||||
| Efficiency ratio: expense to revenue | 48.43 | 51.01 | 51.26 | 49.70 | 51.51 | |||||||||
| Efficiency ratio: expense to revenue - adjusted(1) | 48.40 | 51.31 | 51.17 | 49.82 | 51.38 | |||||||||
| Net charge-offs to average loans and leases | 0.11 | 0.01 | (0.12) | 0.06 | 0.13 | |||||||||
| Loan and lease loss allowance to loans and leases | 2.30 | 2.29 | 2.26 | 2.30 | 2.26 | |||||||||
| Nonperforming assets to loans and leases | 1.06 | 0.63 | 0.31 | 1.06 | 0.31 | |||||||||
| June 30, | March 31, | December 31, | September 30, | June 30, | ||||||||||
| 2025 | 2025 | 2024 | 2024 | 2024 | ||||||||||
| END OF PERIOD BALANCES | ||||||||||||||
| Assets | $ | 9,087,162 | $ | 8,963,114 | $ | 8,931,938 | $ | 8,763,946 | $ | 8,878,003 | ||||
| Loans and leases | 7,097,969 | 6,863,393 | 6,854,808 | 6,616,100 | 6,652,999 | |||||||||
| Deposits | 7,442,669 | 7,417,765 | 7,230,035 | 7,125,944 | 7,195,924 | |||||||||
| Allowance for loan and lease losses | 163,484 | 157,470 | 155,540 | 152,324 | 150,067 | |||||||||
| Goodwill and intangible assets | 83,895 | 83,895 | 83,897 | 83,902 | 83,907 | |||||||||
| Common shareholders' equity | 1,198,589 | 1,161,459 | 1,111,068 | 1,104,253 | 1,043,515 | |||||||||
| Total equity | 1,257,424 | 1,220,542 | 1,181,506 | 1,175,205 | 1,114,855 | |||||||||
| ASSET QUALITY | ||||||||||||||
| Loans and leases past due 90 days or more | $ | 198 | $ | 122 | $ | 106 | $ | 100 | $ | 185 | ||||
| Nonaccrual loans and leases | 71,732 | 40,540 | 30,613 | 30,678 | 20,297 | |||||||||
| Other real estate | — | — | 460 | — | — | |||||||||
| Repossessions | 3,549 | 2,410 | 155 | 109 | 352 | |||||||||
| Equipment owned under operating leases | 62 | — | — | — | — | |||||||||
| Total nonperforming assets | $ | 75,541 | $ | 43,072 | $ | 31,334 | $ | 30,887 | $ | 20,834 | ||||
(1) See "Reconciliation of Non-GAAP Financial Measures" for more information on this performance measure/ratio.
(2) Calculated as common shareholders' equity divided by common shares outstanding at the end of the period.
(3) Calculated under banking regulatory guidelines.
| 1st SOURCE CORPORATION | ||||||||
| CONSOLIDATED STATEMENTS OF FINANCIAL CONDITION | ||||||||
| (Unaudited - Dollars in thousands) | ||||||||
| June 30, | March 31, | December 31, | June 30, | |||||
| 2025 | 2025 | 2024 | 2024 | |||||
| ASSETS | ||||||||
| Cash and due from banks | $ | 88,810 | $ | 87,816 | $ 76,837 | $ | 89,592 | |
| Federal funds sold and interest bearing deposits with other banks | 60,298 | 135,003 | 47,989 | 179,651 | ||||
| Investment securities available-for-sale, at fair value(amortized cost of $1,530,847, $1,591,072, $1,650,684, and $1,662,184 at June 30, 2025, March 31, 2025, December 31, 2024, and June 30, 2024, respectively) | 1,456,157 | 1,501,877 | 1,536,299 | 1,523,548 | ||||
| Other investments | 22,140 | 23,855 | 23,855 | 24,585 | ||||
| Mortgages held for sale | 4,334 | 2,305 | 2,569 | 2,763 | ||||
| Loans and leases, net of unearned discount: | ||||||||
| Commercial and agricultural | 835,826 | 775,118 | 772,974 | 721,235 | ||||
| Renewable energy | 573,226 | 505,413 | 487,266 | 459,441 | ||||
| Auto and light truck | 972,461 | 955,945 | 948,435 | 1,009,967 | ||||
| Medium and heavy duty truck | 282,875 | 289,837 | 289,623 | 315,157 | ||||
| Aircraft | 1,134,838 | 1,118,099 | 1,123,797 | 1,058,591 | ||||
| Construction equipment | 1,207,209 | 1,171,934 | 1,203,912 | 1,132,556 | ||||
| Commercial real estate | 1,252,750 | 1,230,760 | 1,215,265 | 1,164,598 | ||||
| Residential real estate and home equity | 714,026 | 689,101 | 680,071 | 654,357 | ||||
| Consumer | 124,758 | 127,186 | 133,465 | 137,097 | ||||
| Total loans and leases | 7,097,969 | 6,863,393 | 6,854,808 | 6,652,999 | ||||
| Allowance for loan and lease losses | (163,484) | (157,470) | (155,540) | (150,067) | ||||
| Net loans and leases | 6,934,485 | 6,705,923 | 6,699,268 | 6,502,932 | ||||
| Equipment owned under operating leases, net | 8,653 | 9,864 | 11,483 | 13,886 | ||||
| Premises and equipment, net | 55,602 | 54,778 | 53,456 | 48,201 | ||||
| Goodwill and intangible assets | 83,895 | 83,895 | 83,897 | 83,907 | ||||
| Accrued income and other assets | 372,788 | 357,798 | 396,285 | 408,938 | ||||
| Total assets | $ | 9,087,162 | $ | 8,963,114 | $ | 8,931,938 | $ | 8,878,003 |
| LIABILITIES | ||||||||
| Deposits: | ||||||||
| Noninterest-bearing demand | $ | 1,583,621 | $ | 1,651,479 | $ | 1,639,101 | $ | 1,578,762 |
| Interest-bearing deposits: | ||||||||
| Interest-bearing demand | 2,601,353 | 2,451,169 | 2,544,839 | 2,543,724 | ||||
| Savings | 1,359,841 | 1,392,391 | 1,256,370 | 1,255,154 | ||||
| Time | 1,897,854 | 1,922,726 | 1,789,725 | 1,818,284 | ||||
| Total interest-bearing deposits | 5,859,048 | 5,766,286 | 5,590,934 | 5,617,162 | ||||
| Total deposits | 7,442,669 | 7,417,765 | 7,230,035 | 7,195,924 | ||||
| Short-term borrowings: | ||||||||
| Federal funds purchased and securities sold under agreements to repurchase | 58,242 | 60,025 | 72,346 | 70,767 | ||||
| Other short-term borrowings | 51,816 | 1,152 | 176,852 | 217,450 | ||||
| Total short-term borrowings | 110,058 | 61,177 | 249,198 | 288,217 | ||||
| Long-term debt and mandatorily redeemable securities | 41,850 | 41,210 | 39,156 | 39,136 | ||||
| Subordinated notes | 58,764 | 58,764 | 58,764 | 58,764 | ||||
| Accrued expenses and other liabilities | 176,397 | 163,656 | 173,279 | 181,107 | ||||
| Total liabilities | 7,829,738 | 7,742,572 | 7,750,432 | 7,763,148 | ||||
| SHAREHOLDERS' EQUITY | ||||||||
| Preferred stock; no par value | ||||||||
| Authorized 10,000,000 shares; none issued or outstanding | — | — | — | — | ||||
| Common stock; no par value | ||||||||
| Authorized 40,000,000 shares; issued 28,205,674 shares at June 30, 2025, March 31, 2025, December 31, 2024, and June 30, 2024, respectively | 436,538 | 436,538 | 436,538 | 436,538 | ||||
| Retained earnings | 950,363 | 921,717 | 890,937 | 841,790 | ||||
| Cost of common stock in treasury (3,674,878, 3,643,063, 3,685,512, and 3,698,651 shares at June 30, 2025, March 31, 2025, December 31, 2024, andJune 30, 2024, respectively) | (131,551) | (128,912) | (129,175) | (129,248) | ||||
| Accumulated other comprehensive loss | (56,761) | (67,884) | (87,232) | (105,565) | ||||
| Total shareholders' equity | 1,198,589 | 1,161,459 | 1,111,068 | 1,043,515 | ||||
| Noncontrolling interests | 58,835 | 59,083 | 70,438 | 71,340 | ||||
| Total equity | 1,257,424 | 1,220,542 | 1,181,506 | 1,114,855 | ||||
| Total liabilities and equity | $ | 9,087,162 | $ | 8,963,114 | $ | 8,931,938 | $ | 8,878,003 |
| 1st SOURCE CORPORATION | |||||||||||||
| CONSOLIDATED STATEMENTS OF INCOME | |||||||||||||
| (Unaudited - Dollars in thousands, except per share amounts) | |||||||||||||
| Three Months Ended | Six Months Ended | ||||||||||||
| June 30, | March 31, | June 30, | June 30, | June 30, | |||||||||
| 2025 | 2025 | 2024 | 2025 | 2024 | |||||||||
| Interest income: | |||||||||||||
| Loans and leases | $ | 117,230 | $ | 113,560 | $ | 113,101 | $ | 230,790 | $ | 222,303 | |||
| Investment securities, taxable | 8,602 | 8,153 | 5,900 | 16,755 | 11,979 | ||||||||
| Investment securities, tax-exempt | 297 | 277 | 254 | 574 | 514 | ||||||||
| Other | 1,087 | 1,314 | 1,914 | 2,401 | 2,841 | ||||||||
| Total interest income | 127,216 | 123,304 | 121,169 | 250,520 | 237,637 | ||||||||
| Interest expense: | |||||||||||||
| Deposits | 39,106 | 39,846 | 43,095 | 78,952 | 82,839 | ||||||||
| Short-term borrowings | 809 | 232 | 2,158 | 1,041 | 5,260 | ||||||||
| Subordinated notes | 1,007 | 1,014 | 1,061 | 2,021 | 2,122 | ||||||||
| Long-term debt and mandatorily redeemable securities | 1,102 | 1,274 | 805 | 2,376 | 1,451 | ||||||||
| Total interest expense | 42,024 | 42,366 | 47,119 | 84,390 | 91,672 | ||||||||
| Net interest income | 85,192 | 80,938 | 74,050 | 166,130 | 145,965 | ||||||||
| Provision for credit losses: | |||||||||||||
| Provision for credit losses — loans and leases | 7,884 | 2,112 | 56 | 9,996 | 6,651 | ||||||||
| (Recovery of) provision for credit losses — unfunded loan commitments | (194) | 1,153 | (370) | 959 | 512 | ||||||||
| Total provision (recovery of provision) for credit losses | 7,690 | 3,265 | (314) | 10,955 | 7,163 | ||||||||
| Net interest income after provision for credit losses | 77,502 | 77,673 | 74,364 | 155,175 | 138,802 | ||||||||
| Noninterest income: | |||||||||||||
| Trust and wealth advisory | 7,266 | 6,666 | 7,081 | 13,932 | 13,368 | ||||||||
| Service charges on deposit accounts | 3,189 | 3,071 | 3,203 | 6,260 | 6,273 | ||||||||
| Debit card | 4,567 | 4,149 | 4,562 | 8,716 | 8,763 | ||||||||
| Mortgage banking | 1,116 | 853 | 1,280 | 1,969 | 2,230 | ||||||||
| Insurance commissions | 1,685 | 2,440 | 1,611 | 4,125 | 3,387 | ||||||||
| Equipment rental | 779 | 899 | 1,257 | 1,678 | 2,928 | ||||||||
| Losses on investment securities available-for-sale | (997) | - | - | (997) | - | ||||||||
| Other | 5,452 | 5,025 | 4,227 | 10,477 | 8,428 | ||||||||
| Total noninterest income | 23,057 | 23,103 | 23,221 | 46,160 | 45,377 | ||||||||
| Noninterest expense: | |||||||||||||
| Salaries and employee benefits | 31,800 | 32,115 | 29,238 | 63,915 | 58,810 | ||||||||
| Net occupancy | 3,035 | 3,224 | 2,908 | 6,259 | 5,904 | ||||||||
| Furniture and equipment | 1,684 | 1,347 | 1,265 | 3,031 | 2,414 | ||||||||
| Data processing | 7,410 | 7,291 | 6,712 | 14,701 | 13,212 | ||||||||
| Depreciation - leased equipment | 619 | 718 | 999 | 1,337 | 2,287 | ||||||||
| Professional fees | 1,499 | 1,668 | 1,713 | 3,167 | 3,058 | ||||||||
| FDIC and other insurance | 1,438 | 1,440 | 1,627 | 2,878 | 3,284 | ||||||||
| Business development and marketing | 1,884 | 1,925 | 2,026 | 3,809 | 3,770 | ||||||||
| Other | 3,061 | 3,348 | 3,373 | 6,409 | 5,826 | ||||||||
| Total noninterest expense | 52,430 | 53,076 | 49,861 | 105,506 | 98,565 | ||||||||
| Income before income taxes | 48,129 | 47,700 | 47,724 | 95,829 | 85,614 | ||||||||
| Income tax expense | 10,803 | 10,177 | 10,919 | 20,980 | 19,347 | ||||||||
| Net income | 37,326 | 37,523 | 36,805 | 74,849 | 66,267 | ||||||||
| Net (income) loss attributable to noncontrolling interests | (7) | (3) | (12) | (10) | (19) | ||||||||
| Net income available to common shareholders | $ | 37,319 | $ | 37,520 | $ | 36,793 | $ | 74,839 | $ | 66,248 | |||
| Per common share: | |||||||||||||
| Basic net income per common share | $ | 1.51 | $ | 1.52 | $ | 1.49 | $ | 3.02 | $ | 2.68 | |||
| Diluted net income per common share | $ | 1.51 | $ | 1.52 | $ | 1.49 | $ | 3.02 | $ | 2.68 | |||
| Basic weighted average common shares outstanding | 24,541,385 | 24,546,819 | 24,495,495 | 24,544,120 | 24,477,292 | ||||||||
| Diluted weighted average common shares outstanding | 24,541,385 | 24,546,819 | 24,495,495 | 24,544,120 | 24,477,292 | ||||||||
1st SOURCE CORPORATION
DISTRIBUTION OF ASSETS, LIABILITIES AND SHAREHOLDERS’ EQUITY
INTEREST RATES AND INTEREST DIFFERENTIAL
(Unaudited - Dollars in thousands)
| Three Months Ended | |||||||||||||||||||||
| June 30, 2025 | March 31, 2025 | June 30, 2024 | |||||||||||||||||||
| AverageBalance | Interest Income/Expense | Yield/Rate | AverageBalance | Interest Income/Expense | Yield/Rate | AverageBalance | Interest Income/Expense | Yield/Rate | |||||||||||||
| ASSETS | |||||||||||||||||||||
| Investment securities available-for-sale: | |||||||||||||||||||||
| Taxable | $ | 1,444,203 | $ | 8,602 | 2.39 % | $ | 1,488,005 | $ | 8,153 | 2.22 % | $ | 1,524,751 | $ | $ 5,900 | 1.56 % | ||||||
| Tax exempt(1) | 32,418 | 375 | 4.64 % | 31,172 | 349 | 4.54 % | 29,611 | 319 | 4.33 % | ||||||||||||
| Mortgages held for sale | 3,385 | 55 | 6.52 % | 2,409 | 39 | 6.57 % | 4,179 | 65 | 6.26 % | ||||||||||||
| Loans and leases, net of unearned discount(1) | 6,968,463 | 117,250 | 6.75 % | 6,798,952 | 113,596 | 6.78 % | 6,606,209 | 113,115 | 6.89 % | ||||||||||||
| Other investments | 95,469 | 1,087 | 4.57 % | 114,252 | 1,314 | 4.66 % | 138,768 | 1,914 | 5.55 % | ||||||||||||
| Total earning assets(1) | 8,543,938 | 127,369 | 5.98 % | 8,434,790 | 123,451 | 5.94 % | 8,303,518 | 121,313 | 5.88 % | ||||||||||||
| Cash and due from banks | 67,535 | 64,009 | 60,908 | ||||||||||||||||||
| Allowance for loan and lease losses | (159,418) | (157,318) | (149,688) | ||||||||||||||||||
| Other assets | 510,079 | 514,797 | 546,268 | ||||||||||||||||||
| Total assets | $ | 8,962,134 | $ | 8,856,278 | $ | 8,761,006 | |||||||||||||||
| LIABILITIES AND SHAREHOLDERS' EQUITY | |||||||||||||||||||||
| Interest-bearing deposits | $ | 5,774,752 | $ | 39,106 | 2.72 % | $ | 5,745,134 | $ | 39,846 | 2.81 % | $ | 5,603,880 | $ | 43,095 | 3.09 % | ||||||
| Short-term borrowings: | |||||||||||||||||||||
| Securities sold under agreements to repurchase | 60,863 | 121 | 0.80 % | 58,232 | 104 | 0.72 % | 61,729 | 146 | 0.95 % | ||||||||||||
| Other short-term borrowings | 61,917 | 688 | 4.46 % | 18,450 | 128 | 2.81 % | 159,953 | 2,012 | 5.06 % | ||||||||||||
| Subordinated notes | 58,764 | 1,007 | 6.87 % | 58,764 | 1,014 | 7.00 % | 58,764 | 1,061 | 7.26 % | ||||||||||||
| Long-term debt and mandatorily redeemable securities | 41,328 | 1,102 | 10.70 % | 39,675 | 1,274 | 13.02 % | 38,590 | 805 | 8.39 % | ||||||||||||
| Total interest-bearing liabilities | 5,997,624 | 42,024 | 2.81 % | 5,920,255 | 42,366 | 2.90 % | 5,922,916 | 47,119 | 3.20 % | ||||||||||||
| Noninterest-bearing deposits | 1,574,332 | 1,588,408 | 1,579,798 | ||||||||||||||||||
| Other liabilities | 144,057 | 139,379 | 159,552 | ||||||||||||||||||
| Shareholders' equity | 1,187,076 | 1,141,922 | 1,027,138 | ||||||||||||||||||
| Noncontrolling interests | 59,045 | 66,314 | 71,602 | ||||||||||||||||||
| Total liabilities and equity | $ | 8,962,134 | $ | 8,856,278 | $ | 8,761,006 | |||||||||||||||
| Less: Fully tax-equivalent adjustments | (153) | (147) | (144) | ||||||||||||||||||
| Net interest income/margin (GAAP-derived)(1) | $ | 85,192 | 4.00 % | $ | 80,938 | 3.89 % | $ | 74,050 | 3.59 % | ||||||||||||
| Fully tax-equivalent adjustments | 153 | 147 | 144 | ||||||||||||||||||
| Net interest income/margin - FTE(1) | $ | 85,345 | 4.01 % | $ | 81,085 | 3.90 % | $ | 74,194 | 3.59 % | ||||||||||||
(1) See “Reconciliation of Non-GAAP Financial Measures” for more information on this performance measure/ratio.
| 1st SOURCE CORPORATION | ||||||||||||||||
| DISTRIBUTION OF ASSETS, LIABILITIES AND SHAREHOLDERS' EQUITY | ||||||||||||||||
| INTEREST RATES AND INTEREST DIFFERENTIAL | ||||||||||||||||
| (Unaudited - Dollars in thousands) | ||||||||||||||||
| Six Months Ended | ||||||||||||||||
| June 30, 2025 | June 30, 2024 | |||||||||||||||
| AverageBalance | Interest Income/Expense | Yield/Rate | AverageBalance | Interest Income/Expense | Yield/Rate | |||||||||||
| ASSETS | ||||||||||||||||
| Investment securities available-for-sale: | ||||||||||||||||
| Taxable | $ | 1,465,984 | $ | 16,755 | 2.30 % | $ | 1,550,665 | $ | 11,979 | 1.55 % | ||||||
| Tax exempt(1) | 31,798 | 724 | 4.59 % | 30,563 | 646 | 4.25 % | ||||||||||
| Mortgages held for sale | 2,899 | 94 | 6.54 % | 3,004 | 99 | 6.63 % | ||||||||||
| Loans and leases, net of unearned discount(1) | 6,884,176 | 230,846 | 6.76 % | 6,555,139 | 222,364 | 6.82 % | ||||||||||
| Other investments | 104,808 | 2,401 | 4.62 % | 103,470 | 2,841 | 5.52 % | ||||||||||
| Total earning assets(1) | 8,489,665 | 250,820 | 5.96 % | 8,242,841 | 237,929 | 5.80 % | ||||||||||
| Cash and due from banks | 65,782 | 61,399 | ||||||||||||||
| Allowance for loan and lease losses | (158,374) | (149,335) | ||||||||||||||
| Other assets | 512,426 | 551,670 | ||||||||||||||
| Total assets | $ | 8,909,499 | $ | 8,706,575 | ||||||||||||
| LIABILITIES AND SHAREHOLDERS' EQUITY | ||||||||||||||||
| Interest-bearing deposits | 5,760,025 | 78,952 | 2.76 % | 5,499,367 | 82,839 | 3.03 % | ||||||||||
| Short-term borrowings: | ||||||||||||||||
| Securities sold under agreements to repurchase | 59,555 | 225 | 0.76 % | 54,851 | 193 | 0.71 % | ||||||||||
| Other short-term borrowings | 40,304 | 816 | 4.08 % | 197,313 | 5,067 | 5.16 % | ||||||||||
| Subordinated notes | 58,764 | 2,021 | 6.94 % | 58,764 | 2,122 | 7.26 % | ||||||||||
| Long-term debt and mandatorily redeemable securities | 40,506 | 2,376 | 11.83 % | 42,904 | 1,451 | 6.80 % | ||||||||||
| Total interest-bearing liabilities | 5,959,154 | 84,390 | 2.86 % | 5,853,199 | 91,672 | 3.15 % | ||||||||||
| Noninterest-bearing deposits | 1,581,331 | 1,598,024 | ||||||||||||||
| Other liabilities | 141,731 | 163,655 | ||||||||||||||
| Shareholders' equity | 1,164,624 | 1,016,712 | ||||||||||||||
| Noncontrolling interests | 62,659 | 74,985 | ||||||||||||||
| Total liabilities and equity | $ | 8,909,499 | $ | 8,706,575 | ||||||||||||
| Less: Fully tax-equivalent adjustments | (300) | (292) | ||||||||||||||
| Net interest income/margin (GAAP-derived)(1) | $ | 166,130 | 3.95 % | $ | 145,965 | 3.56 % | ||||||||||
| Fully tax-equivalent adjustments | 300 | 292 | ||||||||||||||
| Net interest income/margin - FTE(1) | $ | 166,430 | 3.95 % | $ | 146,257 | 3.57 % | ||||||||||
(1) See “Reconciliation of Non-GAAP Financial Measures” for more information on this performance measure/ratio.
| 1st SOURCE CORPORATION | |||||||||||||||
| RECONCILIATION OF NON-GAAP FINANCIAL MEASURES | |||||||||||||||
| (Unaudited - Dollars in thousands, except per share data) | |||||||||||||||
| Three Months Ended | Six Months Ended | ||||||||||||||
| June 30, | March 31, | June 30, | June 30, | June 30, | |||||||||||
| 2025 | 2025 | 2024 | 2025 | 2024 | |||||||||||
| Calculation of Net Interest Margin | |||||||||||||||
| (A) | Interest income (GAAP) | $ | 127,216 | $ | 123,304 | $ | 121,169 | $ | 250,520 | $ | 237,637 | ||||
| Fully tax-equivalent adjustments: | |||||||||||||||
| (B) | – Loans and leases | 75 | 75 | 79 | 150 | 160 | |||||||||
| (C) | – Tax exempt investment securities | 78 | 72 | 65 | 150 | 132 | |||||||||
| (D) | Interest income - FTE (A+B+C) | 127,369 | 123,451 | 121,313 | 250,820 | 237,929 | |||||||||
| (E) | Interest expense (GAAP) | 42,024 | 42,366 | 47,119 | 84,390 | 91,672 | |||||||||
| (F) | Net interest income (GAAP) (A-E) | 85,192 | 80,938 | 74,050 | 166,130 | 145,965 | |||||||||
| (G) | Net interest income - FTE (D-E) | 85,345 | 81,085 | 74,194 | 166,430 | 146,257 | |||||||||
| (H) | Annualization factor | 4.011 | 4.056 | 4.022 | 2.017 | 2.011 | |||||||||
| (I) | Total earning assets | $ | 8,543,938 | $ | 8,434,790 | $ | 8,303,518 | $ | $ 8,489,665 | $ | 8,242,841 | ||||
| Net interest margin (GAAP-derived) (F*H)/I | 4.00 % | 3.89 % | 3.59 % | 3.95 % | 3.56 % | ||||||||||
| Net interest margin - FTE (G*H)/I | 4.01 % | 3.90 % | 3.59 % | 3.95 % | 3.57 % | ||||||||||
| Calculation of Efficiency Ratio | |||||||||||||||
| (F) | Net interest income (GAAP) | $ | 85,192 | $ | 80,938 | $ | 74,050 | $ | 166,130 | $ | 145,965 | ||||
| (G) | Net interest income - FTE | 85,345 | 81,085 | 74,194 | 166,430 | 146,257 | |||||||||
| (J) | Plus: noninterest income (GAAP) | 23,057 | 23,103 | 23,221 | 46,160 | 45,377 | |||||||||
| (K) | Less: (gains) losses on investment securities and partnership investments | (739) | (1,427) | (929) | (2,166) | (1,966) | |||||||||
| (L) | Less: depreciation - leased equipment | (619) | (718) | (999) | (1,337) | (2,287) | |||||||||
| (M) | Total net revenue (GAAP) (F+J) | 108,249 | 104,041 | 97,271 | 212,290 | 191,342 | |||||||||
| (N) | Total net revenue - adjusted (G+J-K-L) | 107,044 | 102,043 | 95,487 | 209,087 | 187,381 | |||||||||
| (O) | Noninterest expense (GAAP) | 52,430 | 53,076 | 49,861 | 105,506 | 98,565 | |||||||||
| (L) | Less:depreciation – leased equipment | (619) | (718) | (999) | (1,337) | (2,287) | |||||||||
| (P) | Noninterest expense - adjusted (O-L) | 51,811 | 52,358 | 48,862 | 104,169 | 96,278 | |||||||||
| Efficiency ratio (GAAP-derived) (O/M) | 48.43 % | 51.01 % | 51.26 % | 49.70 % | 51.51 % | ||||||||||
| Efficiency ratio - adjusted (P/N) | 48.40 % | 51.31 % | 51.17 % | 49.82 % | 51.38 % | ||||||||||
| End of Period | |||||||||||||||
| June 30, | March 31, | June 30, | |||||||||||||
| 2025 | 2025 | 2024 | |||||||||||||
| Calculation of Tangible Common Equity-to-Tangible Assets Ratio | |||||||||||||||
| (Q) | Total common shareholders' equity (GAAP) | $ | 1,198,589 | $ | 1,161,459 | $ | 1,043,515 | ||||||||
| (R) | Less: goodwill and intangible assets | (83,895) | (83,895) | (83,907) | |||||||||||
| (S) | Total tangible common shareholders' equity (Q-R) | $ | 1,114,694 | $ | 1,077,564 | $ | 959,608 | ||||||||
| (T) | Total assets (GAAP) | 9,087,162 | 8,963,114 | 8,878,003 | |||||||||||
| (R) | Less: goodwill and intangible assets | (83,895) | (83,895) | (83,907) | |||||||||||
| (U) | Total tangible assets (T-R) | $ | 9,003,267 | $ | 8,879,219 | $ | 8,794,096 | ||||||||
| Common equity-to-assets ratio (GAAP-derived) (Q/T) | 13.19 % | 12.96 % | 11.75 % | ||||||||||||
| Tangible common equity-to-tangible assets ratio (S/U) | 12.38 % | 12.14 % | 10.91 % | ||||||||||||
| Calculation of Tangible Book Value per Common Share | |||||||||||||||
| (Q) | Total common shareholders' equity (GAAP) | $ | 1,198,589 | $ | 1,161,459 | $ | 1,043,515 | ||||||||
| (V) | Actual common shares outstanding | 24,530,796 | 24,562,611 | 24,507,023 | |||||||||||
| Book value per common share (GAAP-derived) (Q/V)*1000 | $ | 48.86 | $ | 47.29 | $ | 42.58 | |||||||||
| Tangible common book value per share (S/V)*1000 | $ | 45.44 | $ | 43.87 | $ | 39.16 | |||||||||
The NASDAQ Stock Market National Market Symbol: "SRCE" (CUSIP #336901 10 3)
Please contact us at shareholder@1stsource.com.
Contact:
Brett Bauer
574-235-2000
To view the source version of this press release, please visit https://www.newsfilecorp.com/release/259943
Net income and EPS increased year-over-year, supported by loan growth, strong margins, and efficiency gains. Capital and credit quality remain robust, with continued dividend growth and digital innovation driving future outlook.
Original document: 1st Source Corporation [SRCE] Slides Release — Jul. 24 2025

Regional banking company 1st Source will be announcing earnings results this Thursday after market close. Here’s what to expect.
1st Source beat analysts’ revenue expectations by 3.1% last quarter, reporting revenues of $104 million, up 10.6% year on year. It was a very strong quarter for the company, with a solid beat of analysts’ net interest income estimates and a decent beat of analysts’ EPS estimates.
Is 1st Source a buy or sell going into earnings? Read our full analysis here, it’s free.
This quarter, analysts are expecting 1st Source’s revenue to grow 7.6% year on year to $104.7 million, improving from the 6.6% increase it recorded in the same quarter last year. Adjusted earnings are expected to come in at $1.47 per share.

The majority of analysts covering the company have reconfirmed their estimates over the last 30 days, suggesting they anticipate the business to stay the course heading into earnings. 1st Source has only missed Wall Street’s revenue estimates once over the last two years, exceeding top-line expectations by 1.6% on average.
Looking at 1st Source’s peers in the regional banks segment, some have already reported their Q2 results, giving us a hint as to what we can expect. City Holding delivered year-on-year revenue growth of 6.3%, beating analysts’ expectations by 3%, and Texas Capital Bank reported revenues up 15.2%, topping estimates by 2.7%. Texas Capital Bank traded up 4.8% following the results.
Read our full analysis of City Holding’s results here and Texas Capital Bank’s results here.
There has been positive sentiment among investors in the regional banks segment, with share prices up 8.2% on average over the last month. 1st Source is up 3.4% during the same time and is heading into earnings with an average analyst price target of $69 (compared to the current share price of $63.02).
When a company has more cash than it knows what to do with, buying back its own shares can make a lot of sense–as long as the price is right. Luckily, we’ve found one, a low-priced stock that is gushing free cash flow AND buying back shares.
StockStory is growing and hiring equity analyst and marketing roles. Are you a 0 to 1 builder passionate about the markets and AI? See the open roles here.

1st Source has had an impressive run over the past six months as its shares have beaten the S&P 500 by 5.1%. The stock now trades at $63.36, marking a 9.5% gain. This was partly due to its solid quarterly results, and the performance may have investors wondering how to approach the situation.
Is now still a good time to buy SRCE? Or is this a case of a company fueled by heightened investor enthusiasm? Find out in our full research report, it’s free.
Why Does SRCE Stock Spark Debate?
Tracing its roots back to 1863 during the Civil War era, 1st Source Corporation is a regional bank holding company that provides commercial, consumer, specialty finance, and wealth management services across Indiana, Michigan, and Florida.
Two Things to Like:
1. Outstanding Long-Term EPS Growth
We track the long-term change in earnings per share (EPS) because it highlights whether a company’s growth is profitable.
1st Source’s EPS grew at an astounding 12.6% compounded annual growth rate over the last five years, higher than its 4.1% annualized revenue growth. This tells us the company became more profitable on a per-share basis as it expanded.

2. Stellar ROE Showcases Lucrative Growth Opportunities
Return on equity, or ROE, tells us how much profit a company generates for each dollar of shareholder equity, a key funding source for banks. Over a long period, banks with high ROE tend to compound shareholder wealth faster through retained earnings, buybacks, and dividends.
Over the last five years, 1st Source has averaged an ROE of 12.1%, excellent for a company operating in a sector where the average shakes out around 7.5% and those putting up 15%+ are greatly admired. This shows 1st Source has a strong competitive moat.

One Reason to be Careful:
Long-Term Revenue Growth Disappoints
In general, banks make money from two primary sources. The first is net interest income, which is interest earned on loans, mortgages, and investments in securities minus interest paid out on deposits. The second source is non-interest income, which can come from bank account, credit card, wealth management, investing banking, and trading fees.
Over the last five years, 1st Source grew its revenue at a mediocre 4.1% compounded annual growth rate. This wasn’t a great result compared to the rest of the bank sector, but there are still things to like about 1st Source.

Final Judgment
1st Source’s merits more than compensate for its flaws, and with its shares beating the market recently, the stock trades at 1.2× forward P/B (or $63.36 per share). Is now the time to initiate a position? See for yourself in our full research report, it’s free.
High-Quality Stocks for All Market Conditions
The market surged in 2024 and reached record highs after Donald Trump’s presidential victory in November, but questions about new economic policies are adding much uncertainty for 2025.
While the crowd speculates what might happen next, we’re homing in on the companies that can succeed regardless of the political or macroeconomic environment. Put yourself in the driver’s seat and build a durable portfolio by checking out our Top 9 Market-Beating Stocks. This is a curated list of our High Quality stocks that have generated a market-beating return of 183% over the last five years (as of March 31st 2025).
Stocks that made our list in 2020 include now familiar names such as Nvidia (+1,545% between March 2020 and March 2025) as well as under-the-radar businesses like the once-micro-cap company Tecnoglass (+1,754% five-year return).
StockStory is growing and hiring equity analyst and marketing roles. Are you a 0 to 1 builder passionate about the markets and AI? See the open roles here.
728 RM B 7/F GEE LOK IND BLDG NO 34 HUNG TO RD KWUN TONG KLN HONG KONG


The risk of loss in trading financial instruments such as stocks, FX, commodities, futures, bonds, ETFs and crypto can be substantial. You may sustain a total loss of the funds that you deposit with your broker. Therefore, you should carefully consider whether such trading is suitable for you in light of your circumstances and financial resources.
No decision to invest should be made without thoroughly conducting due diligence by yourself or consulting with your financial advisors. Our web content might not suit you since we don't know your financial conditions and investment needs. Our financial information might have latency or contain inaccuracy, so you should be fully responsible for any of your trading and investment decisions. The company will not be responsible for your capital loss.
Without getting permission from the website, you are not allowed to copy the website's graphics, texts, or trademarks. Intellectual property rights in the content or data incorporated into this website belong to its providers and exchange merchants.
Not Logged In
Log in to access more features


Log In
Sign Up


