• Trade
  • Markets
  • Copy
  • Contests
  • News
  • 24/7
  • Calendar
  • Q&A
  • Chats
Trending
Screeners
SYMBOL
LAST
BID
ASK
HIGH
LOW
NET CHG.
%CHG.
SPREAD
SPX
S&P 500 Index
6857.13
6857.13
6857.13
6865.94
6827.13
+7.41
+ 0.11%
--
DJI
Dow Jones Industrial Average
47850.93
47850.93
47850.93
48049.72
47692.96
-31.96
-0.07%
--
IXIC
NASDAQ Composite Index
23505.13
23505.13
23505.13
23528.53
23372.33
+51.04
+ 0.22%
--
USDX
US Dollar Index
98.840
98.920
98.840
98.980
98.740
-0.140
-0.14%
--
EURUSD
Euro / US Dollar
1.16585
1.16593
1.16585
1.16715
1.16408
+0.00140
+ 0.12%
--
GBPUSD
Pound Sterling / US Dollar
1.33547
1.33554
1.33547
1.33622
1.33165
+0.00276
+ 0.21%
--
XAUUSD
Gold / US Dollar
4224.01
4224.42
4224.01
4230.62
4194.54
+16.84
+ 0.40%
--
WTI
Light Sweet Crude Oil
59.472
59.502
59.472
59.478
59.187
+0.089
+ 0.15%
--

Community Accounts

Signal Accounts
--
Profit Accounts
--
Loss Accounts
--
View More

Become a signal provider

Sell trading signals to earn additional income

View More

Guide to Copy Trading

Get started with ease and confidence

View More

Signal Accounts for Members

All Signal Accounts

Best Return
  • Best Return
  • Best P/L
  • Best MDD
Past 1W
  • Past 1W
  • Past 1M
  • Past 1Y

All Contests

  • All
  • Trump Updates
  • Recommend
  • Stocks
  • Cryptocurrencies
  • Central Banks
  • Featured News
Top News Only
Share

Kremlin Aide Ushakov Says USA Kushner Is Working Very Actively On Ukrainian Settlement

Share

Norway To Acquire 2 More Submarines, Long-Range Missiles, Daily Vg Reports

Share

Ucb Sa Shares Open Up 7.3% After 2025 Guidance Upgrade, Top Of Bel 20 Index

Share

Shares In Italy's Mediobanca Down 1.3% After Barclays Cuts To Underweight From Equal-Weight

Share

Stats Office - Austrian November Wholesale Prices +0.9% Year-On-Year

Share

Britain's FTSE 100 Up 0.15%

Share

Europe's STOXX 600 Up 0.1%

Share

Taiwan November PPI -2.8% Year-On-Year

Share

Stats Office - Austrian September Trade -230.8 Million EUR

Share

Swiss National Bank Forex Reserves Revised To Chf 724906 Million At End Of October - SNB

Share

Swiss National Bank Forex Reserves At Chf 727386 Million At End Of November - SNB

Share

Shanghai Warehouse Rubber Stocks Up 8.54% From Week Earlier

Share

Turkey's Main Banking Index Up 2%

Share

French October Trade Balance -3.92 Billion Euros Versus Revised -6.35 Billion Euros In September

Share

Kremlin Aide Says Russia Is Ready To Work Further With Current USA Team

Share

Kremlin Aide Says Russia And USA Are Moving Forward In Ukraine Talks

Share

Shanghai Rubber Warehouse Stocks Up 7336 Tons

Share

Shanghai Tin Warehouse Stocks Up 506 Tons

Share

Reserve Bank Of India Chief Malhotra: Goal Is To Have Inflation Be Around 4%

Share

Ukmto Says Master Has Confirmed That The Small Crafts Have Left The Scene, Vessel Is Proceeding To Its Next Port Of Call

TIME
ACT
FCST
PREV
France 10-Year OAT Auction Avg. Yield

A:--

F: --

P: --

Euro Zone Retail Sales MoM (Oct)

A:--

F: --

P: --

Euro Zone Retail Sales YoY (Oct)

A:--

F: --

P: --

Brazil GDP YoY (Q3)

A:--

F: --

P: --

U.S. Challenger Job Cuts (Nov)

A:--

F: --

P: --

U.S. Challenger Job Cuts MoM (Nov)

A:--

F: --

P: --

U.S. Challenger Job Cuts YoY (Nov)

A:--

F: --

P: --

U.S. Initial Jobless Claims 4-Week Avg. (SA)

A:--

F: --

P: --

U.S. Weekly Initial Jobless Claims (SA)

A:--

F: --

P: --

U.S. Weekly Continued Jobless Claims (SA)

A:--

F: --

P: --

Canada Ivey PMI (SA) (Nov)

A:--

F: --

P: --

Canada Ivey PMI (Not SA) (Nov)

A:--

F: --

P: --

U.S. Non-Defense Capital Durable Goods Orders Revised MoM (Excl. Aircraft) (SA) (Sept)

A:--

F: --

P: --
U.S. Factory Orders MoM (Excl. Transport) (Sept)

A:--

F: --

P: --

U.S. Factory Orders MoM (Sept)

A:--

F: --

P: --

U.S. Factory Orders MoM (Excl. Defense) (Sept)

A:--

F: --

P: --

U.S. EIA Weekly Natural Gas Stocks Change

A:--

F: --

P: --

Saudi Arabia Crude Oil Production

A:--

F: --

P: --

U.S. Weekly Treasuries Held by Foreign Central Banks

A:--

F: --

P: --

Japan Foreign Exchange Reserves (Nov)

A:--

F: --

P: --

India Repo Rate

A:--

F: --

P: --

India Benchmark Interest Rate

A:--

F: --

P: --

India Reverse Repo Rate

A:--

F: --

P: --

India Cash Reserve Ratio

A:--

F: --

P: --

Japan Leading Indicators Prelim (Oct)

A:--

F: --

P: --

U.K. Halifax House Price Index YoY (SA) (Nov)

A:--

F: --

P: --

U.K. Halifax House Price Index MoM (SA) (Nov)

A:--

F: --

P: --

France Current Account (Not SA) (Oct)

A:--

F: --

P: --

France Trade Balance (SA) (Oct)

A:--

F: --

P: --

France Industrial Output MoM (SA) (Oct)

A:--

F: --

P: --

Italy Retail Sales MoM (SA) (Oct)

--

F: --

P: --

Euro Zone Employment YoY (SA) (Q3)

--

F: --

P: --

Euro Zone GDP Final YoY (Q3)

--

F: --

P: --

Euro Zone GDP Final QoQ (Q3)

--

F: --

P: --

Euro Zone Employment Final QoQ (SA) (Q3)

--

F: --

P: --

Euro Zone Employment Final (SA) (Q3)

--

F: --

P: --
Brazil PPI MoM (Oct)

--

F: --

P: --

Mexico Consumer Confidence Index (Nov)

--

F: --

P: --

Canada Unemployment Rate (SA) (Nov)

--

F: --

P: --

Canada Labor Force Participation Rate (SA) (Nov)

--

F: --

P: --

Canada Employment (SA) (Nov)

--

F: --

P: --

Canada Part-Time Employment (SA) (Nov)

--

F: --

P: --

Canada Full-time Employment (SA) (Nov)

--

F: --

P: --

U.S. Personal Income MoM (Sept)

--

F: --

P: --

U.S. Dallas Fed PCE Price Index YoY (Sept)

--

F: --

P: --

U.S. PCE Price Index YoY (SA) (Sept)

--

F: --

P: --

U.S. PCE Price Index MoM (Sept)

--

F: --

P: --

U.S. Personal Outlays MoM (SA) (Sept)

--

F: --

P: --

U.S. Core PCE Price Index MoM (Sept)

--

F: --

P: --

U.S. UMich 5-Year-Ahead Inflation Expectations Prelim YoY (Dec)

--

F: --

P: --

U.S. Core PCE Price Index YoY (Sept)

--

F: --

P: --

U.S. Real Personal Consumption Expenditures MoM (Sept)

--

F: --

P: --

U.S. 5-10 Year-Ahead Inflation Expectations (Dec)

--

F: --

P: --

U.S. UMich Current Economic Conditions Index Prelim (Dec)

--

F: --

P: --

U.S. UMich Consumer Sentiment Index Prelim (Dec)

--

F: --

P: --

U.S. UMich 1-Year-Ahead Inflation Expectations Prelim (Dec)

--

F: --

P: --

U.S. UMich Consumer Expectations Index Prelim (Dec)

--

F: --

P: --

U.S. Weekly Total Rig Count

--

F: --

P: --

U.S. Weekly Total Oil Rig Count

--

F: --

P: --

U.S. Consumer Credit (SA) (Oct)

--

F: --

P: --

Q&A with Experts
    • All
    • Chatrooms
    • Groups
    • Friends
    Connecting
    .
    .
    .
    Type here...
    Add Symbol or Code

      No matching data

      All
      Trump Updates
      Recommend
      Stocks
      Cryptocurrencies
      Central Banks
      Featured News
      • All
      • Russia-Ukraine Conflict
      • Middle East Flashpoint
      • All
      • Russia-Ukraine Conflict
      • Middle East Flashpoint

      Search
      Products

      Charts Free Forever

      Chats Q&A with Experts
      Screeners Economic Calendar Data Tools
      Membership Features
      Data Warehouse Market Trends Institutional Data Policy Rates Macro

      Market Trends

      Market Sentiment Order Book Forex Correlations

      Top Indicators

      Charts Free Forever
      Markets

      News

      News Analysis 24/7 Columns Education
      From Institutions From Analysts
      Topics Columnists

      Latest Views

      Latest Views

      Trending Topics

      Top Columnists

      Latest Update

      Signals

      Copy Rankings Latest Signals Become a signal provider AI Rating
      Contests
      Brokers

      Overview Brokers Assessment Rankings Regulators News Claims
      Broker listing Forex Brokers Comparison Tool Live Spread Comparison Scam
      Q&A Complaint Scam Alert Videos Tips to Detect Scam
      More

      Business
      Events
      Careers About Us Advertising Help Center

      White Label

      Data API

      Web Plug-ins

      Affiliate Program

      Awards Institution Evaluation IB Seminar Salon Event Exhibition
      Vietnam Thailand Singapore Dubai
      Fans Party Investment Sharing Session
      FastBull Summit BrokersView Expo
      Recent Searches
        Top Searches
          Markets
          News
          Analysis
          User
          24/7
          Economic Calendar
          Education
          Data
          • Names
          • Latest
          • Prev

          View All

          No data

          Scan to Download

          Faster Charts, Chat Faster!

          Download App
          English
          • English
          • Español
          • العربية
          • Bahasa Indonesia
          • Bahasa Melayu
          • Tiếng Việt
          • ภาษาไทย
          • Français
          • Italiano
          • Türkçe
          • Русский язык
          • 简中
          • 繁中
          Open Account
          Search
          Products
          Charts Free Forever
          Markets
          News
          Signals

          Copy Rankings Latest Signals Become a signal provider AI Rating
          Contests
          Brokers

          Overview Brokers Assessment Rankings Regulators News Claims
          Broker listing Forex Brokers Comparison Tool Live Spread Comparison Scam
          Q&A Complaint Scam Alert Videos Tips to Detect Scam
          More

          Business
          Events
          Careers About Us Advertising Help Center

          White Label

          Data API

          Web Plug-ins

          Affiliate Program

          Awards Institution Evaluation IB Seminar Salon Event Exhibition
          Vietnam Thailand Singapore Dubai
          Fans Party Investment Sharing Session
          FastBull Summit BrokersView Expo

          USD Drop Drives EUR/USD to Resistance, USD/JPY Support Bounce

          FOREX.com

          Economic

          Forex

          Summary:

          It’s so far been another bearish week for the USD as the reversal from last week that started around the threat to fire Jerome Powell has continued.USD/JPY started the week with a sell-off but notably remains well above prior April lows, even as DXY has pushed very close to the three-year lows established just a few weeks ago.EUR/USD has tested a spot of resistance after the ECB meeting and that pair remains vital to directional USD strategies. The FOMC rate decision is on the schedule for next Wednesday and the big question is whether Powell and the Fed will relent enough to signal rate cuts on the way. The market is currently looking for two 25 bp cuts and there’s only three meetings remaining in 2025 after next week’s announcement
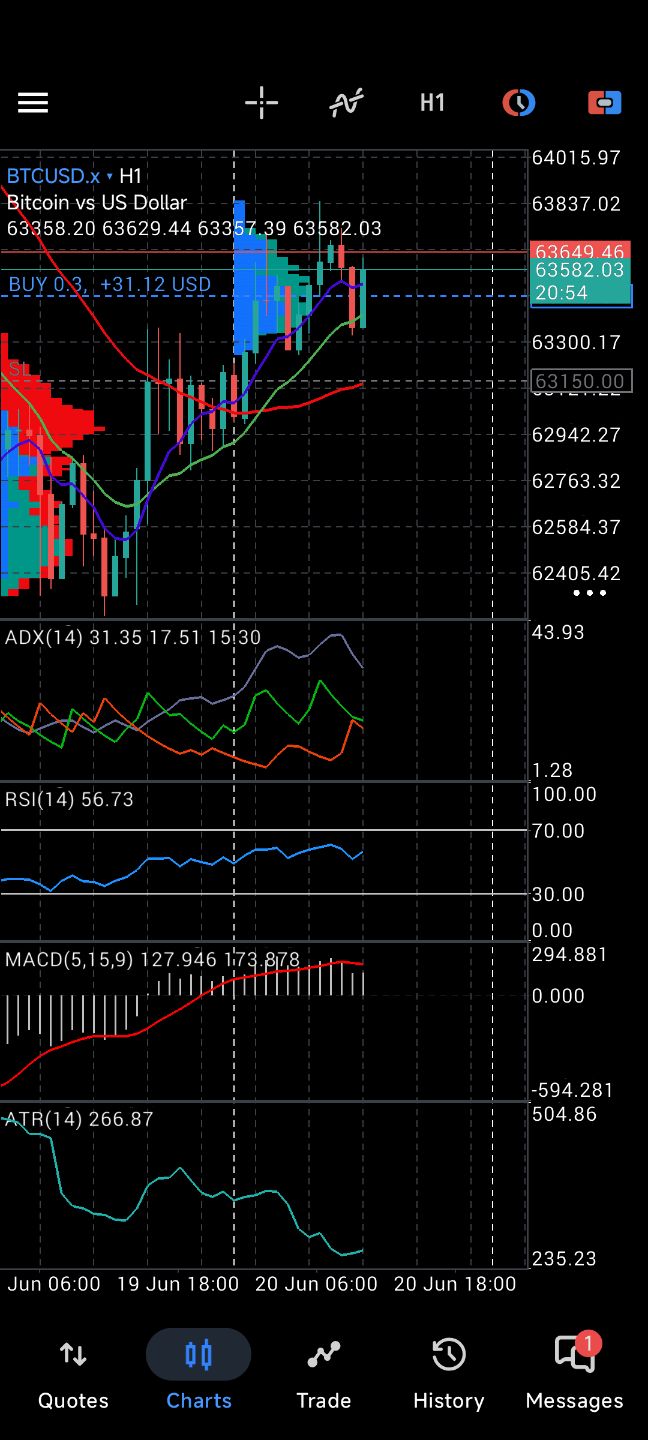
          USD bears have continued to drive following last week’s reversal on the heels of President Trump’s threat to fire Jerome Powell. The Fed has been in blackout this week and that will remain the case until next Wednesday’s rate announcement. There’s no updated projections or guidance for this meeting, so the push-point will be the bank’s statement and the press conference from Jerome Powell.
          So far, Powell has seemed to be averse to talking up rate cuts, much to the chagrin of the current U.S. President. While he’s continued to say that inflation potential from tariffs remains a concern, there’s also the response to inflation from last year’s rate cuts that still looms large. Powell hasn’t talked much about that, however, and instead has shifted the attention to the projection of inflation on the basis of supply disruptions due to tariffs, which has been difficult to find in the data, so far. This has made the bank and Powell a lightning rod for attention, and as I said in the webinar after the CPI report the week before last, it wouldn’t surprise if Trump again threatened to fire Powell for not having softened rates. That threat arrived a day later and it’s helped to produce a pullback in the bullish theme that started around the Q3 open.
          As of current, there’s been a 61.8% retracement of that rally, but more notably it’s the series of lower-lows and lower-highs that have built and have not yet been nullified in the USD.

          U.S. Dollar Four-Hour Price Chart

          USD Drop Drives EUR/USD to Resistance, USD/JPY Support Bounce_1Source:Tradingview

          USD/JPY

          While the US Dollar has made a run towards those prior lows, USD/JPY has retained a more bullish structure and so far today we’ve seen defense of the 145.92 level. I think this pair still has considerable macro overtones with the USD and if we are going to see a broader breakdown in the Dollar, there will likely need to be a larger move of weakness in USD/JPY, perhaps even to the degree that we see larger-scale carry unwind take over and with that there could be reverberations in several other markets, like stocks, such as we saw last July.
          That being said, price is the most important variable and so far we’ve seen defense of support at the same level that held two weeks ago at 145.92.

          USD/JPY Daily Chart

          USD Drop Drives EUR/USD to Resistance, USD/JPY Support Bounce_2

          Source:Tradingview

          EUR/USD

          I wrote about EUR/USD and shared three resistance levels above what was current price at the time. The first of those levels has come into play and this opens the door for a deeper run, towards the 1.1810 or 1.1830 levels that remain overhead. Notably, there was a strong reaction to the ECB rate decision earlier this morning and that has so far produced a higher-low (which matches the lower-highs in DXY looked at above). The bigger question, however, is whether bulls can continue to stretch the move as we near re-tests of the same resistance that stalled buyers just a few weeks ago.

          EUR/USD Four-Hour Price Chart

          USD Drop Drives EUR/USD to Resistance, USD/JPY Support Bounce_3

          Source:Tradingview

          Source:FOREX.com

          To stay updated on all economic events of today, please check out our Economic calendar
          Risk Warnings and Disclaimers
          You understand and acknowledge that there is a high degree of risk involved in trading. Following any strategies or investment methods may lead to potential losses. The content on the site is provided by our contributors and analysts for information purposes only. You are solely responsible for determining whether any trading assets, securities, strategy, or any other product is suitable for investing based on your own investment objectives and financial situation.
          Add to Favorites
          Share

          ECB Holds Steady: The Calm Before the Next Move?

          ACY

          Forex

          Economic

          Why the European Central Bank Hold Makes Sense

          The latest data paints a nuanced picture. On one hand, short-term growth expectations have improved marginally. Industrial production suggests that the eurozone may have skirted a deeper Q2 slowdown, and PMI releases point to some resilience as we step into the second half of the year. The manufacturing shows lot of resilience, as it stand in the 50 area.
          ECB Holds Steady: The Calm Before the Next Move?_1

          Source: S&P, TradingEconomics

          But on the other hand, there are visible cracks forming under the surface. Wage growth is softening. Labour market momentum is starting to cool.
          ECB Holds Steady: The Calm Before the Next Move?_2

          Source: EUROSTAT, TradingEconomics

          Services inflation once the stubborn outlier is also showing signs of easing. This isn’t the end of the inflation fight, but it’s a moment of recalibration.
          ECB Holds Steady: The Calm Before the Next Move?_3

          Source: EUROSTAT, TradingEconomics

          Trade Talks With US and Europe are Looming in the Background

          One of the key narratives I’m watching is the potential for a trade agreement between the EU and the US.While the ECB was quick to call current negotiations “conjecture,” markets are already starting to price in optimism. If a deal is reached particularly one that caps reciprocal tariffs at or below the 15% mark being discussed it could reduce external uncertainty dramatically.
          Why does that matter? Because trade friction has been one of the core variables driving risk premiums and growth revisions in the eurozone. A resolution here could, in theory, provide just enough macro relief to delay or even eliminate further rate cuts. But let’s not get ahead of ourselves the durability and details of any deal will be critical.

          EUR is Feeling it and Taking a Hit

          The euro’s behavior has been fascinating. It started strengthening ahead of the ECB meeting and has largely maintained that momentum.
          ECB Holds Steady: The Calm Before the Next Move?_4

          Source: TradingView

          In my view, the lack of strong pushback from the ECB against euro strength says a lot. While President Lagarde noted they “monitor exchange rates,” it’s clear that the ECB isn’t particularly uncomfortable with current levels. That said, a stronger euro can be a double-edged sword. On the one hand, it helps dampen imported inflation supportive of the disinflation narrative.
          But on the other, it could make the ECB’s life more complicated if it triggers weaker export performance or premature tightening of financial conditions. The balance is delicate, and it will only become more so if the euro breaks to new highs.

          September Is the Real Battleground

          While the July decision felt like a non-event on the surface, the real inflection point will be in September. By then, we’ll have fresh data on wage growth, inflation, and potentially, the resolution (or escalation) of trade negotiations with the US.Personally, I think policymakers are hoping to use the summer as a buffer letting the data speak while avoiding premature commitments.
          If inflation undershoots and expectations keep drifting lower, the argument for at least one more cut remains strong. But a benign trade outcome could blunt that urgency.To me, the ECB isn’t pivoting. It’s waiting. And that’s not a sign of weakness it’s strategic. The risks ahead are still real, from potential supply chain disruptions to political volatility in the US.
          But for now, the central bank appears content to let the current policy stance breathe, watching how the eurozone and the global economy navigates the next few months.The next meeting may bring the clarity everyone’s waiting for. Until then, this pause is less about policy fatigue and more about creating space to reassess. And in these markets, patience might just be the most powerful tool the ECB has left.
          1. Why did the ECB kept the rates unchanged in July 2025?The ECB paused its rate hikes primarily to preserve flexibility. Although inflation is easing and growth has shown modest resilience, the overall macro landscape remains uncertain particularly with ongoing trade negotiations between the EU and the US. The ECB maintained its data-dependent stance, choosing not to pre-commit before more evidence becomes available in the coming months.
          2. What role do EU-US trade talks play in the ECB’s decision-making?The potential for a trade agreement between the EU and the US is a key macro variable. If tariffs are capped at levels close to current assumptions (around 10–15%), that could reduce economic uncertainty and ease downside risks. However, the ECB isn’t factoring in an outcome just yet they’re waiting for official confirmation before adjusting the policy trajectory.
          3. How has the euro reacted to the ECB’s latest announcement?The euro has continued its upward trend, supported by growing optimism around a possible trade deal. Interestingly, the ECB didn’t push back hard against this strength. While President Lagarde noted the importance of monitoring exchange rates, the lack of strong resistance implies that current levels are not a policy concern at least for now.
          4. What economic signals is the ECB watching most closely right now?The ECB is closely monitoring wage growth, services inflation, and labour market conditions. Recent data suggests that domestic price pressures are easing and wage growth is slowing both of which support the disinflation narrative. These metrics, along with Q2 inflation and updated projections, will be key inputs for the September meeting.
          5. Could we still see more rate cuts this year from the ECB?Yes, but it depends on how the data evolves. If inflation continues to undershoot expectations and economic uncertainty remains elevated, another rate cut is likely. However, if a trade deal materializes and stabilizes the outlook, the ECB may scale back its easing path. As of now, markets are pricing in a very modest chance of additional cuts signaling growing confidence in a policy pause.

          Source:ACY

          To stay updated on all economic events of today, please check out our Economic calendar
          Risk Warnings and Disclaimers
          You understand and acknowledge that there is a high degree of risk involved in trading. Following any strategies or investment methods may lead to potential losses. The content on the site is provided by our contributors and analysts for information purposes only. You are solely responsible for determining whether any trading assets, securities, strategy, or any other product is suitable for investing based on your own investment objectives and financial situation.
          Add to Favorites
          Share

          South Korea Seeks To Leverage Trump's Focus On Shipbuilding In Tariff Talks

          Oliver Scott

          Key points:

          ● South Korea seeks tariff advantages via shipbuilding partnership
          ● Trump prioritises U.S. shipbuilding amid China's naval growth
          ● South Korean firms face challenges in U.S. shipbuilding expansion
          ● Trump's interest in Korean shipbuilding goes back decades after he visited shipyard in 1998

          South Korea and the United States have been discussing a shipbuilding tie-up that could include investments to modernise U.S. shipyards and more help to repair the U.S. naval fleet as Seoul seeks better tariff terms, government and industry sources said.

          U.S. President Donald Trump, who has made revitalising the ageing U.S. shipbuilding industry a priority to keep up with China, has repeatedly raised the idea of cooperating with South Korea's cutting-edge shipbuilding industry.

          After investing billions of dollars in shipbuilding capacity, China is the world's biggest shipbuilder. It also has the world's largest maritime fighting force, operating 234 warships to the U.S. Navy's 219, according to the Center for Strategic and International Studies.

          "South Korea can use shipbuilding as leverage to gain some advantage in tariff negotiations," said Kim Suk Kyoon, a former commissioner of the Korea Coast Guard and an expert on maritime strategy.

          Pressure on Seoul to reach a deal on import tariffs has increased after Japan struck a trade agreement with the U.S. this week. South Korean officials are in Washington for trade talks, though a high-level meeting due on Friday was postponed over scheduling.

          South Korea is the world's second-largest shipbuilder and a source with direct knowledge of the talks said any partnership should include South Korean companies investing in the U.S. and helping more in repair and maintenance.

          South Korea's proposal of a "Korea-U.S. manufacturing renaissance partnership" in areas such as shipbuilding had drawn strong U.S. interest, as Washington called for joint efforts to counter China's shipbuilding growth, Seoul trade officials said, declining to be named as they were not authorised to speak to the media.

          The U.S. Treasury Department and Trade Representative did not respond to requests for comment on the progress of talks about shipbuilding.

          South Korea's industry ministry said the U.S. and South Korea were discussing ways to cooperate in manufacturing industries, including shipbuilding, but declined to elaborate.

          POLITICAL WILL

          "The most realistic option for South Korea is, I think, to make a deal to fix a certain number of U.S. navy vessels annually or build parts of new ships," said Kim, a visiting researcher at the Korea Institute for Maritime Strategy.

          Repair of U.S. Navy ships is already happening in South Korea including at Hanwha Ocean'sGeoje shipyard, which has the world's largest dock and a 900-ton "Goliath" crane, according to its website.

          In July, Hanwha Oceansecured its third U.S. Navy maintenance contract and parent Hanwha Group has also been expanding in U.S. shipbuilding.

          It acquired Pennsylvania-based Philly Shipyard for $100 million last year and said this week the shipyard had received an order for a liquefied natural gas carrier to be built together with Hanwha Ocean's Geoje shipyard.

          The conglomerate recently said it obtained U.S. approval to increase its stake in Australian shipbuilder Austalthat owns a shipyard in Alabama building U.S. Navy ships.

          Another South Korean shipbuilder, HD Hyundai, formed a partnership this year with U.S. defence-focused shipbuilder Huntington Ingalls, and joined forces with Edison Chouest Offshore to build container ships in the U.S.

          But, obstacles remain to expanding the relationship.

          There are difficulties obtaining parts and a lack of local talent at U.S. shipyards, said Woo Jong Hoon, a naval architecture and ocean engineering professor at Seoul National University.

          Political will would also be needed given the raft of U.S. regulations that protect domestic shipbuilding.

          A South Korean trade official called for exceptions or changes to the Jones Act, which bars foreign shipyards from building commercial ships to operate in the U.S.

          The Byrnes-Tollefson Amendment also prohibits the construction of navy vessels in foreign shipyards, but the president retains the authority to waive its provisions for national security.

          To skirt U.S. regulations, South Korea could look into ideas like building modules to be delivered to U.S. shipyards or designating a South Korean shipyard as a special district so U.S. Navy ships could be built there, Woo said.

          'WONDERFUL, WONDERFUL'

          Trump's introduction to South Korean shipbuilding probably happened nearly three decades ago.

          The real estate mogul flew in by helicopter to visit the Geoje shipyard in 1998, recounts Lim Moon Kyu, a retired senior executive at the former Daewoo Shipbuilding company who accompanied the VIP guest "with Hollywood looks". Daewoo Shipbuilding was acquired in 2023, becoming Hanwha Ocean.

          At the top of a 100-metre (328 ft) high crane, Trump was given a birds-eye view of the sprawling shipyard on a southern island.

          "Clearly, he was impressed, saying ‘Wonderful, Wonderful’ on top of the crane," said Lim, as he thumbed through photos of the meeting with Trump, who was accompanied by his son Donald Trump Jr.

          Lim believes the visit left Trump with a lasting positive impression that means he is now open to cooperating with Korean shipbuilders to counter China's growing naval power.

          "What carrots do we have to give to the U.S.? Nothing but this (shipbuilding) would be immediately possible," said Lim.

          Source: TradingView

          Risk Warnings and Disclaimers
          You understand and acknowledge that there is a high degree of risk involved in trading. Following any strategies or investment methods may lead to potential losses. The content on the site is provided by our contributors and analysts for information purposes only. You are solely responsible for determining whether any trading assets, securities, strategy, or any other product is suitable for investing based on your own investment objectives and financial situation.
          Add to Favorites
          Share

          US-Japan Trade Deal Hinges On Fund That Remains A Puzzle

          Henry Thompson

          The US and Japan this week reached what President Donald Trump called the largest trade deal in history after Tokyo pledged to set up a $550 billion fund for investment into the US, details of which remain obscure.

          The lack of clarity about how the fund will work adds to questions about the viability of the agreement, which imposes 15% tariffs on Japanese cars and other goods. While the start date and other basic elements are still unknown, Treasury Secretary Scott Bessent warned this week that the US would monitor implementation and bump the rate up to 25% if Trump isn’t satisfied.

          The two countries’ leaders seem at times to be talking at cross purposes. The White House said over $550 billion will be invested under the direction of the US, and Trump said on social media that 90% of that amount will be “given” to America. Prime Minister Shigeru Ishiba, on the other hand, said Japan would offer a mixture of investment, loans, and loan guarantees up to a maximum of $550 billion.

          The fund will be supported by government-owned organizations Japan Bank for International Cooperation and Nippon Export and Investment Insurance, according to Ryosei Akazawa, Japan’s chief negotiator on the deal, who said he also expected the private sector to be involved.

          Who exactly will be funding the bulk of the amount and over what time period remains unknown, with JBIC and NEXI unlikely to have the scale to shoulder it by themselves. In the fiscal year 2024, JBIC invested about ¥263 billion ($1.8 billion) in North America, or roughly 0.3% of the figure now being touted.

          “The Japanese will finance the project and will give it to an operator and the profits will be split 90% to the taxpayers of the United States of America,” Commerce Secretary Howard Lutnick said on Bloomberg TV after the deal was struck, citing potential examples like pharmaceutical plants or chip fabs.

          SoftBank Group Corp. last year pledged to invest $100 billion in the US over the next four years, while Nippon Steel Corp. announced an $11 billion investment in United States Steel Corp.’s operations by 2028, following its $14.1 billion purchase of the Pittsburgh-based producer last month. Both companies have also committed to creating significant employment in the US.

          Whether those figures will be considered part of the deal by the US is also unclear.

          “They came to us with the idea of a Japan-US partnership, where they are going to provide equity, credit guarantees and funding for major projects in the US,” Bessent said. He added that the foreign direct investment pledge is “all new capital.”

          The White House factsheet on the trade deal mentions that Japan will also buy 100 Boeing Co. planes as well as US defense equipment worth additional billions of dollars annually. Akazawa said both these pledges were based on existing plans by Japanese airlines and the government, respectively.

          “We’ve explained to the US side Japan’s thinking behind defense equipment purchases as part of our efforts to strengthen defense capabilities,” said Akazawa. “But strengthening defense wasn’t a topic in the trade and tariff negotiations.”

          Akazawa said he hoped the reduced car tariff rate would take effect as soon as possible, and that he expected the broader 15% levy to be imposed from Aug. 1. There has been no discussion of compliance or monitoring, he added.

          “I’ve traveled to the US eight times,” Akazawa told reporters in Tokyo shortly after returning to Japan. “But I don’t remember discussing how we’ll be implementing our agreement, or how we’ll make sure it’s implemented.”

          Source: Bloomberg Europe

          Risk Warnings and Disclaimers
          You understand and acknowledge that there is a high degree of risk involved in trading. Following any strategies or investment methods may lead to potential losses. The content on the site is provided by our contributors and analysts for information purposes only. You are solely responsible for determining whether any trading assets, securities, strategy, or any other product is suitable for investing based on your own investment objectives and financial situation.
          Add to Favorites
          Share

          Core Inflation In Japan's Capital Stays Above BOJ Target In July

          Frederick Miles

          Key points:

          ● Tokyo July core CPI rises 2.9% yr/yr vs f'cast +3.0%
          ● Index excluding fresh food, fuel rises 3.1% yr/yr in July
          ● BOJ to revise up this year's price forecast at quarterly review
          ● BOJ to hold policy meeting July 30-31, rates seen on hold

          Core consumer inflation in Japan's capital stayed well above the central bank's 2% target in July, data showed on Friday, adding to renewed market expectations for another interest rate hike this year.

          The data will be among factors the Bank of Japan will scrutinise at its next rate review on July 30-31, when the board is expected to revise up this fiscal year's inflation forecast in a quarterly review of its projections.

          The Tokyo consumer price index (CPI), which excludes volatile fresh food costs, rose 2.9% in July from a year earlier, government data showed, slightly below a median market forecast for a 3.0% increase. It followed a 3.1% rise in June.

          A separate index for Tokyo that strips away both fresh food and fuel costs - closely watched by the BOJ as a measure of domestic demand-driven prices - rose 3.1% in July from a year earlier after a 3.1% gain in June, the data showed.

          The BOJ exited a decade-long, radical stimulus programme last year and raised short-term interest rates to 0.5% in January on the view Japan was on the cusp of sustainably hitting its 2% inflation target.

          While the central bank has signalled readiness to raise rates further, the economic impact of higher U.S. tariffs forced it to cut its growth forecasts in May and complicated decisions around the timing of the next rate increase.

          But U.S. President Donald Trump's surprise announcement on Wednesday of a trade deal with Japan has diminished uncertainty over the country's economic outlook, prodding some investors to renew their bets on another rate hike by the end of this year.

          Hours after the announcement, BOJ Deputy Governor Shinichi Uchida said the deal would reduce uncertainty and heighten the chance of Japan durably hitting the bank's inflation target.

          A Reuters poll, taken before the trade deal announcement, showed a majority of economists expect the BOJ to raise its key interest rate again by year-end, though most expect the bank to stand pat at this month's meeting.

          Source: TradingView

          Risk Warnings and Disclaimers
          You understand and acknowledge that there is a high degree of risk involved in trading. Following any strategies or investment methods may lead to potential losses. The content on the site is provided by our contributors and analysts for information purposes only. You are solely responsible for determining whether any trading assets, securities, strategy, or any other product is suitable for investing based on your own investment objectives and financial situation.
          Add to Favorites
          Share

          Unveiling The Crypto Fear & Greed Index: A Crucial Gauge For Market Sentiment

          Samantha Luan

          Economic

          Forex

          Cryptocurrency

          Understanding the Crypto Fear & Greed Index: What Does it Really Measure?

          The Crypto Fear & Greed Index, provided by software development platform Alternative, is far more than just a number; it’s a comprehensive sentiment indicator. Ranging from 0 to 100, where 0 signifies “Extreme Fear” and 100 indicates “Extreme Greed,” this index aims to distill the complex emotional landscape of the crypto market into a single, easily digestible figure. Its core philosophy is rooted in the idea that excessive fear can drive down prices, creating buying opportunities, while irrational exuberance (greed) can lead to market bubbles, signaling potential corrections. Think of it as a temperature gauge for investor psychology.

          But how does it arrive at this number? The index doesn’t rely on a single data point. Instead, it aggregates data from six distinct market factors, each weighted to contribute to the final score:

          ● Volatility (25%): This factor measures the current volatility and maximum drawdowns of Bitcoin, comparing them with average values over 30 and 90 days. Higher volatility often indicates a fearful market, as investors react nervously to price swings.
          ● Market Momentum/Volume (25%): This component assesses the current trading volume and market momentum, comparing them with average values. High buying volume in a positive market often indicates greedy behavior, while low volume or high selling volume might suggest fear.
          ● Social Media (15%): The index analyzes the sentiment and engagement around various cryptocurrency-related hashtags on platforms like Twitter. A surge in positive, hyped discussions can indicate growing greed, whereas negative sentiment suggests fear.
          ● Surveys (15%): Historically, this factor involved weekly polls where thousands of people were asked about their perception of the market. While currently paused, these surveys provided direct insights into investor sentiment.
          ● Bitcoin Dominance (10%): This metric looks at Bitcoin’s share of the total cryptocurrency market capitalization. A rising Bitcoin dominance can indicate fear, as investors might be moving their funds from altcoins into the perceived safety of Bitcoin. Conversely, falling dominance can suggest greed, as funds flow into riskier altcoins in search of higher returns.
          ● Google Trends (10%): By analyzing search queries for terms like “Bitcoin price manipulation” or “Bitcoin bubble,” the index gauges public interest and underlying emotional states. A surge in “bubble” related searches, for example, could signal growing fear.

          Each of these factors contributes to painting a holistic picture of the market’s emotional state, making the Crypto Fear & Greed Index a powerful tool for discerning underlying trends.

          Navigating the “Greed” Zone: What Does a Score of 70 Imply?

          A reading of 70 on the Crypto Fear & Greed Index places the market firmly in the “Greed” zone. This doesn’t necessarily mean an immediate crash is imminent, but it does suggest that investors are feeling optimistic, perhaps even overly confident. Historically, periods of extreme greed have often preceded market corrections, as asset prices become inflated beyond their fundamental value due to speculative buying. The adage, “Be fearful when others are greedy, and greedy when others are fearful,” often comes to mind here.

          The fact that the index fell slightly from 71 to 70 while remaining in ‘Greed’ suggests a minor softening of sentiment, but not a dramatic shift. It implies that while some of the froth might be coming off, the overall market mood remains buoyant. For astute investors, this ‘Greed’ signal serves as a prompt for caution. It encourages a review of portfolios, a potential de-risking strategy, or at least a heightened awareness of the potential for increased volatility.

          How Can Investors Strategically Use the Crypto Fear & Greed Index?

          The Crypto Fear & Greed Index is more than just an interesting statistic; it’s an actionable tool for informed decision-making. Here’s how various types of investors can integrate it into their strategies:

          ● For Contrarian Investors: This index is a goldmine. When the index dips into “Extreme Fear” (0-24), it often signals a potential buying opportunity, as assets may be undervalued due to panic selling. Conversely, when it soars into “Extreme Greed” (75-100), it might be a signal to consider taking profits or reducing exposure, as the market could be overheated.
          ● For Risk Management: Using the index can help investors gauge their risk exposure. If the market is in “Extreme Greed,” it might be wise to tighten stop-losses, reduce leverage, or rebalance portfolios to less volatile assets. When in “Extreme Fear,” one might consider dollar-cost averaging into positions.
          ● Avoiding Emotional Trading: Emotions are a trader’s worst enemy. The index provides an objective, data-driven view of market sentiment, helping investors detach from their own feelings of fear or euphoria and make more rational decisions. It serves as a valuable counter-balance to impulsive actions.
          ● Confirmation and Disconfirmation: Investors can use the index to confirm or disconfirm their own market perceptions. If you feel the market is overheated, and the index is showing “Greed,” it reinforces your view. If you feel it’s a good time to buy, but the index is in “Greed,” it prompts you to reconsider and perhaps wait for a better entry point.

          It’s important to remember that the index is a guide, not a definitive predictor. It works best when combined with fundamental analysis, technical analysis, and a clear understanding of your own risk tolerance.

          The Limitations and Nuances of the Crypto Fear & Greed Index

          While incredibly useful, the Crypto Fear & Greed Index is not without its limitations. It’s a snapshot of market sentiment, not a crystal ball. Here are a few things to keep in mind:

          ● Not a Standalone Indicator: Relying solely on the index for investment decisions is risky. Macroeconomic factors, regulatory changes, technological advancements, and project-specific news can all significantly impact crypto prices, regardless of sentiment.
          ● Bitcoin-Centric Bias: While it incorporates Bitcoin dominance, the index is heavily weighted towards Bitcoin’s performance and sentiment. Altcoin markets can sometimes behave differently, although Bitcoin’s influence is undeniable.
          ● Short-Term Focus: The index is generally more useful for short to medium-term sentiment analysis. Long-term investors might find it less critical than fundamental growth prospects or adoption trends.
          ● Surveys Paused: The current pausing of the “Surveys” component means one data point is missing, potentially affecting its comprehensiveness, though the other five factors still provide robust data.

          Understanding these nuances ensures you use the index as a complementary tool rather than a sole determinant of your investment strategy.

          Historical Insights: When Has the Crypto Fear & Greed Index Told a Story?

          Looking back at its history, the Crypto Fear & Greed Index has often provided compelling insights during pivotal market moments. For instance, during major market crashes, such as the one in May 2021 or the FTX collapse in late 2022, the index plummeted into “Extreme Fear,” often reaching single digits. These periods, though terrifying for many, retrospectively presented significant buying opportunities for those brave enough to “be greedy when others are fearful.”

          Conversely, during euphoric bull runs, the index has consistently lingered in “Extreme Greed,” sometimes for extended periods. The peak of the 2021 bull market saw the index hovering in the 80s and 90s, signaling an overheated market that eventually led to corrections. These historical patterns underscore the index’s utility in identifying potential turning points driven by collective investor psychology.

          Conclusion: Mastering Market Emotions with the Crypto Fear & Greed Index

          The Crypto Fear & Greed Index remains a powerful and insightful tool for anyone navigating the dynamic world of cryptocurrencies. By distilling complex market dynamics into a simple numerical value, it offers a window into the collective emotional state of investors. Its current reading of 70, firmly in the ‘Greed’ zone, serves as a gentle reminder to exercise caution and consider a balanced approach to your investments. While it’s not a crystal ball, understanding the components and implications of this index can significantly enhance your ability to make more informed, less emotionally driven decisions. Combine it with your own research and a solid investment strategy, and you’ll be better equipped to ride the waves of crypto market sentiment.

          Frequently Asked Questions (FAQs)

          1. What does a high score on the Crypto Fear & Greed Index mean?A high score (e.g., above 75, indicating “Extreme Greed”) suggests that investors are feeling overly optimistic and the market might be overheated. Historically, such periods can precede market corrections, making it a time for caution.

          2. What does a low score on the Crypto Fear & Greed Index mean?A low score (e.g., below 25, indicating “Extreme Fear”) suggests that investors are panicking and selling off assets. This often creates potential buying opportunities for contrarian investors, as assets might be undervalued.

          3. How often is the Crypto Fear & Greed Index updated?The index is typically updated daily, providing a fresh perspective on market sentiment each day. This allows investors to track short-term shifts in market psychology.

          4. Can I rely solely on the Crypto Fear & Greed Index for investment decisions?No, it is not recommended to rely solely on the Crypto Fear & Greed Index. While it’s a valuable sentiment indicator, it should be used in conjunction with fundamental analysis, technical analysis, and an understanding of broader macroeconomic factors and your personal financial goals.

          5. Why are surveys currently paused in the Crypto Fear & Greed Index?The provided information states that surveys are currently paused. The exact reason isn’t specified, but it could be due to operational reasons, data collection methodology adjustments, or a temporary suspension of that specific data input.

          Found this article insightful? Share it with your friends, fellow investors, and anyone looking to gain a deeper understanding of market sentiment in the crypto space. Your shares help us continue providing valuable insights and analysis!

          Source: CryptoSlate

          To stay updated on all economic events of today, please check out our Economic calendar
          Risk Warnings and Disclaimers
          You understand and acknowledge that there is a high degree of risk involved in trading. Following any strategies or investment methods may lead to potential losses. The content on the site is provided by our contributors and analysts for information purposes only. You are solely responsible for determining whether any trading assets, securities, strategy, or any other product is suitable for investing based on your own investment objectives and financial situation.
          Add to Favorites
          Share

          A Summer Of Reckoning For Japan’s Economy

          Samantha Luan

          Forex

          Political

          Economic

          Yet beneath the surface of weak GDP figures and softening trade data lies a more complicated and paradoxical reality. Japan continues to maintain near-full employment, stable domestic consumption, and world-class infrastructure, all while carrying the highest public debt-to-GDP ratio in the developed world. Its rural economy is quietly innovating, and major firms are adapting supply chains for resilience rather than efficiency.

          The question confronting policymakers, businesses, and global investors alike extends beyond the question of growth to the question of whether it can reorient the country’s future before a tipping point is reached.

          For every member of the National Diet, the current talk of the day is how to handle the trade headwinds and tariff tensions with the United States. Japan’s exports have now declined for two consecutive months, with June’s drop driven largely by weakened semiconductor and auto shipments to China and the U.S. Washington’s threatened 35 percent tariffs on Japanese imports could tip the economy into a technical recession. This sent the Japanese government scrambling to hold high-level talks in Washington ahead of the August 1 deadline, resulting in a last-minute deal, announced on July 22, that will see the tariff rate lowered to 15 percent – including for Japanese automotive exports. Yet this outcome can’t hide the reality that Japan’s reliance on global exports is again proving to be a vulnerability. The United States remains Japan’s most important trade partner, leaving Tokyo dependent on an increasingly volatile U.S. administration.

          Underneath these immediate trade tensions is the persistent issue of government debt. Japan’s public debt now stands at over 260 percent of GDP, the highest among developed nations. Despite this, bond yields remain remarkably low, and the country continues to finance its massive spending domestically. How long this can last, however, is unclear. Inflation remains above the Bank of Japan’s 2 percent target, wages have only modestly increased, and social spending pressures, particularly from an aging population, are intensifying. A recent Deloitte analysis highlighted how a strong yen, combined with cautious consumer spending, is squeezing corporate margins. The yen’s appreciation has helped tame import costs and rein in inflation, but at the same time, domestic consumers remain hesitant, dampening firms’ ability to pass on costs or foster volume growth.

          With these challenges confronting Japan in both the short and long term, policymakers are beginning to pivot toward “economic security.” This includes, for example, reducing reliance on single-source suppliers, especially from China, and investing more in semiconductors, batteries, and hydrogen. This marks a major shift from past decades, when Japan heavily outsourced manufacturing to reduce costs. The World Economic Forum also highlighted a grassroots dimension to this strategy, showcasing how rural areas are leveraging traditional practices and renewable energy to build local resilience. For example, some prefectures are powering microgrids through biomass and geothermal power projects rooted in centuries-old forest management techniques. With these types of investments and innovations, Japan has demonstrated the know-how to maintain a technological edge over its rivals.

          While the government continues to pursue measures to stimulate domestic growth and address foreign trade issues, redefining economic success in Japan will require addressing its demographic realities. With 29.3 percent of the population over age 65, Japan faces both a labor shortage and a narrowing tax base. For the United States, a sinking birth rate barely makes headlines due to the large influx of immigrants each year. For Japan, however, accepting foreigners into the country comes with immense challenges. Sanseito, for example, enjoyed its best-ever showing in the July 20 upper house election on a platform of opposition to what it described as a “silent invasion” of immigrants. Even tourism has become a sticking point: the government has established a national body to rein in overtourism after a record-breaking 36.8 million tourists came to Japan in 2024.

          Animosity toward foreigners is only one side of the coin of Japan’s demographic crisis. With a birthrate of 1.15 in 2024, Japan entered its 18th consecutive year of deaths outpacing births, with a population drop of nearly a million people. This population decline is closely tied to Japan’s entrenched work culture, which continues to discourage family formation and work-life balance. Add to that the phenomenon of “nominication,” company-sponsored after-work drinking parties meant to strengthen team bonds, which remain a key part of corporate life. While intended to foster workplace cohesion, these gatherings often reinforce work-first priorities and eat into personal time, making parenthood feel like an increasingly difficult choice for many young professionals.

          Meanwhile, another trend offers an illustration of changing attitudes: younger workers are now hiring “resignation agencies” to quit their jobs for them, paying about $350 to bypass the anxiety and discomfort of direct confrontation with their bosses. These resignations are often driven by harassment, unpaid overtime, or inflexible workplace expectations.

          The real question now becomes: will there be a tipping point for Japan? This will come when demographic decline and fiscal strain begin to feed on each other, setting off financial instability or other social problems.

          On the financial front, the recent bond market data is worrying: yields on Japan’s 10‑year government bonds recently hit their highest levels since 2008 at around 1.59 percent, while 30‑year bonds soared to 3.21 percent, reflecting investors’ growing concern over potentially unsustainable debt levels. Even the typically stable auctions for long-term bonds are now failing to find buyers: the 20‑year bond auction recorded its weakest demand since 2012, signaling a dangerous erosion of investor confidence. Should global conditions tighten, say via a U.S. rate spike or tariff shock, Japan could face a debt sell-off that forces either painful fiscal adjustments or, worst-case, a credit rating downgrade, diminishing the government’s ability to roll over its debt. Economists warn such a downgrade could push Japan toward default.

          A further collapse in workforce numbers, paired with shrinking consumer demand, risks a vicious cycle of lower tax revenues, higher debt-servicing costs, and reduced capacity to invest in innovation. In that scenario, societal confidence, measured through voter turnout, trust in institutions, or the stability of public services, could erode, marking a true crisis for Japan’s social contract.

          Source: The Diplomat

          To stay updated on all economic events of today, please check out our Economic calendar
          Risk Warnings and Disclaimers
          You understand and acknowledge that there is a high degree of risk involved in trading. Following any strategies or investment methods may lead to potential losses. The content on the site is provided by our contributors and analysts for information purposes only. You are solely responsible for determining whether any trading assets, securities, strategy, or any other product is suitable for investing based on your own investment objectives and financial situation.
          Add to Favorites
          Share
          FastBull
          Copyright © 2025 FastBull Ltd

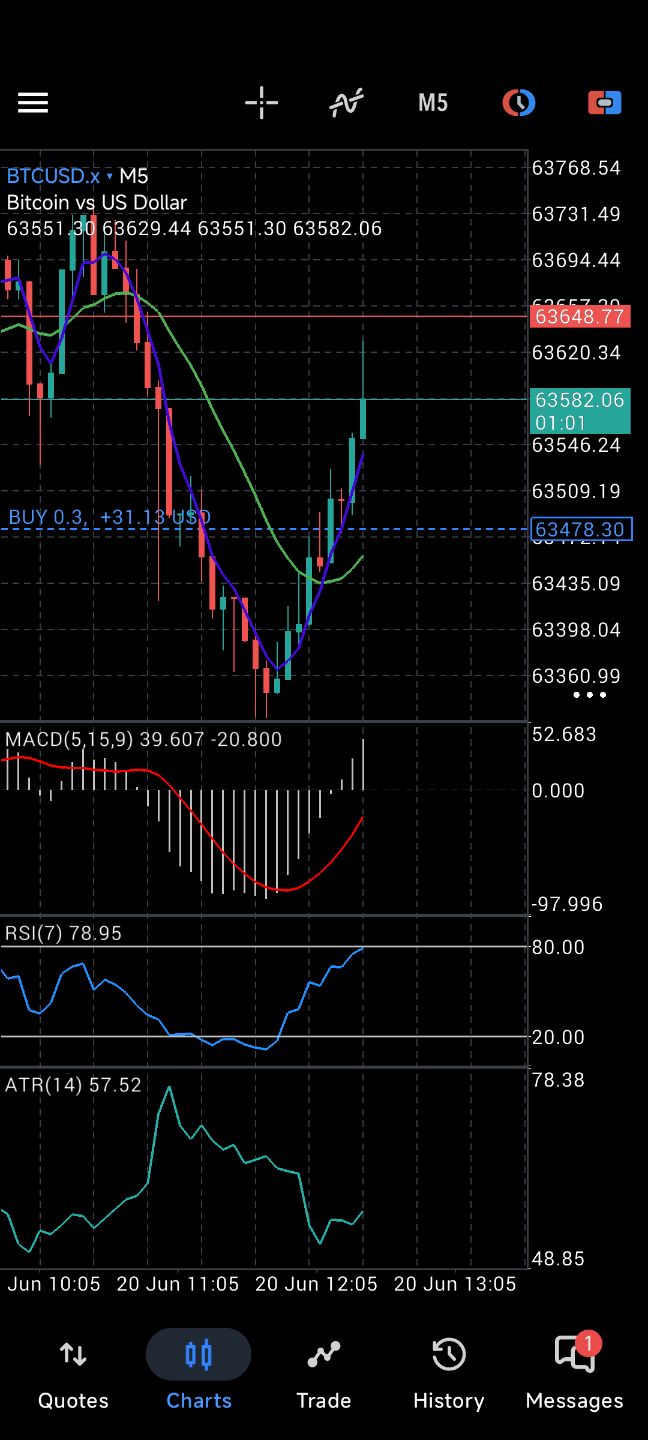
          728 RM B 7/F GEE LOK IND BLDG NO 34 HUNG TO RD KWUN TONG KLN HONG KONG

          TelegramInstagramTwitterfacebooklinkedin
          App Store Google Play Google Play
          Products
          Charts

          Chats

          Q&A with Experts
          Screeners
          Economic Calendar
          Data
          Tools
          Membership
          Features
          Function
          Markets
          Copy Trading
          Latest Signals
          Contests
          News
          Analysis
          24/7
          Columns
          Education
          Company
          Careers
          About Us
          Contact Us
          Advertising
          Help Center
          Feedback
          User Agreement
          Privacy Policy
          Business

          White Label

          Data API

          Web Plug-ins

          Poster Maker

          Affiliate Program

          Risk Disclosure

          The risk of loss in trading financial instruments such as stocks, FX, commodities, futures, bonds, ETFs and crypto can be substantial. You may sustain a total loss of the funds that you deposit with your broker. Therefore, you should carefully consider whether such trading is suitable for you in light of your circumstances and financial resources.

          No decision to invest should be made without thoroughly conducting due diligence by yourself or consulting with your financial advisors. Our web content might not suit you since we don't know your financial conditions and investment needs. Our financial information might have latency or contain inaccuracy, so you should be fully responsible for any of your trading and investment decisions. The company will not be responsible for your capital loss.

          Without getting permission from the website, you are not allowed to copy the website's graphics, texts, or trademarks. Intellectual property rights in the content or data incorporated into this website belong to its providers and exchange merchants.

          Not Logged In

          Log in to access more features

          FastBull Membership

          Not yet

          Purchase

          Become a signal provider
          Help Center
          Customer Service
          Dark Mode
          Price Up/Down Colors

          Log In

          Sign Up

          Position
          Layout
          Fullscreen
          Default to Chart
          The chart page opens by default when you visit fastbull.com