• Trade
  • Markets
  • Copy
  • Contests
  • 24/7
  • Calendar
  • Q&A
  • Chats
Screeners
SYMBOL
LAST
BID
ASK
HIGH
LOW
NET CHG.
%CHG.
SPREAD
SOURCE
SPX
S&P 500 Index
7707.14
7707.14
7707.14
7732.21
7690.94
-36.84
-0.48%
--
--
DJI
Dow Jones Industrial Average
52277.04
52277.04
52277.04
52405.88
52086.13
-198.06
-0.38%
--
--
IXIC
NASDAQ Composite Index
26134.19
26134.19
26134.19
26286.46
26053.16
-415.65
-1.57%
--
--
USDX
US Dollar Index
101.788
101.788
101.868
102.270
101.755
-0.170
-0.17%
--
--
EURUSD
Euro / US Dollar
1.11678
1.11678
1.11685
1.11733
1.11042
+0.00156
+ 0.14%
--
--
GBPUSD
Pound Sterling / US Dollar
1.33702
1.33702
1.33716
1.33796
1.32955
+0.00460
+ 0.35%
--
--
XAUUSD
Gold / US Dollar
4019.06
4019.06
4019.40
4068.79
4005.19
-48.18
-1.18%
--
--
WTI
Light Sweet Crude Oil
101.535
101.535
101.565
101.546
99.081
+0.330
+ 0.33%
--
--

Community Accounts

Signal Accounts
--
Profit Accounts
--
Loss Accounts
--
View More

Become a signal provider

Sell trading signals to earn additional income

View More

Guide to Copy Trading

Get started with ease and confidence

View More

Signal Accounts for Members

All Signal Accounts

Best Return
  • Best Return
  • Best P/L
  • Best MDD
Past 1W
  • Past 1W
  • Past 1M
  • Past 1Y

All Contests

  • All
  • Recommend
  • Stocks
  • Cryptocurrencies
  • Central Banks
  • Trump Updates
  • Featured News
Top News Only
Share

The Premium For Copper In Yangshan Surged To Over $200 Per Tonne On Wednesday And Remained Near That Level, Marking The Highest Level Since Fastmarkets Began Collecting Data In 2017

Share

Jamaica's Unemployment Rate Was 3.4% In The Third Quarter

Share

Eurozone Leaders Will Meet On November 26-27 To Discuss The Nomination Of The Top Position At The European Central Bank

Share

On Thursday (October 29), In Late New York Trading, The ICE Dollar Index Fell 0.16% To 102.033, Trading Between 102.448 And 101.946. It Reached A Daily High At 21:19 Beijing Time Before Quickly Declining. The Bloomberg Dollar Index Rose 0.03% To 1224.39, Trading Between 1222.97 And 1227.16, Also Reaching A Daily High At 21:19

Share

The Houthi Military Said It Would Issue A Statement At 19:50 GMT (03:50 Beijing Time) Announcing Its Military Operation In Saudi Arabia

Share

General Cooper Briefed Trump On Iran At The White House Today

Share

According To Reports, A Senior General Briefed Trump On The Option Of Attacking Iran

Share

Ukrainian President Zelensky: I Have Received A Report That Ukraine Carried Out Two Missile Strikes, Destroying Two Russian Su-34 Fighter Jets And Hitting An Iskander Launcher

Share

Trump: The U.S. Economy Is Booming At A Rate Of 3.4%

Share

Brent Crude Futures Settled At $114.88 A Barrel, Down 44 Cents, Or 0.38%

Share

According To Newsmax: Current And Former U.S. Officials Say The Trump Administration Plans To Strike Iran After The U.S. Midterm Elections Next Week, And U.S. Military Aircraft Are Being Moved To The Relevant Locations, With The MOAB (Mother Of All Bombs) Expected To Be Used

Share

Trump Warned That A Democratic Victory In The Midterm Elections Would Trigger An Economic Depression Similar To That Of 1929

Share

Trump Predicts That Oil And Gasoline Prices Will Fall Sharply

Share

Ukrainian President Zelensky: Ukraine Has Intelligence That Russia Plans To Launch A New Round Of Ballistic Missile Attacks And Needs To Have Countermeasures

Share

Shanghai Futures Exchange Crude Oil Futures Closed Down 1.96% In Night Trading, At 721.50 Yuan Per Barrel. Shanghai Gold Futures Closed Down 1.02% And Shanghai Silver Futures Closed Down 4.10%

Share

US President Trump Has Proposed Renaming The Strait Of Hormuz To The Trump Strait

Share

Trump: The United States Is Working With Venezuela To Extract Millions Of Barrels Of Oil To Supply The United States

Share

US President Trump Reiterated His Intention To Rename The Gulf Of Mexico To The United States Gulf

Share

US President Trump: Canada Has Recently Been Friendly To The United States

Share

Venezuelan Opposition Leader Machado: Those Who Assist In The Transition Process Will Need To Be Guaranteed

TIME
ACT
FCST
PREV
IMPACT
U.K. Mortgage Lending (Sept)

A:--

F: --

P: --
GBPUSD
  • GBPUSD
  • XAUUSD
  • XAGUSD
  • WTI
  • USDX
Euro Zone Consumer Inflation Expectations (Oct)

A:--

F: --

P: --

EURUSD
  • EURUSD
  • XAUUSD
  • XAGUSD
  • WTI
  • USDX
Euro Zone Selling Price Expectations (Oct)

A:--

F: --

P: --

EURUSD
  • EURUSD
  • XAUUSD
  • XAGUSD
  • WTI
  • USDX
Euro Zone Industrial Climate Index (Oct)

A:--

F: --

P: --

EURUSD
  • EURUSD
  • XAUUSD
  • XAGUSD
  • WTI
  • USDX
Euro Zone Consumer Confidence Index Final (Oct)

A:--

F: --

P: --

EURUSD
  • EURUSD
  • XAUUSD
  • XAGUSD
  • WTI
  • USDX
Euro Zone Economic Sentiment Indicator (Oct)

A:--

F: --

P: --

EURUSD
  • EURUSD
  • XAUUSD
  • XAGUSD
  • WTI
  • USDX
Euro Zone Services Sentiment Index (Oct)

A:--

F: --

P: --

EURUSD
  • EURUSD
  • XAUUSD
  • XAGUSD
  • WTI
  • USDX
Italy 5-Year BTP Bond Auction Avg. Yield

A:--

F: --

P: --

EURUSD
  • EURUSD
  • XAUUSD
  • XAGUSD
  • WTI
  • USDX
Italy 10-Year BTP Bond Auction Avg. Yield

A:--

F: --

P: --

EURUSD
  • EURUSD
  • XAUUSD
  • XAGUSD
  • WTI
  • USDX
U.S. Initial Jobless Claims 4-Week Avg. (SA)

A:--

F: --

P: --
XAUUSD
  • XAUUSD
  • XAGUSD
  • WTI
  • USDX
U.S. Weekly Continued Jobless Claims (SA)

A:--

F: --

P: --
XAUUSD
  • XAUUSD
  • XAGUSD
  • WTI
  • USDX
U.S. Real Personal Consumption Expenditures MoM (Sept)

A:--

F: --

P: --
USDX
  • USDX
  • XAUUSD
  • XAGUSD
  • WTI
U.S. PCE Price Index MoM (Sept)

A:--

F: --

P: --

XAUUSD
  • XAUUSD
  • XAGUSD
  • WTI
  • USDX
U.S. Personal Income MoM (Sept)

A:--

F: --

P: --
USDX
  • USDX
  • XAUUSD
  • XAGUSD
  • WTI
U.S. PCE Price Index YoY (SA) (Sept)

A:--

F: --

P: --

XAUUSD
  • XAUUSD
  • XAGUSD
  • WTI
  • USDX
U.S. PCE Price Index Prelim QoQ (SA) (Q3)

A:--

F: --

P: --

XAUUSD
  • XAUUSD
  • XAGUSD
  • WTI
  • USDX
U.S. Core PCE Price Index MoM (Sept)

A:--

F: --

P: --
XAUUSD
  • XAUUSD
  • XAGUSD
  • WTI
  • USDX
U.S. GDP Deflator Prelim QoQ (SA) (Q3)

A:--

F: --

P: --

XAUUSD
  • XAUUSD
  • XAGUSD
  • WTI
  • USDX
U.S. Real Personal Consumption Expenditures Prelim QoQ (Q3)

A:--

F: --

P: --

USDX
  • USDX
  • XAUUSD
  • XAGUSD
  • WTI
U.S. Core PCE Price Index Annualized QoQ Prelim (SA) (Q3)

A:--

F: --

P: --

XAUUSD
  • XAUUSD
  • XAGUSD
  • WTI
  • USDX
U.S. Personal Outlays MoM (SA) (Sept)

A:--

F: --

P: --

XAUUSD
  • XAUUSD
  • XAGUSD
  • WTI
  • USDX
U.S. Real GDP Annualized QoQ Prelim (SA) (Q3)

A:--

F: --

P: --

XAUUSD
  • XAUUSD
  • XAGUSD
  • WTI
  • USDX
U.S. Weekly Initial Jobless Claims (SA)

A:--

F: --

P: --
XAUUSD
  • XAUUSD
  • XAGUSD
  • WTI
  • USDX
U.S. Core PCE Price Index YoY (Sept)

A:--

F: --

P: --

XAUUSD
  • XAUUSD
  • XAGUSD
  • WTI
  • USDX
Euro Zone ECB Deposit Rate

A:--

F: --

P: --

EURUSD
  • EURUSD
  • XAUUSD
  • XAGUSD
  • WTI
  • USDX
Euro Zone ECB Main Refinancing Rate

A:--

F: --

P: --

EURUSD
  • EURUSD
  • XAUUSD
  • XAGUSD
  • WTI
  • USDX
Euro Zone ECB Marginal Lending Rate

A:--

F: --

P: --

EURUSD
  • EURUSD
  • XAUUSD
  • XAGUSD
  • WTI
  • USDX
ECB Monetary Policy Statement
ECB Press Conference
U.S. EIA Weekly Natural Gas Stocks Change

A:--

F: --

P: --

WTI
  • WTI
  • XAUUSD
  • XAGUSD
  • USDX
Brazil CAGED Net Payroll Jobs (Sept)

--

F: --

P: --

U.S. Weekly Treasuries Held by Foreign Central Banks

--

F: --

P: --

U.S. Dallas Fed PCE Price Index YoY (Sept)

--

F: --

P: --

South Korea Retail Sales MoM (Sept)

--

F: --

P: --

South Korea Services Output MoM (Sept)

--

F: --

P: --

South Korea Industrial Output MoM (SA) (Sept)

--

F: --

P: --

Japan Tokyo CPI MoM (Oct)

--

F: --

P: --

Japan Jobs to Applicants Ratio (Sept)

--

F: --

P: --

Japan Tokyo CPI YoY (Oct)

--

F: --

P: --

Japan Tokyo Core CPI YoY (Oct)

--

F: --

P: --

Japan Unemployment Rate (Sept)

--

F: --

P: --

Japan Tokyo CPI MoM (Excl. Food & Energy) (Oct)

--

F: --

P: --

Japan Retail Sales MoM (SA) (Sept)

--

F: --

P: --
Japan Retail Sales YoY (Sept)

--

F: --

P: --
Japan Industrial Output Prelim MoM (Sept)

--

F: --

P: --

Japan Industrial Output Prelim YoY (Sept)

--

F: --

P: --

Japan Industrial Inventory MoM (Sept)

--

F: --

P: --

Japan Retail Sales (Sept)

--

F: --

P: --

Australia PPI YoY (Q3)

--

F: --

P: --

Australia PPI QoQ (Q3)

--

F: --

P: --

Japan Benchmark Interest Rate

--

F: --

P: --

BOJ Monetary Policy Statement
Japan Construction Orders YoY (Sept)

--

F: --

P: --

Japan New Housing Starts YoY (Sept)

--

F: --

P: --

France GDP Prelim YoY (SA) (Q3)

--

F: --

P: --

BOJ Press Conference
Turkey Economic Sentiment Indicator (Oct)

--

F: --

P: --

U.K. Nationwide House Price Index MoM (Oct)

--

F: --

P: --

U.K. Nationwide House Price Index YoY (Oct)

--

F: --

P: --

France PPI MoM (Sept)

--

F: --

P: --

Germany Unemployment Rate (SA) (Oct)

--

F: --

P: --

Q&A with Experts
    • All
    • Chatrooms
    • Groups
    • Friends
    Matthew flag
    U.S. Core PCE Price Index YoY (Sept)
    Act:3.1,Prev:3,Fcst:3.1
    Economic Calendar
    Matthew flag
    EuroTrader
    @Matthewlollllss its the best trading day for you yet but its one of the good daus for me over here
    @EuroTraderyou are a big trader so this is normal to you
    EuroTrader flag
    EuroTrader
    @Matthewquick and easy take profit level tagged already and price is gonna continue to the downside
    EuroTrader flag
    Matthew
    @EuroTraderyou are a big trader so this is normal to you
    @Matthewthis data was one of the reasons why we saw the volatility we experienced earlier
    Matthew flag
    EuroTrader
    @Matthewthis data was one of the reasons why we saw the volatility we experienced earlier
    @EuroTraderokay but we do t trade the news
    Matthew flag
    EuroTrader
    @Matthewquick and easy take profit level tagged already and price is gonna continue to the downside
    @EuroTraderthank you nice again for this trade
    EuroTrader flag
    Matthew
    @EuroTraderokay but we do t trade the news
    @Matthewi dont trade the news but we trade the after eg]ffects of the news, thats how we do it
    EuroTrader flag
    Matthew
    @EuroTraderthank you nice again for this trade
    @Matthewits okay brother, its good you had a great trading day but much more than that is how to react after now
    Matthew flag
    EuroTrader
    @Matthewits okay brother, its good you had a great trading day but much more than that is how to react after now
    @EuroTraderi need to learn how to do this by myself
    Matthew flag
    EuroTrader
    @Matthewits okay brother, its good you had a great trading day but much more than that is how to react after now
    @EuroTraderI wish we were in the same country
    EuroTrader flag
    Matthew
    @EuroTraderi need to learn how to do this by myself
    @Matthewits very important that you learn how to trade for your self and not depend on just signals
    EuroTrader flag
    Matthew
    @EuroTraderI wish we were in the same country
    @Matthewe dont actually have to be in the same country for you tolearn how to trade the markets, just keep learning
    EuroTrader flag
    Matthew
    @EuroTraderi need to learn how to do this by myself
    @Matthewi share some things with you here and you are also learning from world chlass edge so you are good to go
    bilal flag
    hi
    bilal flag
    anybody here \
    bilal flag
    any trading edge strategy
    RPGFX flag
    bilal
    hi
    @bilal Hello hello brother, how are you doing today?
    RPGFX flag
    bilal
    anybody here \
    @bilalyeah, a lot of traders are present in here and I am one of them
    RPGFX flag
    bilal
    any trading edge strategy
    @bilalYes, we all here have our individual and unique edge with which we trade the market
    RPGFX flag
    Matthew
    @EuroTraderi need to learn how to do this by myself
    @Matthew That is always the goal of any young trader who will eventually make it
    Type here...
    Add Symbol or Code

      No matching data

      All
      Recommend
      Stocks
      Cryptocurrencies
      Central Banks
      Trump Updates
      Featured News
      • All
      • Russia-Ukraine Conflict
      • Middle East Flashpoint
      • All
      • Russia-Ukraine Conflict
      • Middle East Flashpoint
      Search
      Products

      Charts Free Forever

      Chats Q&A with Experts
      Screeners Economic Calendar Data Tools
      Membership Features
      Data Warehouse Market Trends Institutional Data Policy Rates Macro

      Market Trends

      Market Sentiment Order Book Forex Correlations

      Top Indicators

      Charts Free Forever
      Markets

      News

      24/7 Analysis Education

      Latest Views

      Latest Update

      Signals

      Copy Rankings Latest Signals Become a signal provider AI Rating
      Contests
      Brokers

      Overview Brokers Assessment Rankings Regulators News Claims
      Broker listing Forex Brokers Comparison Tool Live Spread Comparison Scam
      Q&A Complaint Scam Alert Videos Tips to Detect Scam
      More

      Business
      Events
      Careers About Us Advertising Help Center

      White Label

      Broker API

      Data API

      Web Plug-ins

      Affiliate Program

      Awards Institution Evaluation IB Seminar Salon Event Exhibition
      Vietnam Thailand Singapore Dubai
      Fans Party Investment Sharing Session
      FastBull Summit BrokersView Expo
      Recent Searches
        Top Searches
          Markets
          Analysis
          User
          24/7
          Economic Calendar
          Education
          Data
          • Names
          • Latest
          • Prev

          View All

          No data

          Scan to Download

          Faster Charts, Chat Faster!

          Download
          English
          • English
          • Español
          • العربية
          • Bahasa Indonesia
          • Bahasa Melayu
          • Tiếng Việt
          • ภาษาไทย
          • Français
          • Italiano
          • Türkçe
          • Русский язык
          • 简中
          • 繁中
          Open Account
          Search
          Products
          Charts Free Forever
          Markets
          News
          Signals

          Copy Rankings Latest Signals Become a signal provider AI Rating
          Contests
          Brokers

          Overview Brokers Assessment Rankings Regulators News Claims
          Broker listing Forex Brokers Comparison Tool Live Spread Comparison Scam
          Q&A Complaint Scam Alert Videos Tips to Detect Scam
          More

          Business
          Events
          Careers About Us Advertising Help Center

          White Label

          Broker API

          Data API

          Web Plug-ins

          Affiliate Program

          Awards Institution Evaluation IB Seminar Salon Event Exhibition
          Vietnam Thailand Singapore Dubai
          Fans Party Investment Sharing Session
          FastBull Summit BrokersView Expo

          Two Beats, One Miss: AMD Delivers The Quarter But Guidance Spooks The Market

          SAXO

          Stocks

          Summary:

          Key takeaways AMD beats on the quarter, led by data-centre strength, but investors focus on what comes next.

          Key takeaways

          · AMD beats on the quarter, led by data-centre strength, but investors focus on what comes next.

          · China-related AI chip shipments lift revenue, yet they also muddy margins and visibility.

          · The key 2026 question is repeatability: more named deals, more volume, and clearer timing.

          A quarter that looks good, and a reaction that does not

          Late on 3 February 2026 in the US, and early 4 February 2026 in Europe, Advanced Micro Devices (AMD) reports a strong quarter. Then the share price falls in after-hours trading. That sounds contradictory, but it is actually very normal in the artificial intelligence era.

          AMD's numbers say "we are executing". The market's reaction says "show me the next step". In plain terms: this is not a test of whether demand exists. It is a test of whether amd can turn demand into a predictable, repeatable business that investors can model with confidence.

          That is the hook. Amd is trying to move from "credible challenger" to "credible alternative". The difference is not marketing. It is a steady flow of shipments, margins, and customer wins that do not require a footnote.

          The engine room looks healthy

          Start with what works. AMD reports fourth-quarter revenue of 10.3 billion USD and adjusted earnings per share (earnings per share is profit per share) of 1.53 USD. Data-centre revenue, the part most linked to artificial intelligence spending, rises 39% year on year to about 5.4 billion USD.
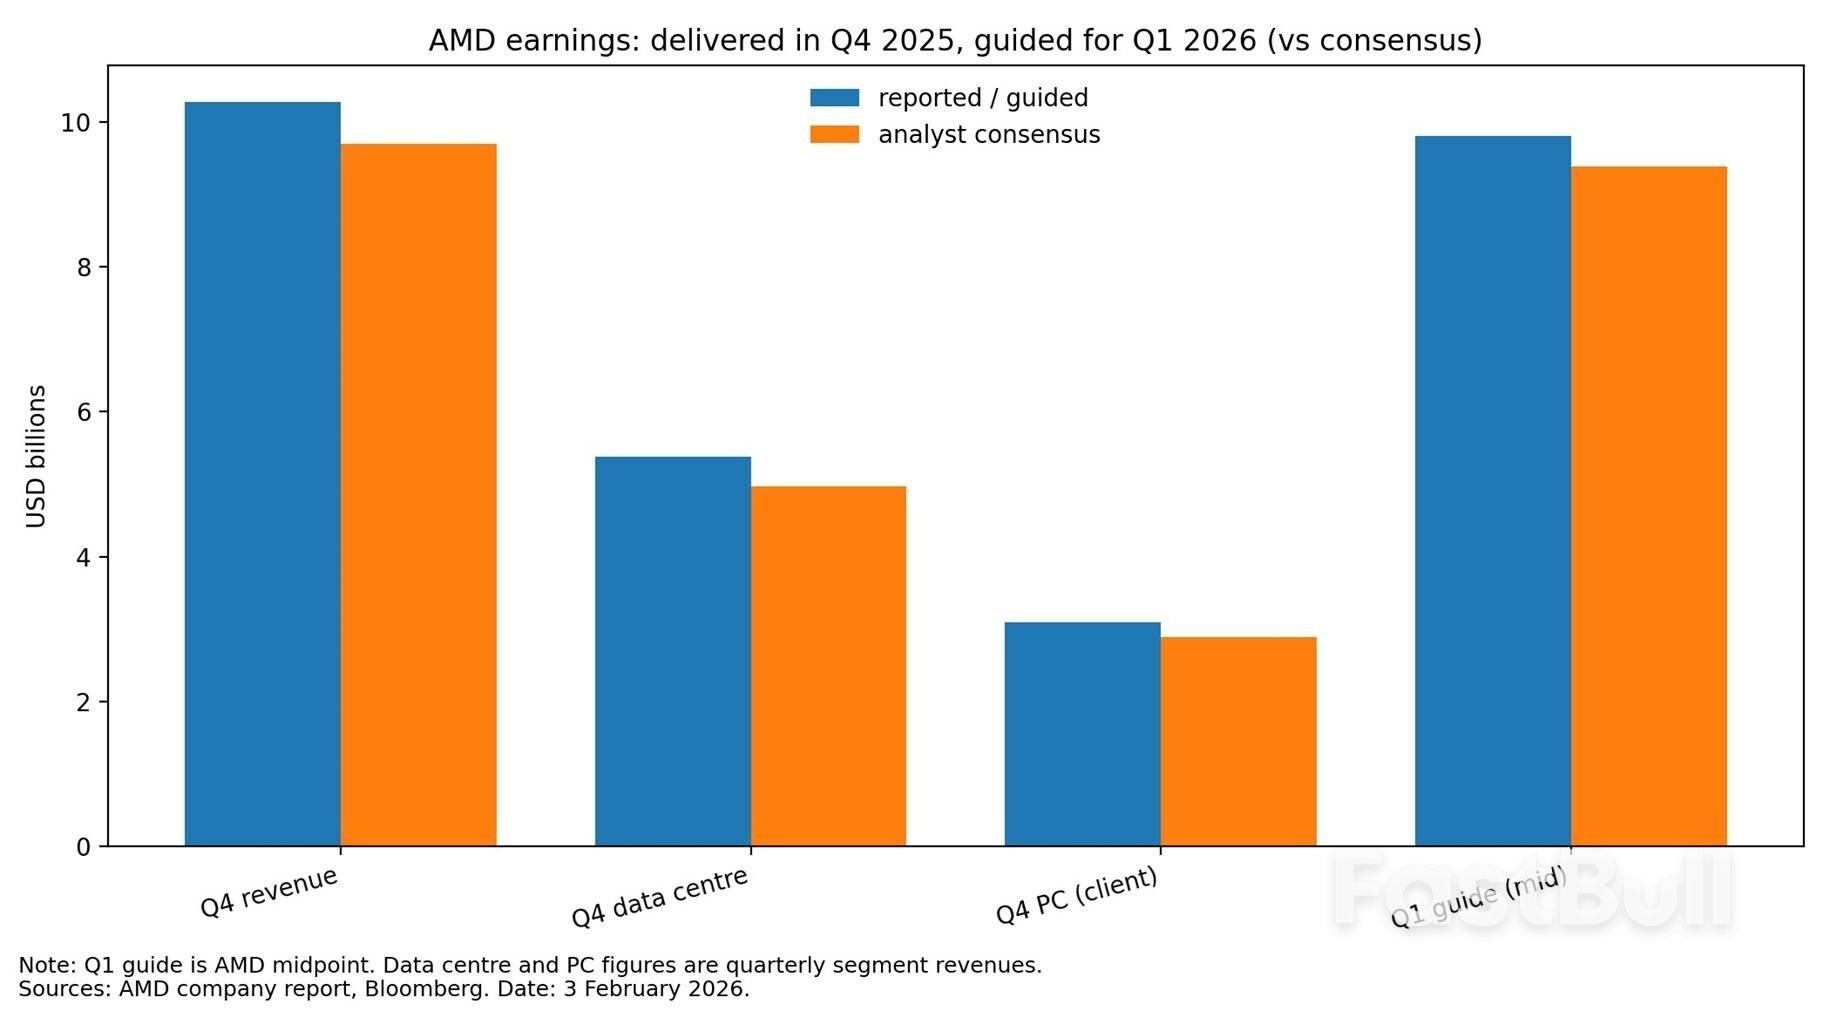
          Data centres are the factories of modern software, and AMD is selling more machines into those factories. That matters because data-centre chips tend to be higher value than many consumer chips. It is also where long-term growth lives, because cloud companies and large enterprises keep building computing capacity.

          The client side also improves. Pc-related revenue rises, helped by demand for newer pc chips and market share gains. This is not as fashionable as artificial intelligence, but it matters because it keeps the business balanced. AMD is at its best when it grows in data centres without needing the pc market to be perfect.

          So why does the share price fall? Because earnings are not a history exam. They are a confidence exam.

          The "helpful" China boost that complicates the picture

          AMD's quarter includes a material contribution from shipping older-generation Instinct MI308 data-centre graphics processing units (graphics processing units are specialised chips for heavy computing) to China. That adds revenue, and it shows AMD can operate inside export rules.

          But it also creates two problems for the story investors want.

          First, it can pressure margins. AMD itself points out that if you strip out both the inventory reserve reversal and the China MI308 shipments, adjusted gross margin would look lower than the headline suggests. In other words, some of the profit quality is not as clean as it appears at first glance.

          Second, it reduces visibility. Those China sales are not guaranteed, and licensing for newer products remains uncertain. Management signals that China MI308 revenue falls sharply in the next quarter, which makes the near-term path bumpier.

          This is not a "China is good" or "China is bad" issue. It is a "China is harder to forecast" issue. Markets dislike fog. They can handle rain.

          Guidance is the real battleground

          For the first quarter of 2026, AMD guides to revenue of about 9.8 billion USD, plus or minus 0.3 billion USD. That is above the average Bloomberg analyst estimate. Yet the market reaction is negative.

          The reason sits in expectations, not arithmetic.

          AMD is in the shadow of a dominant rival in artificial intelligence chips. Investors are not only asking, "are you growing?". They are asking, "are you closing the gap fast enough to justify the valuation and the excitement?". Some investors were looking for a clearer acceleration, especially in the parts of the business tied to data-centre accelerators.

          Management keeps a bullish long-term tone, including the idea that artificial intelligence revenue can reach the tens of billions of dollars in 2027. That might be true. The market simply wants a tighter bridge between today's shipments and that future claim.

          Think of it like a new restaurant that promises it will be fully booked next year. Great. But investors still want to see the reservations for next week.

          Risks: where the road could narrow

          The first risk is an expectations gap. Artificial intelligence stocks can fall even on good results if the outlook does not match the market's imagination. The early warning sign is guidance that beats consensus but still fails to explain "why growth accelerates from here".

          The second risk is margin noise. China mix, inventory adjustments, and product transitions can all move gross margin in ways that confuse investors. The early warning sign is a strong revenue print paired with cautious margin commentary.

          The third risk is concentration. Big artificial intelligence deals often involve a small number of very large customers. That can produce lumpy quarters. The early warning sign is when growth depends on a few one-off shipments rather than a broad ramp across many customers.

          Investor playbook

          · Watch data-centre revenue growth and margin commentary together. Growth without stable margins often triggers scepticism.

          · Track product and platform milestones. Look for clear timelines on next-generation accelerators and systems, not only ambition.

          · Listen for customer breadth. More named wins across cloud, enterprise, and public sector lowers "one big deal" risk.

          · Separate "quarter quality" from "story quality". One can be strong while the other still needs proof.

          The market is not rejecting the strategy, it is asking for receipts

          AMD delivers a quarter that looks genuinely solid. Data-centre momentum improves, pcs rebound, and management sounds confident about demand. On paper, this is a company moving in the right direction.

          But the share price reaction is a reminder of what artificial intelligence investing looks like in 2026. It is not enough to say the opportunity is huge. The market wants a clean chain from orders to shipments to margins, repeated quarter after quarter, with fewer special items and fewer "this part is complicated" footnotes.

          AMD's challenge is simple to state and hard to execute: turn promise into a habit. When the receipts become boringly consistent, the stock reaction usually becomes boring too. That is often a compliment.

          Source: SAXO

          Risk Warnings and Disclaimers
          You understand and acknowledge that there is a high degree of risk involved in trading. Following any strategies or investment methods may lead to potential losses. The content on the site is provided by our contributors and analysts for information purposes only. You are solely responsible for determining whether any trading assets, securities, strategy, or any other product is suitable for investing based on your own investment objectives and financial situation.
          Add to Favorites
          Share
          FastBull
          Copyright © 2026 FastBull Ltd

          728 RM B 7/F GEE LOK IND BLDG NO 34 HUNG TO RD KWUN TONG KLN HONG KONG

          TelegramInstagramTwitterfacebooklinkedin
          App Store Google Play Android Windows
          Products
          Charts

          Chats

          Q&A with Experts
          Screeners
          Economic Calendar
          Data
          Tools
          Membership
          Features
          Function
          Markets
          Copy Trading
          Latest Signals
          Contests
          24/7
          Analysis
          Education
          Company
          Careers
          About Us
          Contact Us
          Advertising
          Download FastBull
          Help Center
          Feedback
          User Agreement
          Privacy Policy
          Personal Information Protection Statement
          Business

          White Label

          Broker API

          Data API

          Web Plug-ins

          Poster Maker

          Affiliate Program

          Risk Disclosure

          The risk of loss in trading financial instruments such as stocks, FX, commodities, futures, bonds, ETFs and crypto can be substantial. You may sustain a total loss of the funds that you deposit with your broker. Therefore, you should carefully consider whether such trading is suitable for you in light of your circumstances and financial resources.

          No decision to invest should be made without thoroughly conducting due diligence by yourself or consulting with your financial advisors. Our web content might not suit you since we don't know your financial conditions and investment needs. Our financial information might have latency or contain inaccuracy, so you should be fully responsible for any of your trading and investment decisions. The company will not be responsible for your capital loss.

          Without getting permission from the website, you are not allowed to copy the website's graphics, texts, or trademarks. Intellectual property rights in the content or data incorporated into this website belong to its providers and exchange merchants.

          Not Logged In

          Log in to access more features

          Connect Broker
          Become a signal provider
          Help Center
          Customer Service
          Dark Mode
          Price Up/Down Colors

          Log In

          Sign Up

          Position
          Layout
          Fullscreen
          Default to Chart
          The chart page opens by default when you visit fastbull.com