


- XAUUSD
- XAGUSD
- WTI
- USDX


Markets
Analysis
User
24/7
Economic Calendar
Education
Data
- Names
- Latest
- Prev


Following its Q2 FY26 earnings release on 10 December, Oracle raised its FY2026 capital expenditure plans by $15bn to $50bn.
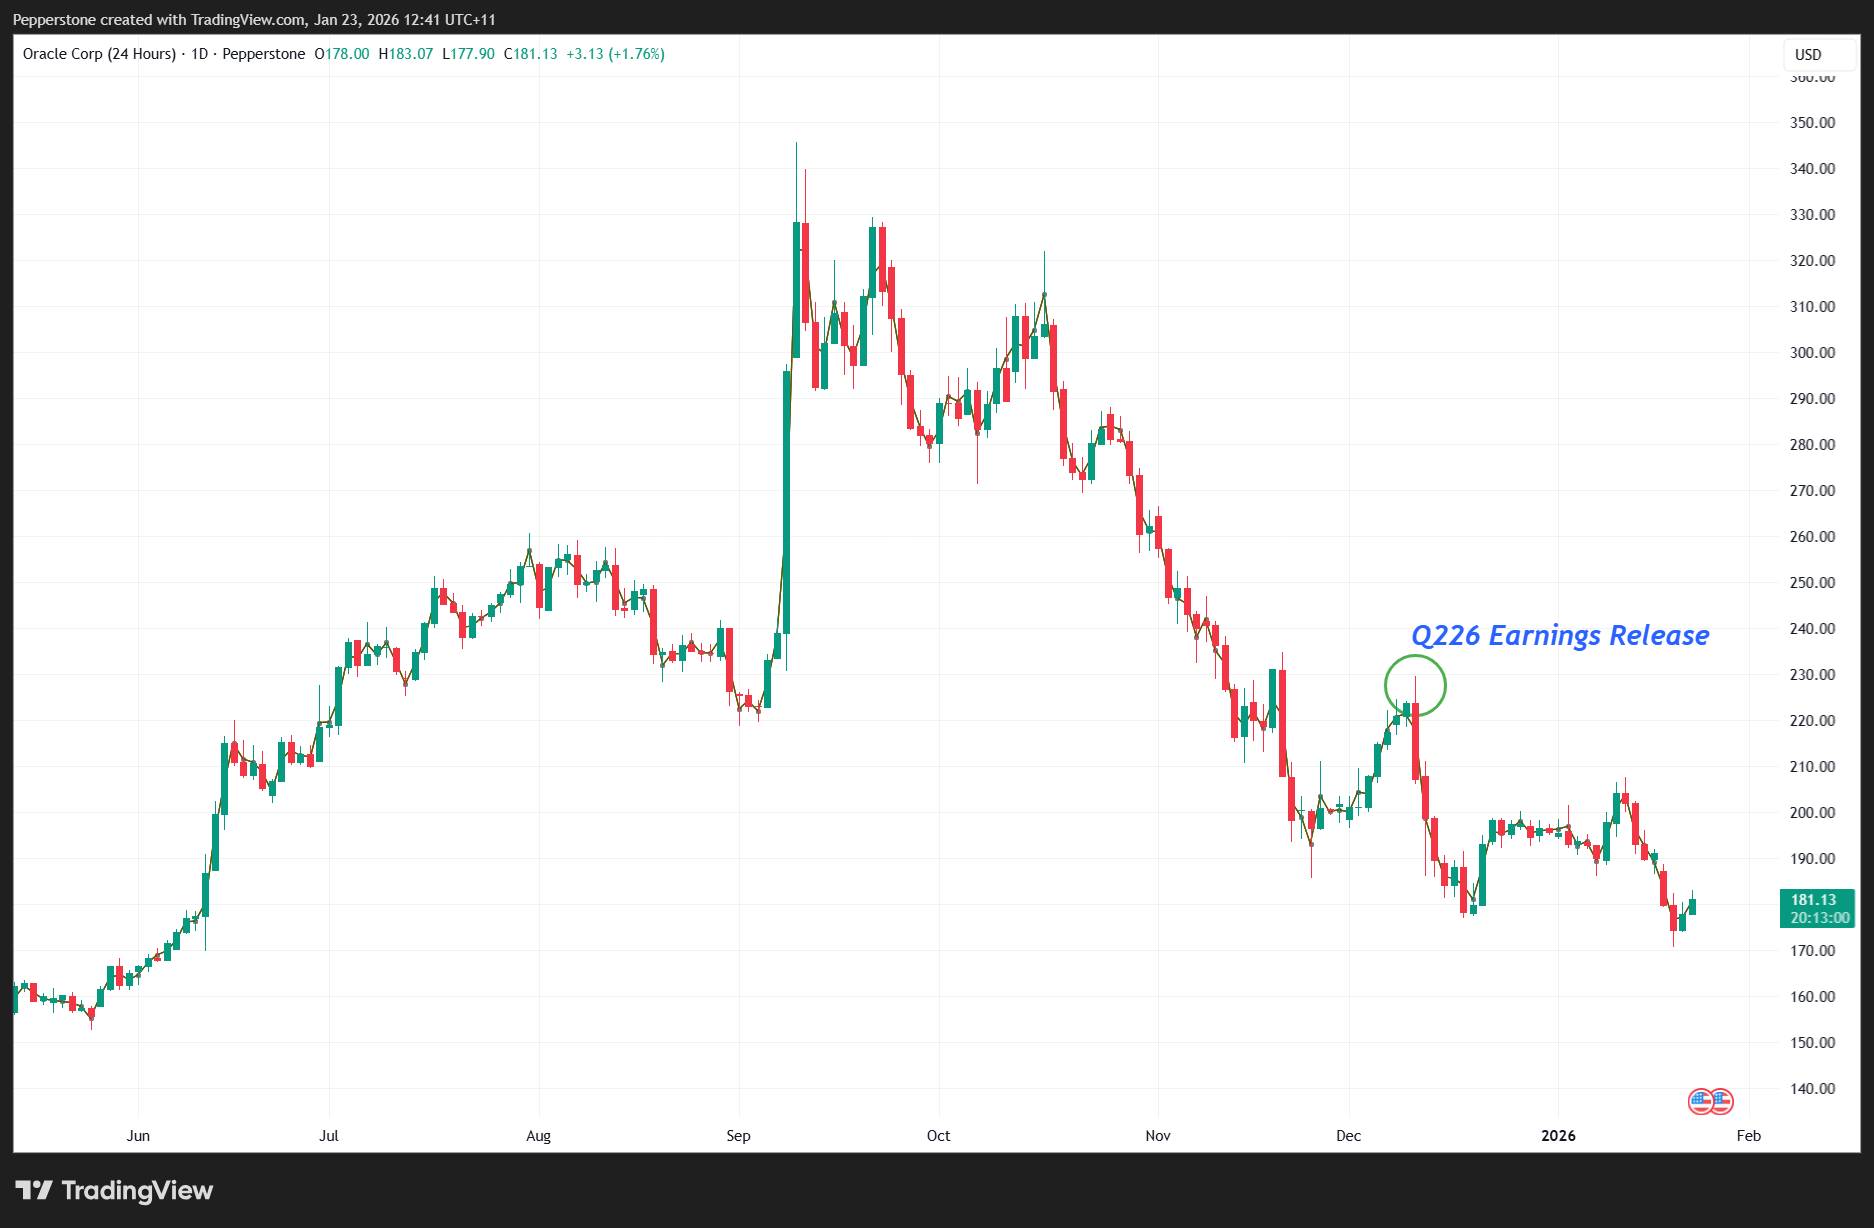
Following its Q2 FY26 earnings release on 10 December, Oracle raised its FY2026 capital expenditure plans by $15bn to $50bn. At the same time, free cash flow deteriorated sharply, blowing out to around -$10bn, alongside an increased net debt position.
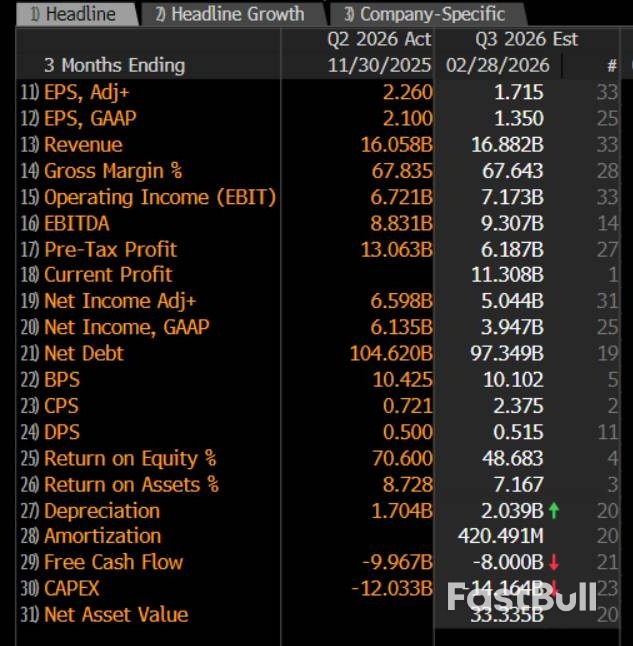
As a result, Oracle now carries a net leverage ratio, measured as net debt to EBITDA, close to a precarious 4x. This has placed considerable strain on the balance sheet and elevated investor concern around funding sustainability.
As a major strategic partner to OpenAI, Oracle sits at the heart of the global AI infrastructure expansion. Any sustained rise in market volatility or tightening in corporate bond and private credit markets would have meaningful implications for OpenAI's funding environment and, in turn, the returns Oracle can generate on its rapidly expanding base of invested capital.
Importantly, Oracle has increasingly become the poster child for perceived risk within the AI ecosystem.
Investor attention is firmly centred on the high execution risk associated with Oracle's aggressive data-centre expansion, the company's ability and cost to fund this growth through corporate debt markets, and the additional pressure this places on an already constrained balance sheet.
Concerns have been building around the risk of a future credit rating downgrade and the possibility that Oracle may ultimately need to raise additional capital through equity issuance. These risks sit uncomfortably alongside uncertainty over the returns that can be generated from such large-scale capital deployment.
It is therefore little surprise that options pricing implies a punchy +/-10.3% move in Oracle's share price on earnings day. This makes Oracle the stock with the highest expected earnings-day move across Pepperstone's US 24-hour CFD universe.
Oracle's management will be acutely aware of how sensitive the equity market is to any further increase in planned capex. Preserving the company's BBB credit rating will be a key priority if Oracle is to continue funding its expansion plans successfully in the debt markets.
Oracle's earnings are not just a risk or opportunity for traders in Oracle US 24-hour CFDs. The detail disclosed has the potential to resonate across the broader AI investable landscape, reinforcing the view that Oracle may be the most important US company to report earnings this quarter.
728 RM B 7/F GEE LOK IND BLDG NO 34 HUNG TO RD KWUN TONG KLN HONG KONG


The risk of loss in trading financial instruments such as stocks, FX, commodities, futures, bonds, ETFs and crypto can be substantial. You may sustain a total loss of the funds that you deposit with your broker. Therefore, you should carefully consider whether such trading is suitable for you in light of your circumstances and financial resources.
No decision to invest should be made without thoroughly conducting due diligence by yourself or consulting with your financial advisors. Our web content might not suit you since we don't know your financial conditions and investment needs. Our financial information might have latency or contain inaccuracy, so you should be fully responsible for any of your trading and investment decisions. The company will not be responsible for your capital loss.
Without getting permission from the website, you are not allowed to copy the website's graphics, texts, or trademarks. Intellectual property rights in the content or data incorporated into this website belong to its providers and exchange merchants.
Not Logged In
Log in to access more features


Log In
Sign Up


