• Trade
  • Markets
  • Copy
  • Contests
  • 24/7
  • Calendar
  • Q&A
  • Chats
Screeners
SYMBOL
LAST
BID
ASK
HIGH
LOW
NET CHG.
%CHG.
SPREAD
SOURCE
SPX
S&P 500 Index
7511.34
7511.34
7511.34
7564.96
7508.68
-42.94
-0.57%
--
--
DJI
Dow Jones Industrial Average
51999.66
51999.66
51999.66
52190.29
51864.99
+328.64
+ 0.64%
--
--
IXIC
NASDAQ Composite Index
26376.33
26376.33
26376.33
26788.62
26369.39
-307.60
-1.15%
--
--
USDX
US Dollar Index
99.280
99.280
99.360
99.310
99.210
-0.010
-0.01%
--
--
EURUSD
Euro / US Dollar
1.16079
1.16079
1.16086
1.16163
1.16036
0.00000
0.00%
--
--
GBPUSD
Pound Sterling / US Dollar
1.34150
1.34150
1.34158
1.34345
1.34080
-0.00112
-0.08%
--
--
XAUUSD
Gold / US Dollar
4327.91
4327.91
4328.25
4349.77
4317.41
-3.37
-0.08%
--
--
WTI
Light Sweet Crude Oil
74.736
74.736
74.766
75.986
74.009
-1.040
-1.37%
--
--

Community Accounts

Signal Accounts
--
Profit Accounts
--
Loss Accounts
--
View More

Become a signal provider

Sell trading signals to earn additional income

View More

Guide to Copy Trading

Get started with ease and confidence

View More

Signal Accounts for Members

All Signal Accounts

Best Return
  • Best Return
  • Best P/L
  • Best MDD
Past 1W
  • Past 1W
  • Past 1M
  • Past 1Y

All Contests

  • All
  • Recommend
  • Stocks
  • Cryptocurrencies
  • Central Banks
  • Trump Updates
  • Featured News
Top News Only
Share

Ministry Of Foreign Affairs: The U.S. Side Should Stop Politicizing, Instrumentalizing, And Weaponizing Economic, Trade, And Technological Issues

Share

The Yield On 10-year UK Government Bonds Fell To 4.754%, The Lowest Since April 17, Down Nearly 4 Basis Points On The Day

Share

The Yield On UK 5-year Government Bonds Fell To Its Lowest Level Since April 20 After Inflation Data Was Released, Dropping 5 Basis Points To 4.28%

Share

WTI Crude Oil Fell Below $75 Per Barrel For The First Time Since March 4, Down 2.22% On The Day

Share

ECB Governing Council Member Simkus: Controlling Inflation Expectations Is Very Important

Share

Ukraine's Minister Of Economy: Spring 2026 Grain Planting Has Been Completed, Covering An Area Of 5.9 Million Hectares

Share

All Cargo Space On China-U.S. Routes Is Fully Booked, With No Available Capacity

Share

UK Inflation Unexpectedly Held Steady In May

Share

Sichuan: Industrial Value-added Of Designated-size Enterprises Rose 6% Year-on-Year In The First Five Months Of 2026; Real Estate Investment Declined 7.8% Year-on-Year

Share

Institution: The Fed's FOMC Statement Is Expected To Indicate Two-sided Risks To Interest Rates

Share

Canadian Prime Minister Carney: On The Issue Of Ukraine, The US And Trump's Positions Are Shifting Toward A More Pragmatic View

Share

According To RIA Novosti: The Philippine President Has Arrived In Kazan To Attend The Russia-ASEAN Summit

Share

Russian Ministry Of Defense: Russian Air Defense Systems Intercepted And Destroyed 44 Ukrainian Drones Over Multiple Locations In Russia

Share

British Chancellor Of The Exchequer Reeves: Despite The Middle East Wars Driving Up Global Prices, Our Economic Plans Have Been Effective And Inflation Has Remained Stable

Share

Canadian Prime Minister Carney: A Trade Agreement With India Will Be Finalized Before The G20 Summit In November

Share

The Main Hog Futures Contract Fell By 2.00% During The Day, Currently Trading At 11,785.00 Yuan/ton

Share

Canadian Prime Minister Carney: In The Past 36 Hours, I Have Had Seven Or Eight Discussions With US President Trump On A Wide Range Of Issues

Share

The Yield On Japan's 40-year Government Bonds Fell 3.5 Basis Points To 3.640%

Share

Australian Prime Minister Albanese: We Are Working To Ensure Australia's Fuel Supply. Today I Met With Shell's Global Chairman To Discuss How To Help The Industry Buy More Fuel And Ensure More Fuel Flows Into Australia

Share

The G7 Noted That Some Member Countries Are Exploring New Legal Approaches With Third Countries To Strengthen Immigration Management

TIME
ACT
FCST
PREV
IMPACT
U.S. Building Permits MoM (SA) (May)

A:--

F: --

P: --

USDX
  • USDX
  • XAUUSD
  • XAGUSD
  • WTI
U.S. New Housing Starts Annualized MoM (SA) (May)

A:--

F: --

P: --
USDX
  • USDX
  • XAUUSD
  • XAGUSD
  • WTI
U.S. Export Price Index MoM (May)

A:--

F: --

P: --
USDX
  • USDX
  • XAUUSD
  • XAGUSD
  • WTI
U.S. Export Price Index YoY (May)

A:--

F: --

P: --

USDX
  • USDX
  • XAUUSD
  • XAGUSD
  • WTI
U.S. Weekly Redbook Index YoY

A:--

F: --

P: --

XAUUSD
  • XAUUSD
  • XAGUSD
  • WTI
  • USDX
ECB Chief Economist Lane Speaks
U.S. API Weekly Refined Oil Stocks

A:--

F: --

P: --

WTI
  • WTI
  • XAUUSD
  • XAGUSD
  • USDX
U.S. API Weekly Gasoline Stocks

A:--

F: --

P: --

WTI
  • WTI
  • XAUUSD
  • XAGUSD
  • USDX
U.S. API Weekly Cushing Crude Oil Stocks

A:--

F: --

P: --

WTI
  • WTI
  • XAUUSD
  • XAGUSD
  • USDX
U.S. API Weekly Crude Oil Stocks

A:--

F: --

P: --

WTI
  • WTI
  • XAUUSD
  • XAGUSD
  • USDX
Japan Reuters Tankan Manufacturers Index (Jun)

A:--

F: --

P: --

USDJPY
  • USDJPY
  • XAUUSD
  • XAGUSD
  • WTI
Japan Reuters Tankan Non-Manufacturers Index (Jun)

A:--

F: --

P: --

USDJPY
  • USDJPY
  • XAUUSD
  • XAGUSD
  • WTI
Japan Imports YoY (May)

A:--

F: --

P: --
USDJPY
  • USDJPY
  • XAUUSD
  • XAGUSD
  • WTI
  • USDX
Japan Exports YoY (May)

A:--

F: --

P: --

USDJPY
  • USDJPY
  • XAUUSD
  • XAGUSD
  • WTI
  • USDX
Japan Trade Balance (Not SA) (May)

A:--

F: --

P: --
USDJPY
  • USDJPY
  • XAUUSD
  • XAGUSD
  • WTI
  • USDX
Japan Goods Trade Balance (SA) (May)

A:--

F: --

P: --

USDJPY
  • USDJPY
  • XAUUSD
  • XAGUSD
  • WTI
  • USDX
Japan Core Machinery Orders YoY (Apr)

A:--

F: --

P: --

USDJPY
  • USDJPY
  • XAUUSD
  • XAGUSD
  • WTI
  • USDX
Japan Core Machinery Orders MoM (Apr)

A:--

F: --

P: --

USDJPY
  • USDJPY
  • XAUUSD
  • XAGUSD
  • WTI
  • USDX
Australia Westpac Leading Index MoM (May)

A:--

F: --

P: --
AUDUSD
  • AUDUSD
  • XAUUSD
  • XAGUSD
  • WTI
U.K. CPI MoM (May)

A:--

F: --

P: --

GBPUSD
  • GBPUSD
  • XAUUSD
  • XAGUSD
  • WTI
  • USDX
U.K. Core CPI YoY (May)

A:--

F: --

P: --

GBPUSD
  • GBPUSD
  • XAUUSD
  • XAGUSD
  • WTI
  • USDX
U.K. Output PPI MoM (Not SA) (May)

A:--

F: --

P: --
GBPUSD
  • GBPUSD
  • XAUUSD
  • XAGUSD
  • WTI
  • USDX
U.K. Retail Prices Index YoY (May)

A:--

F: --

P: --

GBPUSD
  • GBPUSD
  • XAUUSD
  • XAGUSD
  • WTI
  • USDX
U.K. Core Retail Prices Index YoY (May)

A:--

F: --

P: --

GBPUSD
  • GBPUSD
  • XAUUSD
  • XAGUSD
  • WTI
  • USDX
U.K. CPI YoY (May)

A:--

F: --

P: --

GBPUSD
  • GBPUSD
  • XAUUSD
  • XAGUSD
  • WTI
  • USDX
U.K. Retail Prices Index MoM (May)

A:--

F: --

P: --

GBPUSD
  • GBPUSD
  • XAUUSD
  • XAGUSD
  • WTI
  • USDX
U.K. Output PPI YoY (Not SA) (May)

A:--

F: --

P: --
GBPUSD
  • GBPUSD
  • XAUUSD
  • XAGUSD
  • WTI
  • USDX
U.K. Input PPI YoY (Not SA) (May)

A:--

F: --

P: --
GBPUSD
  • GBPUSD
  • XAUUSD
  • XAGUSD
  • WTI
  • USDX
U.K. Input PPI MoM (Not SA) (May)

A:--

F: --

P: --
GBPUSD
  • GBPUSD
  • XAUUSD
  • XAGUSD
  • WTI
  • USDX
U.K. Core CPI MoM (May)

A:--

F: --

P: --

GBPUSD
  • GBPUSD
  • XAUUSD
  • XAGUSD
  • WTI
  • USDX
South Africa Core CPI YoY (May)

--

F: --

P: --

South Africa CPI YoY (May)

--

F: --

P: --

IEA Oil Market Report
Euro Zone Core CPI Final MoM (May)

--

F: --

P: --

Euro Zone CPI YoY (Excl. Tobacco) (May)

--

F: --

P: --

South Africa Retail Sales YoY (Apr)

--

F: --

P: --

U.S. MBA Mortgage Application Activity Index WoW

--

F: --

P: --

U.S. Core Retail Sales (May)

--

F: --

P: --

U.S. Retail Sales (May)

--

F: --

P: --

U.S. Retail Sales YoY (May)

--

F: --

P: --

U.S. Retail Sales MoM (May)

--

F: --

P: --

U.S. Core Retail Sales MoM (May)

--

F: --

P: --

Canada New Housing Price Index MoM (May)

--

F: --

P: --

U.S. Commercial Inventory MoM (Apr)

--

F: --

P: --

U.S. Pending Home Sales Index YoY (May)

--

F: --

P: --

U.S. Pending Home Sales Index MoM (SA) (May)

--

F: --

P: --

U.S. Pending Home Sales Index (May)

--

F: --

P: --

U.S. EIA Weekly Crude Oil Imports Changes

--

F: --

P: --

U.S. EIA Weekly Crude Demand Projected by Production

--

F: --

P: --

U.S. EIA Weekly Cushing, Oklahoma Crude Oil Stocks Change

--

F: --

P: --

U.S. EIA Weekly Gasoline Stocks Change

--

F: --

P: --

U.S. EIA Weekly Crude Stocks Change

--

F: --

P: --

U.S. EIA Weekly Heating Oil Stock Changes

--

F: --

P: --

Russia PPI MoM (May)

--

F: --

P: --

Russia PPI YoY (May)

--

F: --

P: --

U.S. Target Federal Funds Rate Lower Limit (Overnight Reverse Repo Rate)

--

F: --

P: --

U.S. Target Federal Funds Rate Upper Limit (Excess Reserves Ratio)

--

F: --

P: --

FOMC Statement
FOMC Press Conference
Brazil Selic Interest Rate

--

F: --

P: --

U.K. 3-Month ILO Unemployment Rate (Apr)

--

F: --

P: --

Q&A with Experts
    • All
    • Chatrooms
    • Groups
    • Friends
    Size flag
    davidxhunt
    @Size yes you are right
    Is it on a prop firm account or your personal account?@davidxhunt@davidxhunt
    hackorr flag
    buy gold from 27-26
    EuroTrader flag
    EuroTrader flag
    EuroTrader
    @BNCBeurusd is back in the range. this is a typical sideways day in the markets
    Sanjeev Ku flag
    EuroTrader
    @Sanjeev Kuit's s new platform so they are running some huge discount at the moment you know
    @EuroTrader i am talking about the cost 229 for six months and 490 for one year .what is this arithmetic . why should people take yearly subscription when they can get six months subscription for 229. when it gets over people will take another six months subscription for 229. it will cost 458 only for whole year so why pay 490 for yearly subscription
    Size flag
    davidxhunt
    @Size yeah thank you bye i gotta go
    All good bro, Catch you later, have a good one...
    EuroTrader flag
    Mr. Grey
    @EuroTraderBro if you see CRT is part of ICT. Nothing else. But yes it is useful if you combine ICT and CRT and Orderflow, it's a deadly combo
    @Mr. GreyThat's true. CRT is just ICT 2022 mentorship actually. it's all ICT concepts. but if you combine with orderflow the. you have a massive edge
    EuroTrader flag
    Sanjeev Ku
    @EuroTrader i am talking about the cost 229 for six months and 490 for one year .what is this arithmetic . why should people take yearly subscription when they can get six months subscription for 229. when it gets over people will take another six months subscription for 229. it will cost 458 only for whole year so why pay 490 for yearly subscription
    @Sanjeev Kuthey call it both one year and lifetime subscription. am yet to understand why they did it like that 😞
    Sanjeev Ku flag
    EuroTrader
    @Sanjeev Kuthey call it both one year and lifetime subscription. am yet to understand why they did it like that 😞
    @EuroTraderok bro
    SlowBear ⛅ flag
    Sanjeev Ku
    @EuroTrader i am talking about the cost 229 for six months and 490 for one year .what is this arithmetic . why should people take yearly subscription when they can get six months subscription for 229. when it gets over people will take another six months subscription for 229. it will cost 458 only for whole year so why pay 490 for yearly subscription
    @Sanjeev KuSo you mean the annyal subscription should have be a little lower to what it is
    hackorr flag
    let see
    EuroTrader flag
    Sanjeev Ku
    @EuroTraderok bro
    @Sanjeev Kubut they got done really good tools and data feed really
    hackorr flag
    SlowBear ⛅ flag
    Sanjeev Ku
    @EuroTraderok bro
    @Sanjeev Ku Not sure. i even know what platform it is! i will park the bus here
    SlowBear ⛅ flag
    hackorr
    let see
    @hackorrWel now we. are watching a buy
    SlowBear ⛅ flag
    hackorr
    @hackorrith that level to SL i mean it is a fraction of. what you have made selling today
    hackorr flag
    SlowBear ⛅
    @hackorrith that level to SL i mean it is a fraction of. what you have made selling today
    @SlowBear ⛅its risky trade
    john flag
    hackorr
    buy gold from 27-26
    @hackorr
    SlowBear ⛅ flag
    hackorr
    @SlowBear ⛅its risky trade
    @hackorri see that, that is why i will not be joing you on this one
    hackorr flag
    sl HIT
    Type here...
    Add Symbol or Code

      No matching data

      All
      Recommend
      Stocks
      Cryptocurrencies
      Central Banks
      Trump Updates
      Featured News
      • All
      • Russia-Ukraine Conflict
      • Middle East Flashpoint
      • All
      • Russia-Ukraine Conflict
      • Middle East Flashpoint

      Search
      Products

      Charts Free Forever

      Chats Q&A with Experts
      Screeners Economic Calendar Data Tools
      Membership Features
      Data Warehouse Market Trends Institutional Data Policy Rates Macro

      Market Trends

      Market Sentiment Order Book Forex Correlations

      Top Indicators

      Charts Free Forever
      Markets

      News

      24/7 Analysis Education

      Latest Views

      Latest Update

      Signals

      Copy Rankings Latest Signals Become a signal provider AI Rating
      Contests
      Brokers

      Overview Brokers Assessment Rankings Regulators News Claims
      Broker listing Forex Brokers Comparison Tool Live Spread Comparison Scam
      Q&A Complaint Scam Alert Videos Tips to Detect Scam
      More

      Business
      Events
      Careers About Us Advertising Help Center

      White Label

      Broker API

      Data API

      Web Plug-ins

      Affiliate Program

      Awards Institution Evaluation IB Seminar Salon Event Exhibition
      Vietnam Thailand Singapore Dubai
      Fans Party Investment Sharing Session
      FastBull Summit BrokersView Expo
      Recent Searches
        Top Searches
          Markets
          Analysis
          User
          24/7
          Economic Calendar
          Education
          Data
          • Names
          • Latest
          • Prev

          View All

          No data

          Scan to Download

          Faster Charts, Chat Faster!

          Download
          English
          • English
          • Español
          • العربية
          • Bahasa Indonesia
          • Bahasa Melayu
          • Tiếng Việt
          • ภาษาไทย
          • Français
          • Italiano
          • Türkçe
          • Русский язык
          • 简中
          • 繁中
          Open Account
          Search
          Products
          Charts Free Forever
          Markets
          News
          Signals

          Copy Rankings Latest Signals Become a signal provider AI Rating
          Contests
          Brokers

          Overview Brokers Assessment Rankings Regulators News Claims
          Broker listing Forex Brokers Comparison Tool Live Spread Comparison Scam
          Q&A Complaint Scam Alert Videos Tips to Detect Scam
          More

          Business
          Events
          Careers About Us Advertising Help Center

          White Label

          Broker API

          Data API

          Web Plug-ins

          Affiliate Program

          Awards Institution Evaluation IB Seminar Salon Event Exhibition
          Vietnam Thailand Singapore Dubai
          Fans Party Investment Sharing Session
          FastBull Summit BrokersView Expo

          Metals Flashing Red After Record Runs – Silver (XAG/USD), Gold (XAU/USD) And Copper (XCU/USD) Outlook

          MarketPulse by OANDA Group

          Forex

          Commodity

          Summary:

          For metal maximalists, this confirms a long-held thesis. Decades of high deficits create predictable capital flows and supply shortages, which are now driving prices to daily records.

          · Silver, Gold were reaching new highs every day but saw a sudden top in today's action
          · Post-FOMC rally gets tested, we observe if the trend can continue
          · High timeframe analysis for XAG/USD, XAU/USD and XCU/USD (Copper)

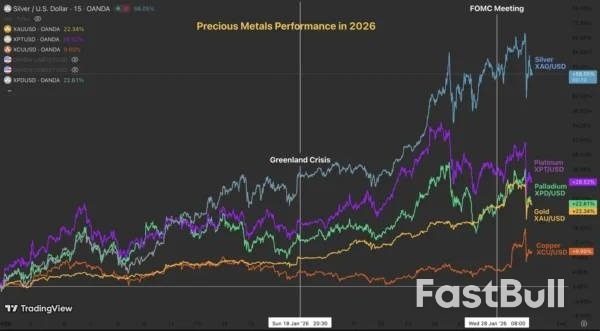
          If 2025 was volatile for metals, 2026 is starting with even greater intensity.

          The global order is fracturing as historic allies clash and new conflicts appear imminent.

          For metal maximalists, this confirms a long-held thesis. Decades of high deficits create predictable capital flows and supply shortages, which are now driving prices to daily records.

          As geopolitical tensions rise, investors are rushing to commodities to hedge against supply shortages and inflation, a classic play.

          Metals performance in 2026 – Source: TradingView

          But today's flows feel different.

          It is almost impossible to predict tops in such extreme, unidirectional trends. Some periods can be more favorable for squeezes. Some others are more favorable for rangebound conditions and selloffs.

          And such periods tend to change at the beginning of the New Year, at the start of Quarters, Months, or even after FOMC meetings.

          As the US President announced he will officially announce his decision on the Fed Chair next week, Markets are looking back at yesterday's Federal Reserve decision.

          Higher rates for longer will be the way to go for the Fed until anything cracks, as the US Labor Market bounced back and the US economy is shining – Can't justify many cuts with that.

          Today marked a brutal stalling in rallies throughout the Metals asset class.

          Gold was trading 6% higher than the day before the FOMC, only to give up those gains in a 10% flash crash.

          Similar flows occurred in Copper, Silver, Palladium, and Platinum, all dropping by 9% to 11%.

          By the way, Copper spiked to new record highs in yesterday's evening session, reaching $6.52 per lb, but still lacking a more fundamental foundation to persistently elevated prices.

          In the meantime, let's dive right into intraday timeframe analysis for Gold (XAU/USD), Silver (XAG/USD) and Copper (XCU/USD) to spot where the session dynamic takes the price action. Is the trend challenged?

          Gold (XAU/USD) 2H Chart and levels

          Gold (XAU/USD) 2H Chart, January 29, 2026 – Source: TradingView

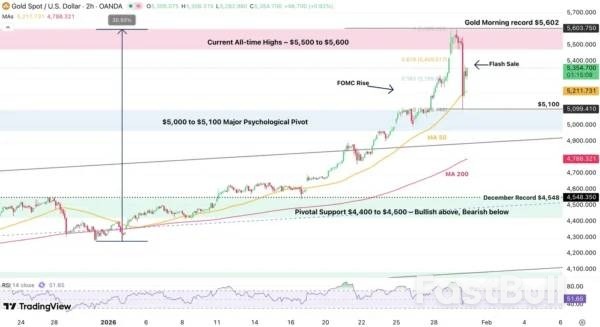
          This morning's action could pose a significant test to the 30% yearly run in the Bullion.

          The current fundamentals are heavily backing the recent rise, particularly as it is far less extreme than the one seen in Silver for example.

          Still, when profit-taking occurs so suddenly, traders can look around, question the current state of the Market and reassess if the trend can still hold.

          Since the flash, prices have rebounded – Hence look at these two levels:

          · Any retest of the all-time high ($5,600) should be followed with further upside. Particularly after a 4H candle close. Next areas of interest could be between $5,800 and $5,900.
          · Any break and close below $5,100 can put the entire 2026 gains in challenge.
          · The 4H 50-period MA can act as a very interesting indicator for short-term momentum

          Higher Timeframe Levels to watch for Gold (XAU/USD):

          Resistance Levels:

          · Current All-time Highs – $5,500 to $5,600
          · Key Fibonacci Projection $5,800 to $5,900
          · $5,400 mini-resistance

          Support Levels:

          · $5,000 to $5,100 Major Psychological Pivot (Morning lows $5,100)
          · $4,788 4H MA 200
          · Pivotal Support $4,400 to $4,500 – Bullish above, Bearish below
          · Minor Support $3,880 to $4,050
          · $3,200 to $3,500 Major Support
          · $2,600 to $2,800 November 2024 Support
          · $1,800 to $2,000 2022 to 2024 Range Support

          Silver (XAG/USD) 2H Chart and levels

          Silver (XAG/USD) Weekly Chart, January 29, 2026 – Source: TradingView

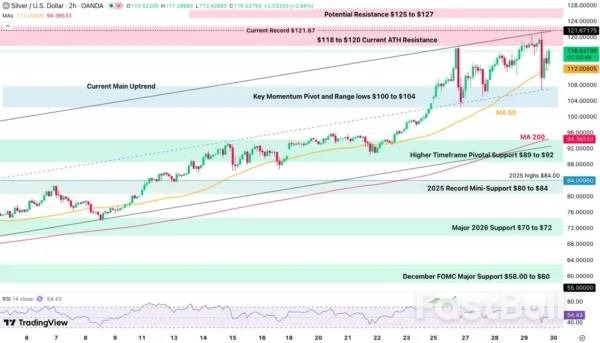
          Evolving in a steep upward channel, Silver is testing its upper bound in high volatility consolidation.

          Prices have maintained within a $107 to $120 range since Monday, hence trades will look for breakouts either to the upside or downside for future action.

          Similarly as in Gold, look for a candle close above or below with high volumes to get confirmation.

          A break lower could go test the Upward channel lower bounds, currently around $92.

          Higher Timeframe Levels to watch for Silver (XAG/USD):

          Resistance Levels:

          · $118 to $120 Current ATH Resistance
          · Current Record $121.67
          · Potential Resistance $125 to $127

          Support Levels:

          · Key Momentum Pivot and Range lows $100 to $104
          · Higher Timeframe Pivotal Support $89 to $92
          · 2025 HighsMini-Support $80 to $84
          · Major 2026 Support $70 to $72
          · December FOMC Major Support $58.00 to $60

          Copper (XCU/USD) 2H Chart and levels

          Copper (XCU/USD) 2H Chart, January 29, 2026 – Source: TradingView

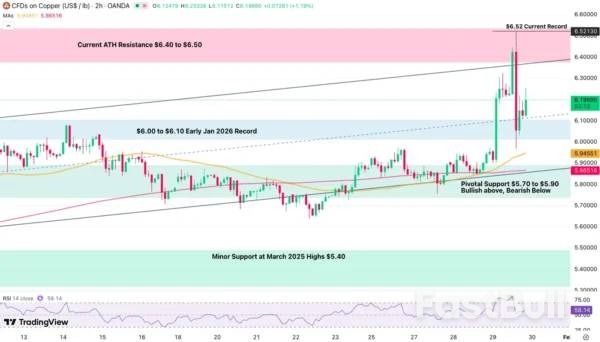
          The recent moves are not particularly indicative of a trend-end but recent up and down action may precede doubts to the sustainability of the recent moves.

          Copper spiked by 10% during overnight trading, corrects by a similar amount and is now holding tight at its January 14 record range ($6.00 to $6.10 Major Pivot).

          · Holding above the Pivot keeps the trend intact and could lead to further highs with the next step between $6.90 to $7.00.
          · Closing below the pivot would hint at a test of the $5.70 to $5.90 pivotal support.
          Any close below the Pivotal support would compromise the uptrend.

          Current ATH Resistance $6.40 to $6.50

          Higher Timeframe Levels to watch for Copper (XCU/USD):

          Resistance Levels:

          · Current ATH Resistance $6.40 to $6.50
          · $6.52 Current Record
          · Potential Resistance $6.90 to $7.00

          Support Levels:

          · $6.00 to $6.10 Early Jan 2026 Record
          · Pivotal Support $5.70 to $5.90 – Bullish above, Bearish Below
          · Minor Support at March 2025 Highs $5.40
          · Major Monthly Support between $4.90 to $5.00 (50-Week MA)

          Watch out for positioning and fast-paced moves!

          January is already coming to an end and it has historically been the best month for Gold, Silver and Platinum. Keep a close eye to see if the rally holds the colder February ahead.

          Safe Trades!

          Source: MarketPulse by OANDA Group

          Risk Warnings and Disclaimers
          You understand and acknowledge that there is a high degree of risk involved in trading. Following any strategies or investment methods may lead to potential losses. The content on the site is provided by our contributors and analysts for information purposes only. You are solely responsible for determining whether any trading assets, securities, strategy, or any other product is suitable for investing based on your own investment objectives and financial situation.
          Add to Favorites
          Share
          FastBull
          Copyright © 2026 FastBull Ltd

          728 RM B 7/F GEE LOK IND BLDG NO 34 HUNG TO RD KWUN TONG KLN HONG KONG

          TelegramInstagramTwitterfacebooklinkedin
          App Store Google Play Android Windows
          Products
          Charts

          Chats

          Q&A with Experts
          Screeners
          Economic Calendar
          Data
          Tools
          Membership
          Features
          Function
          Markets
          Copy Trading
          Latest Signals
          Contests
          24/7
          Analysis
          Education
          Company
          Careers
          About Us
          Contact Us
          Advertising
          Download FastBull
          Help Center
          Feedback
          User Agreement
          Privacy Policy
          Personal Information Protection Statement
          Business

          White Label

          Broker API

          Data API

          Web Plug-ins

          Poster Maker

          Affiliate Program

          Risk Disclosure

          The risk of loss in trading financial instruments such as stocks, FX, commodities, futures, bonds, ETFs and crypto can be substantial. You may sustain a total loss of the funds that you deposit with your broker. Therefore, you should carefully consider whether such trading is suitable for you in light of your circumstances and financial resources.

          No decision to invest should be made without thoroughly conducting due diligence by yourself or consulting with your financial advisors. Our web content might not suit you since we don't know your financial conditions and investment needs. Our financial information might have latency or contain inaccuracy, so you should be fully responsible for any of your trading and investment decisions. The company will not be responsible for your capital loss.

          Without getting permission from the website, you are not allowed to copy the website's graphics, texts, or trademarks. Intellectual property rights in the content or data incorporated into this website belong to its providers and exchange merchants.

          Not Logged In

          Log in to access more features

          Connect Broker
          Become a signal provider
          Help Center
          Customer Service
          Dark Mode
          Price Up/Down Colors

          Log In

          Sign Up

          Position
          Layout
          Fullscreen
          Default to Chart
          The chart page opens by default when you visit fastbull.com