- XAUUSD
- XAGUSD
- WTI
- USDX
Markets
Analysis
User
24/7
Economic Calendar
Education
Data
- Names
- Latest
- Prev


Signal Accounts for Members
All Signal Accounts
All Contests


National Bureau Of Statistics: Production And Demand In Certain Equipment-manufacturing Industries Have Grown Rapidly
National Bureau Of Statistics: The Non-manufacturing Business Activity Index Has Declined, While The Cultural And Tourism Sectors Remain Relatively Robust
National Bureau Of Statistics: The Equipment Manufacturing And High-tech Manufacturing Sectors Continue To Play A Pivotal Supporting And Leading Role
China's July Non-manufacturing PMI Came In At 49, Below The Expected 50 And Down From The Previous Reading Of 50.2
Australia's Second-quarter PPI Rose 1.3% Quarter-on-quarter, Compared With The Previous Reading Of 0.40%
Australia's Producer Price Index (PPI) Annual Rate For Q2 Stood At 3.6%, Up From The Previous Reading Of 3.00%
China's Manufacturing Purchasing Managers' Index (PMI) Was 49.2% In July, Indicating That The Manufacturing Sector Is Relatively Resilient
The Most Active Egg Futures Contract Fell 2.00% During The Day, Currently Trading At 3962.00 Yuan/500 Kg
China's Central Bank (PBOC) Announced Today That It Conducted 134 Billion Yuan Of 7-day Reverse Repurchase Operations, With Both Bids And Winning Bids Amounting To 134 Billion Yuan, At An Interest Rate Of 1.40%. Simultaneously, It Conducted 600 Billion Yuan Of Overnight Reverse Repurchase Operations
The Main Polysilicon Futures Contract Rose 2.00% Intraday, Currently Trading At 33,170 Yuan/ton
WTI Crude Oil Fell 2% On The Day, Dropping Below $81 Per Barrel. Brent Crude Oil Fell 1.6% To $85.4 Per Barrel
The Main Methanol Futures Contract Fell 2.00% During The Day, Currently Trading At 2603.00 Yuan/ton

U.S. Personal Outlays MoM (SA) (Jun)A:--
F: --
U.S. PCE Price Index Prelim QoQ (SA) (Q2)A:--
F: --
P: --
U.S. Core PCE Price Index MoM (Jun)A:--
F: --
P: --
U.S. Real Personal Consumption Expenditures Prelim QoQ (Q2)A:--
F: --
P: --
U.S. GDP Deflator Prelim QoQ (SA) (Q2)A:--
F: --
P: --
U.S. PCE Price Index YoY (SA) (Jun)A:--
F: --
P: --
U.S. Personal Income MoM (Jun)A:--
F: --
P: --
U.S. PCE Price Index MoM (Jun)A:--
F: --
U.S. Real Personal Consumption Expenditures MoM (Jun)A:--
F: --
U.S. Initial Jobless Claims 4-Week Avg. (SA)A:--
F: --
U.S. Core PCE Price Index Annualized QoQ Prelim (SA) (Q2)A:--
F: --
P: --
U.S. Weekly Continued Jobless Claims (SA)A:--
F: --
U.S. Core PCE Price Index YoY (Jun)A:--
F: --
P: --
U.S. Weekly Initial Jobless Claims (SA)A:--
F: --
U.S. Real GDP Annualized QoQ Prelim (SA) (Q2)A:--
F: --
P: --
U.S. Dallas Fed PCE Price Index YoY (Jun)A:--
F: --
P: --
U.S. EIA Weekly Natural Gas Stocks ChangeA:--
F: --
P: --
South Korea Industrial Output MoM (SA) (Jun)A:--
F: --
P: --
Japan Unemployment Rate (Jun)A:--
F: --
P: --
Japan Jobs to Applicants Ratio (Jun)A:--
F: --
P: --
Japan Tokyo CPI YoY (Jul)A:--
F: --
P: --
Japan Tokyo Core CPI YoY (Jul)A:--
F: --
P: --
Japan Retail Sales YoY (Jun)A:--
F: --
P: --
Japan Industrial Output Prelim YoY (Jun)--
F: --
P: --
Japan Retail Sales MoM (SA) (Jun)A:--
F: --
P: --
Australia PPI YoY (Q2)A:--
F: --
P: --
Australia PPI QoQ (Q2)A:--
F: --
P: --
China, Mainland NBS Non-manufacturing PMI (Jul)A:--
F: --
P: --
China, Mainland Composite PMI (Jul)A:--
F: --
P: --
China, Mainland NBS Manufacturing PMI (Jul)A:--
F: --
P: --
BOJ Monetary Policy Statement
Japan New Housing Starts YoY (Jun)--
F: --
P: --
BOJ Press Conference
France PPI MoM (Jun)--
F: --
P: --
Germany Unemployment Rate (SA) (Jul)--
F: --
P: --
U.S. Labor Cost Index QoQ (Q2)--
F: --
P: --
Canada GDP YoY (May)--
F: --
P: --
Canada GDP MoM (SA) (May)--
F: --
P: --
U.S. Chicago PMI (Jul)--
F: --
P: --
U.S. Weekly Total Rig Count--
F: --
P: --
U.S. Weekly Total Oil Rig Count--
F: --
P: --
South Korea Trade Balance Prelim (Jul)--
F: --
P: --


No matching data
All growth rates for the financial aggregates are seasonally adjusted, and adjusted for theeffects of breaks in the series. Data for the levels of financial aggregates are notadjusted for series breaks, and growth rates should not be calculated from data on thelevels of credit.
The table below presents a summary of the latest financial aggregates statistics.
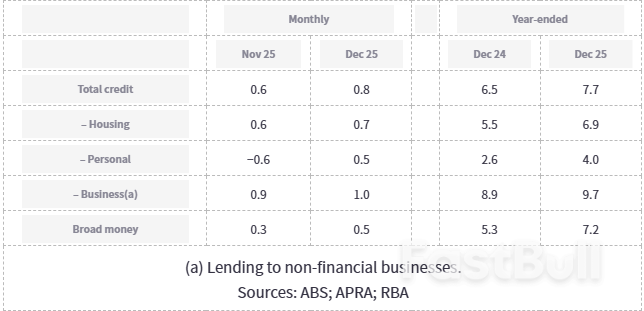
All growth rates for the financial aggregates are seasonally adjusted, and adjusted for theeffects of breaks in the series. Data for the levels of financial aggregates are notadjusted for series breaks, and growth rates should not be calculated from data on thelevels of credit.
Historical levels and growth rates for the financial aggregates have been revised owing tothe resubmission of data by some financial intermediaries, the re-estimation of seasonalfactors and the incorporation of securitisation data. The RBA credit aggregates measurecredit provided by financial institutions operating domestically. They do not capturecross-border or non-intermediated lending.
Since the July 2019 release, the financial aggregates have incorporated an improvedconceptual framework and a new data collection. This is referred to as the Economic andFinancial Statistics (EFS) collection. For more information, seeUpdates to Australia's FinancialAggregates and the July 2019 Financial Aggregates.
Since the March 2023 release, series that exclude lending to warehouse trusts in business credit were added tothe financial aggregates. More information is available in theChange Notice published 21 April 2023.
The risk of loss in trading financial instruments such as stocks, FX, commodities, futures, bonds, ETFs and crypto can be substantial. You may sustain a total loss of the funds that you deposit with your broker. Therefore, you should carefully consider whether such trading is suitable for you in light of your circumstances and financial resources.
No decision to invest should be made without thoroughly conducting due diligence by yourself or consulting with your financial advisors. Our web content might not suit you since we don't know your financial conditions and investment needs. Our financial information might have latency or contain inaccuracy, so you should be fully responsible for any of your trading and investment decisions. The company will not be responsible for your capital loss.
Without getting permission from the website, you are not allowed to copy the website's graphics, texts, or trademarks. Intellectual property rights in the content or data incorporated into this website belong to its providers and exchange merchants.
Not Logged In
Log in to access more features
Log In
Sign Up