


Markets
Analysis
User
24/7
Economic Calendar
Education
Data
- Names
- Latest
- Prev


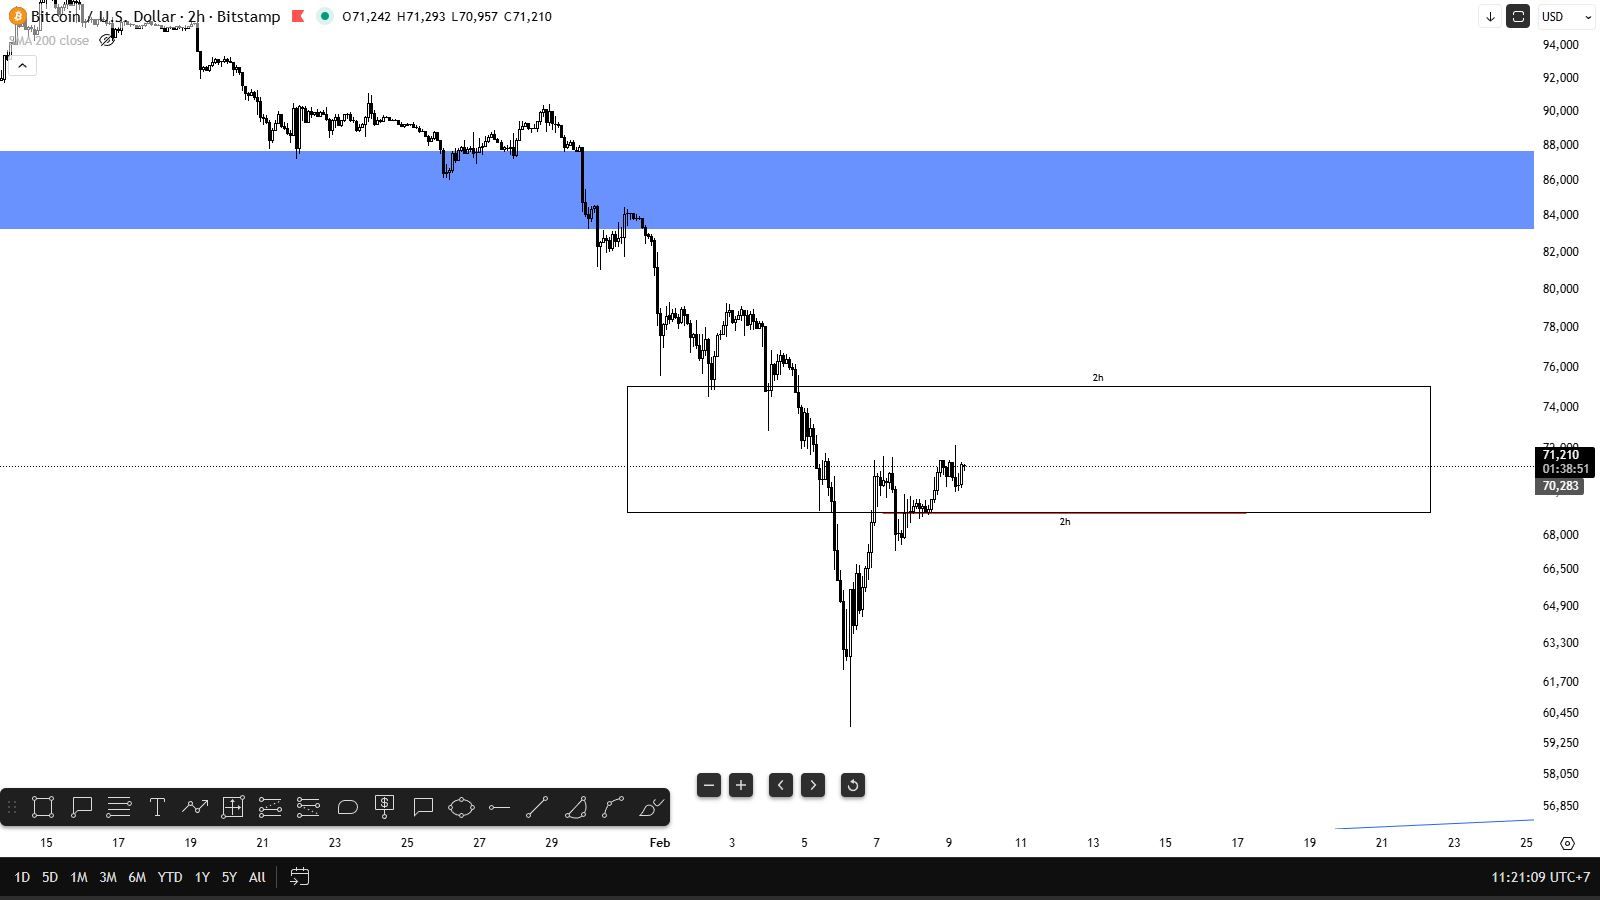


The BTC/USD chart shows Bitcoin dipping below $89K today—the first time since November 2024, when the leading cryptocurrency sur
The BTC/USD chart shows Bitcoin dipping below $89K today—the first time since November 2024, when the leading cryptocurrency surged on news of Donald Trump’s presidential victory.
We previously posted:
→ 28 January: Bitcoin Holds Above $100K—For Now
→ 11 February: How Trump Affects Bitcoin’s Price
In those analyses, we highlighted the extreme trading volumes during Trump’s inauguration and the heightened crypto market volatility. These conditions may have allowed major players to take profits after the 2024 rally. The subsequent price action has confirmed this bearish outlook.

Since the surge in market activity during Trump’s inauguration (marked by a red arrow), Bitcoin has:
→ Formed a descending channel
→ Failed to break the psychological $100K level (black line)
→ Dropped below key support around $91K
A rebound attempt from the lower boundary of the long-term blue channel (blue arrow) was unsuccessful. In this environment, negative news could have aided bears in pushing Bitcoin towards the lower boundary of the channel.Bitcoin’s Price Crash on 25 February
Bitcoin’s decline may have been driven by:
→ Market concerns over the ByBit hack, where around $1.5 billion in ETH was stolen
→ South Korean government sanctions on crypto exchange Upbit
→ A drop in US tech stocks ahead of Nvidia’s earnings report and PCE Price Index data, signaling investor caution toward risk assets
This bearish momentum has resulted in an almost 8% drop in under 24 hours, with over $1 billion in long positions liquidated across crypto exchanges. The RSI indicator is now near multi-month lows.
BitMEX co-founder Arthur Hayes predicted on X that Bitcoin could fall to $70K if major hedge funds exit US Bitcoin ETFs.
This suggests further downside within the red descending channel. However, Bitcoin is near the lower boundary of this channel, meaning it could act as short-term support.
728 RM B 7/F GEE LOK IND BLDG NO 34 HUNG TO RD KWUN TONG KLN HONG KONG


The risk of loss in trading financial instruments such as stocks, FX, commodities, futures, bonds, ETFs and crypto can be substantial. You may sustain a total loss of the funds that you deposit with your broker. Therefore, you should carefully consider whether such trading is suitable for you in light of your circumstances and financial resources.
No decision to invest should be made without thoroughly conducting due diligence by yourself or consulting with your financial advisors. Our web content might not suit you since we don't know your financial conditions and investment needs. Our financial information might have latency or contain inaccuracy, so you should be fully responsible for any of your trading and investment decisions. The company will not be responsible for your capital loss.
Without getting permission from the website, you are not allowed to copy the website's graphics, texts, or trademarks. Intellectual property rights in the content or data incorporated into this website belong to its providers and exchange merchants.
Not Logged In
Log in to access more features


Log In
Sign Up


