

Markets
News
Analysis
User
24/7
Economic Calendar
Education
Data
- Names
- Latest
- Prev


Signal Accounts for Members
All Signal Accounts
All Contests
 U.K. Trade Balance Non-EU (SA) (Oct)
A:--
F: --
P: --
U.K. Trade Balance (Oct)A:--
F: --
P: --
U.K. Services Index MoMA:--
F: --
P: --
U.K. Construction Output MoM (SA) (Oct)A:--
F: --
P: --
U.K. Industrial Output YoY (Oct)A:--
F: --
P: --
U.K. Trade Balance (SA) (Oct)A:--
F: --
P: --
U.K. Trade Balance EU (SA) (Oct)A:--
F: --
P: --
U.K. Manufacturing Output YoY (Oct)A:--
F: --
P: --
U.K. GDP MoM (Oct)A:--
F: --
P: --
U.K. GDP YoY (SA) (Oct)A:--
F: --
P: --
U.K. Industrial Output MoM (Oct)A:--
F: --
P: --
U.K. Construction Output YoY (Oct)A:--
F: --
P: --
 France HICP Final MoM (Nov)
A:--
F: --
P: --
 China, Mainland Outstanding Loans Growth YoY (Nov)
A:--
F: --
P: --
China, Mainland M2 Money Supply YoY (Nov)A:--
F: --
P: --
China, Mainland M0 Money Supply YoY (Nov)A:--
F: --
P: --
China, Mainland M1 Money Supply YoY (Nov)A:--
F: --
P: --
 India CPI YoY (Nov)
A:--
F: --
P: --
India Deposit Gowth YoYA:--
F: --
P: --
 Brazil Services Growth YoY (Oct)
A:--
F: --
P: --
 Mexico Industrial Output YoY (Oct)
A:--
F: --
P: --
 Russia Trade Balance (Oct)
A:--
F: --
P: --
 Philadelphia Fed President Henry Paulson delivers a speech
 Canada Building Permits MoM (SA) (Oct)
A:--
F: --
P: --
Canada Wholesale Sales YoY (Oct)A:--
F: --
P: --
Canada Wholesale Inventory MoM (Oct)A:--
F: --
P: --
Canada Wholesale Inventory YoY (Oct)A:--
F: --
P: --
Canada Wholesale Sales MoM (SA) (Oct)A:--
F: --
P: --
 Germany Current Account (Not SA) (Oct)
A:--
F: --
P: --
U.S. Weekly Total Rig CountA:--
F: --
P: --
U.S. Weekly Total Oil Rig CountA:--
F: --
P: --
 Japan Tankan Large Non-Manufacturing Diffusion Index (Q4)
--
F: --
P: --
Japan Tankan Small Manufacturing Outlook Index (Q4)--
F: --
P: --
Japan Tankan Large Non-Manufacturing Outlook Index (Q4)--
F: --
P: --
Japan Tankan Large Manufacturing Outlook Index (Q4)--
F: --
P: --
Japan Tankan Small Manufacturing Diffusion Index (Q4)--
F: --
P: --
Japan Tankan Large Manufacturing Diffusion Index (Q4)--
F: --
P: --
Japan Tankan Large-Enterprise Capital Expenditure YoY (Q4)--
F: --
P: --
U.K. Rightmove House Price Index YoY (Dec)--
F: --
P: --
China, Mainland Industrial Output YoY (YTD) (Nov)--
F: --
P: --
China, Mainland Urban Area Unemployment Rate (Nov)--
F: --
P: --
 Saudi Arabia CPI YoY (Nov)
--
F: --
P: --
 Euro Zone Industrial Output YoY (Oct)
--
F: --
P: --
Euro Zone Industrial Output MoM (Oct)--
F: --
P: --
Canada Existing Home Sales MoM (Nov)--
F: --
P: --
Euro Zone Total Reserve Assets (Nov)--
F: --
P: --
U.K. Inflation Rate Expectations--
F: --
P: --
Canada National Economic Confidence Index--
F: --
P: --
Canada New Housing Starts (Nov)--
F: --
P: --
U.S. NY Fed Manufacturing Employment Index (Dec)--
F: --
P: --
U.S. NY Fed Manufacturing Index (Dec)--
F: --
P: --
Canada Core CPI YoY (Nov)--
F: --
P: --
Canada Manufacturing Unfilled Orders MoM (Oct)--
F: --
P: --
Canada Manufacturing New Orders MoM (Oct)--
F: --
P: --
Canada Core CPI MoM (Nov)--
F: --
P: --
Canada Manufacturing Inventory MoM (Oct)--
F: --
P: --
Canada CPI YoY (Nov)--
F: --
P: --
Canada CPI MoM (Nov)--
F: --
P: --
Canada CPI YoY (SA) (Nov)--
F: --
P: --
Canada Core CPI MoM (SA) (Nov)--
F: --
P: --

No matching data
Latest Views
Latest Views
Trending Topics
Top Columnists
Latest Update
White Label
Data API
Web Plug-ins
Affiliate Program
View All
No data
XRP price started a fresh increase above the $2.50 zone. The price is now showing positive signs and might climb above the $2.62 resistance.
XRP Price Rallies Over 5%
XRP price started a fresh increase after it settled above the $2.40 level, like Bitcoin and Ethereum. The price was able to climb above the $2.450 resistance level.
The recent move was positive and the bulls pushed the price above the $2.50 level. A high was formed at $2.5870 and the price is now consolidating gains above the 23.6% Fib retracement level of the upward move from the $2.250 swing low to the $2.5870 high.
The price is now trading above $2.50 and the 100-hourly Simple Moving Average. Besides, there is a key bullish trend line forming with support at $2.50 on the hourly chart of the XRP/USD pair.
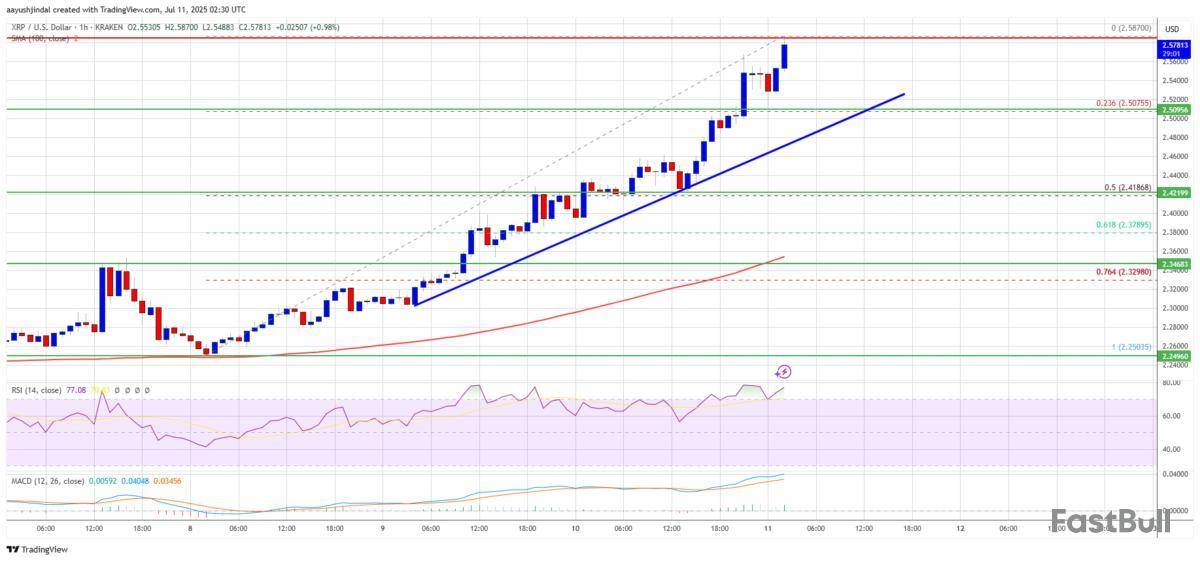
On the upside, the price might face resistance near the $2.5880 level. The first major resistance is near the $2.60 level. A clear move above the $2.60 resistance might send the price toward the $2.620 resistance. Any more gains might send the price toward the $2.650 resistance or even $2.6850 in the near term. The next major hurdle for the bulls might be near the $2.750 zone.
Another Decline?
If XRP fails to clear the $2.620 resistance zone, it could start another decline. Initial support on the downside is near the $2.50 level and the trend line zone. The next major support is near the $2.450 level.
If there is a downside break and a close below the $2.450 level, the price might continue to decline toward the $2.420 support or the 50% Fib retracement level of the upward move from the $2.250 swing low to the $2.5870 high. The next major support sits near the $2.40 zone.
Technical Indicators
Hourly MACD – The MACD for XRP/USD is now gaining pace in the bullish zone.
Hourly RSI (Relative Strength Index) – The RSI for XRP/USD is now above the 50 level.
Major Support Levels – $2.50 and $2.450.
Major Resistance Levels – $2.60 and $2.620.
In a rare but potentially telling market shift, Ethereum futures volume overtook Bitcoin’s over a 24-hour period, recording $62.1 billion compared to BTC’s $61.7 billion on July 10.
This reversal, highlighted by market analytics platform Glassnode, may suggest a subtle but meaningful rotation in trader sentiment. While the OG cryptocurrency remains the market leader in price and dominance, Ethereum’s uptick could point to growing confidence in its ecosystem.Catalysts Driving the Ethereum Surge
Several converging factors could explain this sudden dominance, including growing institutional confidence in the second-largest crypto by market cap, as evidenced by Bit Digital’s recent move to convert its entire $173 million BTC treasury into Ethereum.
We also recently saw deep-pocketed investorsscoop up200,000 ETH worth more than half a billion dollars over a two-day period. Not only did they boost their collective holdings to 22% of ETH’s supply, but they also indicated their long-term conviction in the asset.
Additionally, there’s anticipation building around potential approvals by the U.S. Securities and Exchange Commission (SEC) of staking within spot Ethereum ETFs. According to K33 Research, this could push up the price of ETH far more significantly than has been done by technical upgrades to the network.
And while Bitcoin may have reached a new all-time high (ATH) past $113,000, the flip arrived just as ETH recorded a sizable uptick of its own,hitting$2,810 at one point, to move closer to a key resistance level not breached since February.
Analysts like Daan Crypto Trades argue that a break above $2,800 could trigger liquidations that would ignite “a lot of momentum,” which might see Ethereum reach $3,000 and beyond.Market Mechanics
Interestingly, during BTC’s run to the new ATH, Glassnode observed a curious shift in the structure of the futures market.
In late June, rising Bitcoin prices were met with declining open interest, possibly indicating short squeezes; however, this time, open interest went up alongside BTC’s price, suggesting fresh long positions were entering the market.
Despite Ethereum’s strong showing, caution remains warranted. Bitcoin still commands a greater share of institutional products and remains the macro barometer for crypto.
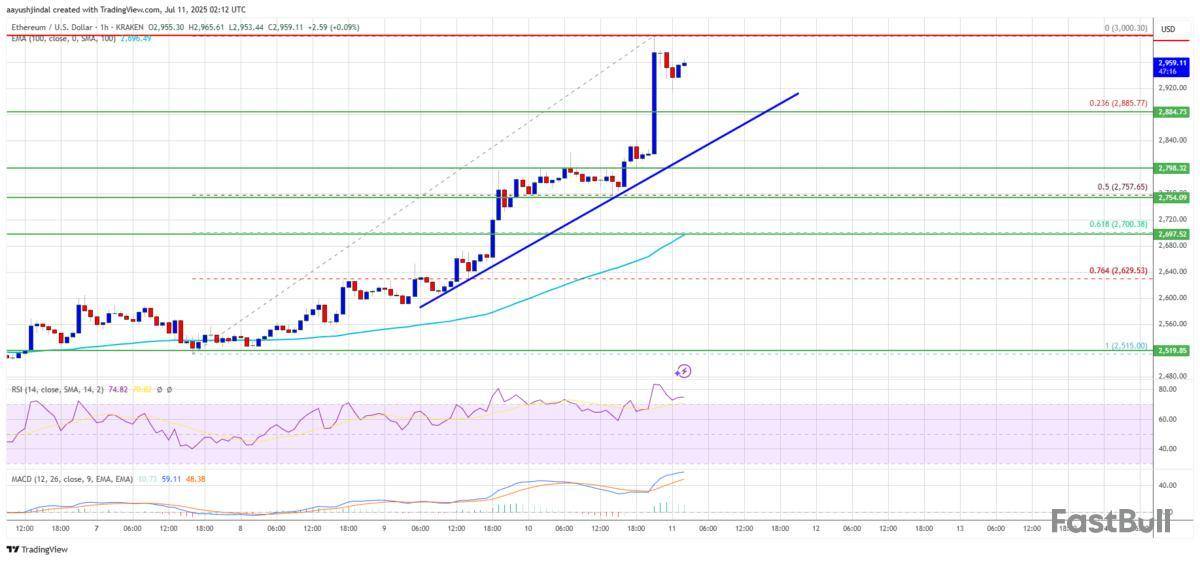
Ethereum price started a fresh increase above the $2,800 zone. ETH is now consolidating gains and might aim for a fresh move above $3,000.
Ethereum Price Rallies Above $2,880
Ethereum price started a fresh increase above the $2,750 zone, like Bitcoin. ETH price gained pace for a move above the $2,800 resistance zone and entered a positive zone.
The bulls even pumped the price above $2,880. Finally, it tested the $3,000 zone. A high was formed at $3,000 and the price is now consolidating gains. It is stable above the 23.6% Fib retracement level of the upward move from the $2,515 swing low to the $3,000 high.
Ethereum price is now trading above $2,880 and the 100-hourly Simple Moving Average. Besides, there is a key bullish trend line forming with support at $2,885 on the hourly chart of ETH/USD.
On the upside, the price could face resistance near the $2,980 level. The next key resistance is near the $3,000 level. The first major resistance is near the $3,040 level. A clear move above the $3,040 resistance might send the price toward the $3,120 resistance.
An upside break above the $3,120 resistance might call for more gains in the coming sessions. In the stated case, Ether could rise toward the $3,200 resistance zone or even $3,220 in the near term.
Are Downsides Limited In ETH?
If Ethereum fails to clear the $3,000 resistance, it could start a downside correction. Initial support on the downside is near the $2,920 level. The first major support sits near the $2,880 zone and the trend line.
A clear move below the $2,880 support might push the price toward the $2,750 support or the 50% Fib retracement level of the upward move from the $2,515 swing low to the $3,000 high. Any more losses might send the price toward the $2,720 support level in the near term. The next key support sits at $2,650.
Technical Indicators
Hourly MACD – The MACD for ETH/USD is gaining momentum in the bullish zone.
Hourly RSI – The RSI for ETH/USD is now above the 50 zone.
Major Support Level – $2,880
Major Resistance Level – $3,000
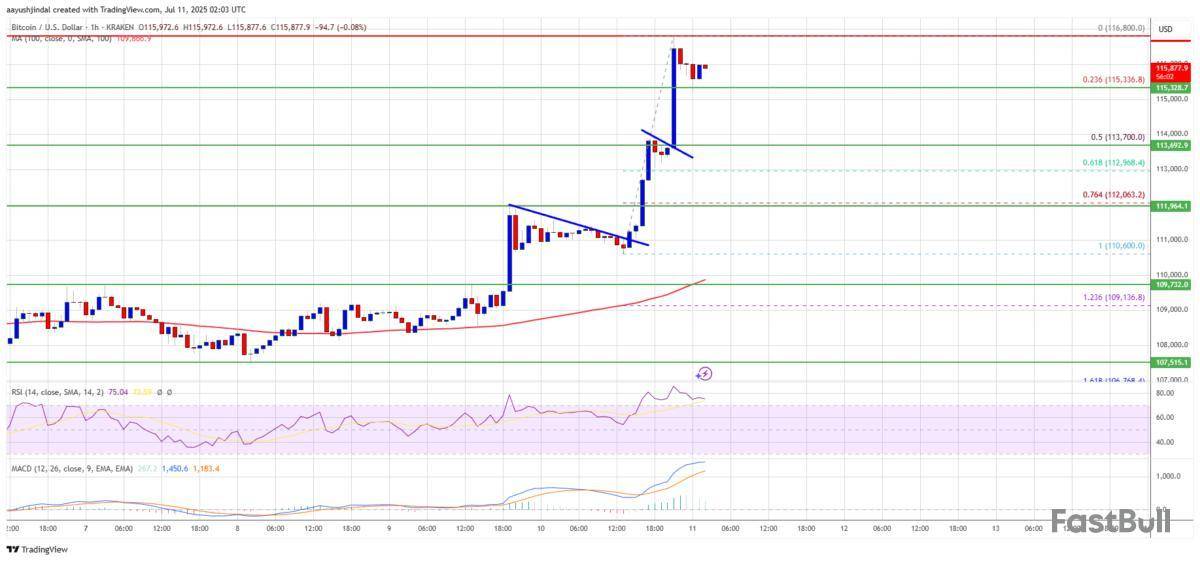
Bitcoin price started a fresh increase above the $110,500 zone. BTC is now up over 5%, traded to a new high, and extend gains above the $116,000 level.
Bitcoin Price Sets New ATH
Bitcoin price started a fresh increase after it cleared the $110,500 resistance zone. BTC gained pace for a move above the $112,000 and $113,500 resistance.
Besides, there was a break above a bearish trend line with resistance at $111,000 on the hourly chart of the BTC/USD pair. The bulls even pumped the pair above the $115,000 resistance zone. A new all-time high was formed at $116,800 and the price is now consolidating gains above the 23.6% Fib retracement level of the upward move from the $110,600 swing low to the $116,800 high.
Bitcoin is now trading above $113,500 and the 100 hourly Simple moving average. Immediate resistance on the upside is near the $116,000 level. The first key resistance is near the $116,200 level. The next resistance could be $116,800.
A close above the $116,800 resistance might send the price further higher. In the stated case, the price could rise and test the $118,000 resistance level. Any more gains might send the price toward the $118,800 level. The main target could be $120,000.
Downside Correction In BTC?
If Bitcoin fails to rise above the $116,800 resistance zone, it could start a downside correction. Immediate support is near the $115,300 level. The first major support is near the $113,700 level or the 50% Fib retracement level of the upward move from the $110,600 swing low to the $116,800 high.
The next support is now near the $113,200 zone. Any more losses might send the price toward the $112,500 support in the near term. The main support sits at $110,500, below which BTC might continue to move down.
Technical indicators:
Hourly MACD – The MACD is now gaining pace in the bullish zone.
Hourly RSI (Relative Strength Index) – The RSI for BTC/USD is now above the 50 level.
Major Support Levels – $115,300, followed by $113,700.
Major Resistance Levels – $116,800 and $118,000.
728 RM B 7/F GEE LOK IND BLDG NO 34 HUNG TO RD KWUN TONG KLN HONG KONG


White Label
Data API
Web Plug-ins
Poster Maker
Affiliate Program
The risk of loss in trading financial instruments such as stocks, FX, commodities, futures, bonds, ETFs and crypto can be substantial. You may sustain a total loss of the funds that you deposit with your broker. Therefore, you should carefully consider whether such trading is suitable for you in light of your circumstances and financial resources.
No decision to invest should be made without thoroughly conducting due diligence by yourself or consulting with your financial advisors. Our web content might not suit you since we don't know your financial conditions and investment needs. Our financial information might have latency or contain inaccuracy, so you should be fully responsible for any of your trading and investment decisions. The company will not be responsible for your capital loss.
Without getting permission from the website, you are not allowed to copy the website's graphics, texts, or trademarks. Intellectual property rights in the content or data incorporated into this website belong to its providers and exchange merchants.
Not Logged In
Log in to access more features

FastBull Membership
Not yet
Purchase


Log In
Sign Up


