Markets
News
Analysis
User
24/7
Economic Calendar
Education
Data
- Names
- Latest
- Prev


Signal Accounts for Members
All Signal Accounts
All Contests


U.K. Trade Balance Non-EU (SA) (Oct)A:--
F: --
P: --
U.K. Trade Balance (Oct)A:--
F: --
P: --
U.K. Services Index MoMA:--
F: --
P: --
U.K. Construction Output MoM (SA) (Oct)A:--
F: --
P: --
U.K. Industrial Output YoY (Oct)A:--
F: --
P: --
U.K. Trade Balance (SA) (Oct)A:--
F: --
P: --
U.K. Trade Balance EU (SA) (Oct)A:--
F: --
P: --
U.K. Manufacturing Output YoY (Oct)A:--
F: --
P: --
U.K. GDP MoM (Oct)A:--
F: --
P: --
U.K. GDP YoY (SA) (Oct)A:--
F: --
P: --
U.K. Industrial Output MoM (Oct)A:--
F: --
P: --
U.K. Construction Output YoY (Oct)A:--
F: --
P: --
France HICP Final MoM (Nov)A:--
F: --
P: --
China, Mainland Outstanding Loans Growth YoY (Nov)A:--
F: --
P: --
China, Mainland M2 Money Supply YoY (Nov)A:--
F: --
P: --
China, Mainland M0 Money Supply YoY (Nov)A:--
F: --
P: --
China, Mainland M1 Money Supply YoY (Nov)A:--
F: --
P: --
India CPI YoY (Nov)A:--
F: --
P: --
India Deposit Gowth YoYA:--
F: --
P: --
Brazil Services Growth YoY (Oct)A:--
F: --
P: --
Mexico Industrial Output YoY (Oct)A:--
F: --
P: --
Russia Trade Balance (Oct)A:--
F: --
P: --
Philadelphia Fed President Henry Paulson delivers a speech
Canada Building Permits MoM (SA) (Oct)A:--
F: --
P: --
Canada Wholesale Sales YoY (Oct)A:--
F: --
P: --
Canada Wholesale Inventory MoM (Oct)A:--
F: --
P: --
Canada Wholesale Inventory YoY (Oct)A:--
F: --
P: --
Canada Wholesale Sales MoM (SA) (Oct)A:--
F: --
P: --
Germany Current Account (Not SA) (Oct)A:--
F: --
P: --
U.S. Weekly Total Rig CountA:--
F: --
P: --
U.S. Weekly Total Oil Rig CountA:--
F: --
P: --
Japan Tankan Large Non-Manufacturing Diffusion Index (Q4)--
F: --
P: --
Japan Tankan Small Manufacturing Outlook Index (Q4)--
F: --
P: --
Japan Tankan Large Non-Manufacturing Outlook Index (Q4)--
F: --
P: --
Japan Tankan Large Manufacturing Outlook Index (Q4)--
F: --
P: --
Japan Tankan Small Manufacturing Diffusion Index (Q4)--
F: --
P: --
Japan Tankan Large Manufacturing Diffusion Index (Q4)--
F: --
P: --
Japan Tankan Large-Enterprise Capital Expenditure YoY (Q4)--
F: --
P: --
U.K. Rightmove House Price Index YoY (Dec)--
F: --
P: --
China, Mainland Industrial Output YoY (YTD) (Nov)--
F: --
P: --
China, Mainland Urban Area Unemployment Rate (Nov)--
F: --
P: --
Saudi Arabia CPI YoY (Nov)--
F: --
P: --
Euro Zone Industrial Output YoY (Oct)--
F: --
P: --
Euro Zone Industrial Output MoM (Oct)--
F: --
P: --
Canada Existing Home Sales MoM (Nov)--
F: --
P: --
Euro Zone Total Reserve Assets (Nov)--
F: --
P: --
U.K. Inflation Rate Expectations--
F: --
P: --
Canada National Economic Confidence Index--
F: --
P: --
Canada New Housing Starts (Nov)--
F: --
P: --
U.S. NY Fed Manufacturing Employment Index (Dec)--
F: --
P: --
U.S. NY Fed Manufacturing Index (Dec)--
F: --
P: --
Canada Core CPI YoY (Nov)--
F: --
P: --
Canada Manufacturing Unfilled Orders MoM (Oct)--
F: --
P: --
Canada Manufacturing New Orders MoM (Oct)--
F: --
P: --
Canada Core CPI MoM (Nov)--
F: --
P: --
Canada Manufacturing Inventory MoM (Oct)--
F: --
P: --
Canada CPI YoY (Nov)--
F: --
P: --
Canada CPI MoM (Nov)--
F: --
P: --
Canada CPI YoY (SA) (Nov)--
F: --
P: --
Canada Core CPI MoM (SA) (Nov)--
F: --
P: --


No matching data
Latest Views
Latest Views
Trending Topics
Top Columnists
Latest Update
White Label
Data API
Web Plug-ins
Affiliate Program
View All

No data
Data of the Bitcoin Stablecoin Supply Ratio suggests investors have stronger purchasing power today than during the previous bull rally.
Bitcoin Stablecoin Supply Ratio Showing Neutral Purchasing Power
In its latest weekly report, the on-chain analytics firm Glassnode has talked about the latest trend in the Stablecoin Supply Ratio (SSR) of Bitcoin. This indicator measures the ratio between the Bitcoin supply and the supply of stablecoins.
Stablecoins are cryptocurrencies that have their price tied to a fiat currency. The SSR specifically measures the supply of the stablecoins tied to the US Dollar (USD). As for the role that these assets play in the sector, Glassnode explains:
Stablecoins have become a critical component of the digital asset ecosystem, serving as the primary quote asset for trading across both centralized and decentralized venues. Functionally, they represent readily available capital, or “dry powder”, available for digital asset purchases.
As such, the SSR compares the Bitcoin supply against this available dry powder. In other words, it tells us about how the cryptocurrency compares against the investor’s purchasing power.
When the value of the metric is high, it means the BTC supply is high compared to the stablecoin supply. In other words, the trader’s purchasing power is weak. On the other hand, the indicator being low suggests there is high dry powder available relative to the BTC supply.
In the context of the current discussion, the SSR itself isn’t of focus, but rather a modified indicator called the SSR Oscillator. According to the analytics firm, the metric measures “how the 200d SMA of the SSR moves within the Bollinger Bands BB(200, 2).”
Now, here is a chart that shows the trend in the Bitcoin SSR Oscillator over the last few years:
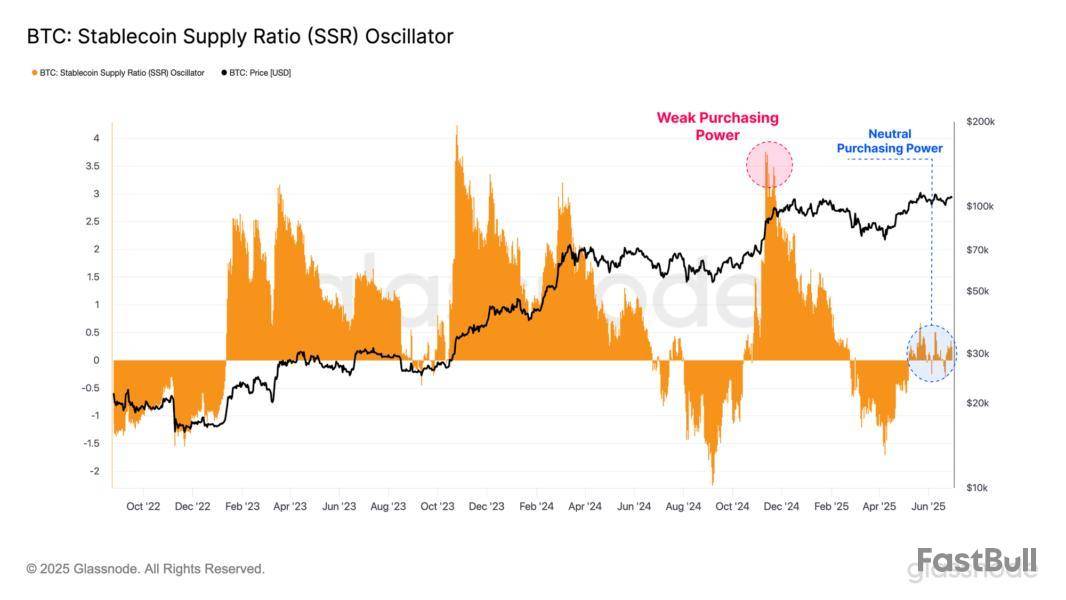
As displayed in the above graph, the Bitcoin SSR Oscillator has been close to the zero mark during the last couple of months, indicating the investor purchasing power is more or less neutral compared to the size of the BTC supply.
From the chart, it’s visible that the trend was different during the rally beyond $100,000 that occurred late last year. Back then, the SSR Oscillator took on a highly positive value, suggesting the stablecoin supply was low relative to BTC.
The cryptocurrency is currently also trading around the same levels as then, yet the SSR is showing a different story. “Despite similar price levels, this shift suggests that investor purchasing power has improved markedly, reflecting stronger underlying demand conditions,” notes the report.
BTC Price
At the time of writing, Bitcoin is trading around $109,500, up over 2% in the last seven days.
After more than 14 years of inactivity, two bitcoin wallet addresses collectively holding 20,000 BTC were activated late Thursday night, according to onchain data.
On April 3, 2011, Bitcoin wallet address "1HqXB...gDwcK" transferred 23,377.83 BTC to three different destinations. Two of these addresses each received 10,000 BTC, while the third took the remaining 3,377.83 BTC, according to Blockchain.com data.
For 14 years, the two wallets that received 10,000 BTC each — "12tLs...xj2me" and "1KbrS...AWJYm" — remained dormant. This changed across late Thursday night and early Friday morning, when they moved their respective 10,000 BTC stashes to new addresses within 30 minutes of each other. The third wallet, which received 3,377.83 BTC, had already spent or moved its funds back in 2011.
The receiving addresses have not moved the bitcoin since. Receiving the 10,000 BTC is the first transaction recorded on both addresses.
Over the 14 years of dormancy, the 20,000 BTC has appreciated by 13,982,800% in value, rising from a mere $7,800 to $2.18 billion. The exact reason for the transfer, the owners’ identity, and whether a single individual controls both addresses remain unknown.
Meanwhile, bitcoin held steady in the past day, down 0.09% to trade at $109,064 as of 1:30 a.m. on Friday. The world's largest cryptocurrency has managed to maintain a solid position above the $100,000 resistance line in recent weeks, where analysts say a longer-term macro catalyst could boost it through its all-time high of around $118,000.
Disclaimer: The Block is an independent media outlet that delivers news, research, and data. As of November 2023, Foresight Ventures is a majority investor of The Block. Foresight Ventures invests in other companies in the crypto space. Crypto exchange Bitget is an anchor LP for Foresight Ventures. The Block continues to operate independently to deliver objective, impactful, and timely information about the crypto industry. Here are our current financial disclosures.
© 2025 The Block. All Rights Reserved. This article is provided for informational purposes only. It is not offered or intended to be used as legal, tax, investment, financial, or other advice.
White Label
Data API
Web Plug-ins
Poster Maker
Affiliate Program
The risk of loss in trading financial instruments such as stocks, FX, commodities, futures, bonds, ETFs and crypto can be substantial. You may sustain a total loss of the funds that you deposit with your broker. Therefore, you should carefully consider whether such trading is suitable for you in light of your circumstances and financial resources.
No decision to invest should be made without thoroughly conducting due diligence by yourself or consulting with your financial advisors. Our web content might not suit you since we don't know your financial conditions and investment needs. Our financial information might have latency or contain inaccuracy, so you should be fully responsible for any of your trading and investment decisions. The company will not be responsible for your capital loss.
Without getting permission from the website, you are not allowed to copy the website's graphics, texts, or trademarks. Intellectual property rights in the content or data incorporated into this website belong to its providers and exchange merchants.
Not Logged In
Log in to access more features

FastBull Membership
Not yet
Purchase
Log In
Sign Up