• Trade
  • Markets
  • Copy
  • Contests
  • News
  • 24/7
  • Calendar
  • Q&A
  • Chats
Trending
Screeners
SYMBOL
LAST
BID
ASK
HIGH
LOW
NET CHG.
%CHG.
SPREAD
SPX
S&P 500 Index
6827.42
6827.42
6827.42
6899.86
6801.80
-73.58
-1.07%
--
DJI
Dow Jones Industrial Average
48458.04
48458.04
48458.04
48886.86
48334.10
-245.98
-0.51%
--
IXIC
NASDAQ Composite Index
23195.16
23195.16
23195.16
23554.89
23094.51
-398.69
-1.69%
--
USDX
US Dollar Index
97.910
97.990
97.910
98.070
97.890
-0.040
-0.04%
--
EURUSD
Euro / US Dollar
1.17398
1.17405
1.17398
1.17447
1.17262
+0.00004
0.00%
--
GBPUSD
Pound Sterling / US Dollar
1.33801
1.33810
1.33801
1.33856
1.33546
+0.00094
+ 0.07%
--
XAUUSD
Gold / US Dollar
4345.90
4346.33
4345.90
4350.16
4294.68
+46.51
+ 1.08%
--
WTI
Light Sweet Crude Oil
57.386
57.416
57.386
57.601
57.194
+0.153
+ 0.27%
--

Community Accounts

Signal Accounts
--
Profit Accounts
--
Loss Accounts
--
View More

Become a signal provider

Sell trading signals to earn additional income

View More

Guide to Copy Trading

Get started with ease and confidence

View More

Signal Accounts for Members

All Signal Accounts

Best Return
  • Best Return
  • Best P/L
  • Best MDD
Past 1W
  • Past 1W
  • Past 1M
  • Past 1Y

All Contests

  • All
  • Trump Updates
  • Recommend
  • Stocks
  • Cryptocurrencies
  • Central Banks
  • Featured News
Top News Only
Share

London Metal Exchange: Intends To Publish A Consultation On The Proposed Changes To Our Rules In Response To The Regime Early In2026

Share

London Metal Exchange: Announces Publication Of Update Describing How The London Metal Exchange Plans To Implement The Fca Policy Statement 25/1 On Commodity Reform

Share

USA - Listed Shares Of Gold Miners Rise Premarket After Gold Rises About 1%

Share

The Council Of The European Union: In Light Of The Situation In Venezuela, The Council Decided Today To Extend The Existing Restrictions For Another Year, Until 10 January 2027

Share

Ivory Coast 2025/26 Cocoa Arrivals Reached 894000 T By December 14 Versus 895000 T Year Ago - Exporters' Estimate

Share

Ishares MSCI Chile ETF Up 3.9% Premarket After Jose Antonio Kast Wins Chile's Presidential Election On Sunday

Share

Spain's Debt-To-GDP Ratio Falls To 103.2% In Third Quarter 2025

Share

China's Central Bank: Authorises DBS Bank As Yuan Clearing Bank In Singapore

Share

Bank Of Korea - South Korea Central Bank, Nps Agree To Extend Currency Swap Agreement For Another Year

Share

Poland's CPI At 0.1% Month-On-Month In November Versus 0.1% Released Earlier

Share

London Metal Exchange (LME): Copper Inventories Decreased By 25 Tons, Aluminum Inventories Decreased By 50 Tons, Nickel Inventories Increased By 360 Tons, Zinc Inventories Increased By 2,550 Tons, Lead Inventories Increased By 17,725 Tons, And Tin Inventories Increased By 125 Tons

Share

Polish Inflation At 2.5% Year-On-Year In November

Share

Poland's January-October Import Up 5.4% To 309.3 Billion Euros

Share

Poland's January-October Trade Balance At -5.1 Billion Euros

Share

Poland's January-October Export Up 2.8% To 304.3 Billion Euros

Share

Ceasefire Negotiations Between Ukraine And US Representatives In Berlin To Continue Monday Morning - German Source Familiar With The Schedule

Share

Spain's IBEX Hits Fresh Record High, Up Over 1%

Share

Spot Silver Rises Nearly 3% To $63.82/Oz

Share

France's Foreign Minister Says He Suggesd To EU's Kallas That US Representatives Brief EU Foreign Ministers On Gaza Peace Plan During Their Meeting

Share

India Trade Secretary: Prime Facie Don't See A Case Of Rice Dumping To USA And There Is No Active Investigation On That

TIME
ACT
FCST
PREV
France HICP Final MoM (Nov)

A:--

F: --

P: --

China, Mainland Outstanding Loans Growth YoY (Nov)

A:--

F: --

P: --

China, Mainland M2 Money Supply YoY (Nov)

A:--

F: --

P: --

China, Mainland M0 Money Supply YoY (Nov)

A:--

F: --

P: --

China, Mainland M1 Money Supply YoY (Nov)

A:--

F: --

P: --

India CPI YoY (Nov)

A:--

F: --

P: --

India Deposit Gowth YoY

A:--

F: --

P: --

Brazil Services Growth YoY (Oct)

A:--

F: --

P: --

Mexico Industrial Output YoY (Oct)

A:--

F: --

P: --

Russia Trade Balance (Oct)

A:--

F: --

P: --

Philadelphia Fed President Henry Paulson delivers a speech
Canada Building Permits MoM (SA) (Oct)

A:--

F: --

P: --

Canada Wholesale Sales YoY (Oct)

A:--

F: --

P: --

Canada Wholesale Inventory MoM (Oct)

A:--

F: --

P: --

Canada Wholesale Inventory YoY (Oct)

A:--

F: --

P: --

Canada Wholesale Sales MoM (SA) (Oct)

A:--

F: --

P: --

Germany Current Account (Not SA) (Oct)

A:--

F: --

P: --

U.S. Weekly Total Rig Count

A:--

F: --

P: --

U.S. Weekly Total Oil Rig Count

A:--

F: --

P: --

Japan Tankan Small Manufacturing Outlook Index (Q4)

A:--

F: --

P: --

Japan Tankan Large Non-Manufacturing Diffusion Index (Q4)

A:--

F: --

P: --

Japan Tankan Large Non-Manufacturing Outlook Index (Q4)

A:--

F: --

P: --

Japan Tankan Large Manufacturing Outlook Index (Q4)

A:--

F: --

P: --

Japan Tankan Small Manufacturing Diffusion Index (Q4)

A:--

F: --

P: --

Japan Tankan Large Manufacturing Diffusion Index (Q4)

A:--

F: --

P: --

Japan Tankan Large-Enterprise Capital Expenditure YoY (Q4)

A:--

F: --

P: --

U.K. Rightmove House Price Index YoY (Dec)

A:--

F: --

P: --

China, Mainland Industrial Output YoY (YTD) (Nov)

A:--

F: --

P: --

China, Mainland Urban Area Unemployment Rate (Nov)

A:--

F: --

P: --

Saudi Arabia CPI YoY (Nov)

A:--

F: --

P: --

Euro Zone Industrial Output YoY (Oct)

--

F: --

P: --

Euro Zone Industrial Output MoM (Oct)

--

F: --

P: --

Canada Existing Home Sales MoM (Nov)

--

F: --

P: --

Euro Zone Total Reserve Assets (Nov)

--

F: --

P: --

U.K. Inflation Rate Expectations

--

F: --

P: --

Canada National Economic Confidence Index

--

F: --

P: --

Canada New Housing Starts (Nov)

--

F: --

P: --

U.S. NY Fed Manufacturing Employment Index (Dec)

--

F: --

P: --

U.S. NY Fed Manufacturing Index (Dec)

--

F: --

P: --

Canada Core CPI YoY (Nov)

--

F: --

P: --

Canada Manufacturing Unfilled Orders MoM (Oct)

--

F: --

P: --

U.S. NY Fed Manufacturing Prices Received Index (Dec)

--

F: --

P: --

U.S. NY Fed Manufacturing New Orders Index (Dec)

--

F: --

P: --

Canada Manufacturing New Orders MoM (Oct)

--

F: --

P: --

Canada Core CPI MoM (Nov)

--

F: --

P: --

Canada Trimmed CPI YoY (SA) (Nov)

--

F: --

P: --

Canada Manufacturing Inventory MoM (Oct)

--

F: --

P: --

Canada CPI YoY (Nov)

--

F: --

P: --

Canada CPI MoM (Nov)

--

F: --

P: --

Canada CPI YoY (SA) (Nov)

--

F: --

P: --

Canada Core CPI MoM (SA) (Nov)

--

F: --

P: --

Canada CPI MoM (SA) (Nov)

--

F: --

P: --

Federal Reserve Board Governor Milan delivered a speech
U.S. NAHB Housing Market Index (Dec)

--

F: --

P: --

Australia Composite PMI Prelim (Dec)

--

F: --

P: --

Australia Services PMI Prelim (Dec)

--

F: --

P: --

Australia Manufacturing PMI Prelim (Dec)

--

F: --

P: --

Japan Manufacturing PMI Prelim (SA) (Dec)

--

F: --

P: --

U.K. Unemployment Claimant Count (Nov)

--

F: --

P: --

U.K. Unemployment Rate (Nov)

--

F: --

P: --

U.K. 3-Month ILO Unemployment Rate (Oct)

--

F: --

P: --

Q&A with Experts
    • All
    • Chatrooms
    • Groups
    • Friends
    Connecting
    .
    .
    .
    Type here...
    Add Symbol or Code

      No matching data

      All
      Trump Updates
      Recommend
      Stocks
      Cryptocurrencies
      Central Banks
      Featured News
      • All
      • Russia-Ukraine Conflict
      • Middle East Flashpoint
      • All
      • Russia-Ukraine Conflict
      • Middle East Flashpoint
      Search
      Products

      Charts Free Forever

      Chats Q&A with Experts
      Screeners Economic Calendar Data Tools
      Membership Features
      Data Warehouse Market Trends Institutional Data Policy Rates Macro

      Market Trends

      Market Sentiment Order Book Forex Correlations

      Top Indicators

      Charts Free Forever
      Markets

      News

      News Analysis 24/7 Columns Education
      From Institutions From Analysts
      Topics Columnists

      Latest Views

      Latest Views

      Trending Topics

      Top Columnists

      Latest Update

      Signals

      Copy Rankings Latest Signals Become a signal provider AI Rating
      Contests
      Brokers

      Overview Brokers Assessment Rankings Regulators News Claims
      Broker listing Forex Brokers Comparison Tool Live Spread Comparison Scam
      Q&A Complaint Scam Alert Videos Tips to Detect Scam
      More

      Business
      Events
      Careers About Us Advertising Help Center

      White Label

      Data API

      Web Plug-ins

      Affiliate Program

      Awards Institution Evaluation IB Seminar Salon Event Exhibition
      Vietnam Thailand Singapore Dubai
      Fans Party Investment Sharing Session
      FastBull Summit BrokersView Expo
      Recent Searches
        Top Searches
          Markets
          News
          Analysis
          User
          24/7
          Economic Calendar
          Education
          Data
          • Names
          • Latest
          • Prev

          View All

          No data

          Scan to Download

          Faster Charts, Chat Faster!

          Download App
          English
          • English
          • Español
          • العربية
          • Bahasa Indonesia
          • Bahasa Melayu
          • Tiếng Việt
          • ภาษาไทย
          • Français
          • Italiano
          • Türkçe
          • Русский язык
          • 简中
          • 繁中
          Open Account
          Search
          Products
          Charts Free Forever
          Markets
          News
          Signals

          Copy Rankings Latest Signals Become a signal provider AI Rating
          Contests
          Brokers

          Overview Brokers Assessment Rankings Regulators News Claims
          Broker listing Forex Brokers Comparison Tool Live Spread Comparison Scam
          Q&A Complaint Scam Alert Videos Tips to Detect Scam
          More

          Business
          Events
          Careers About Us Advertising Help Center

          White Label

          Data API

          Web Plug-ins

          Affiliate Program

          Awards Institution Evaluation IB Seminar Salon Event Exhibition
          Vietnam Thailand Singapore Dubai
          Fans Party Investment Sharing Session
          FastBull Summit BrokersView Expo

          ADA dip buyers defend key support: Will the bounce lead to $1?

          Cointelegraph
          1inch / Tether
          -1.13%
          Vaulta / Tether
          -1.17%
          AAVE / Tether
          +1.43%
          Fusionist / Tether
          -2.56%

          Key point:

          • ADA rebounded off a strong support, increasing the likelihood of a break above the $0.94 resistance.

          Strong rallies are generally followed by equally sharp declines. That is what happened with several altcoins, and Cardano (ADA) is no exception. Usually, the pullback shakes out the weak hands before resuming the uptrend.

          Has ADA topped out in the near term, or is the dip a good buying opportunity? Let’s analyze the charts to find out.

          Cardano price prediction

          ADA broke above the $0.86 overhead resistance on Monday, but the bulls could not sustain the higher levels.

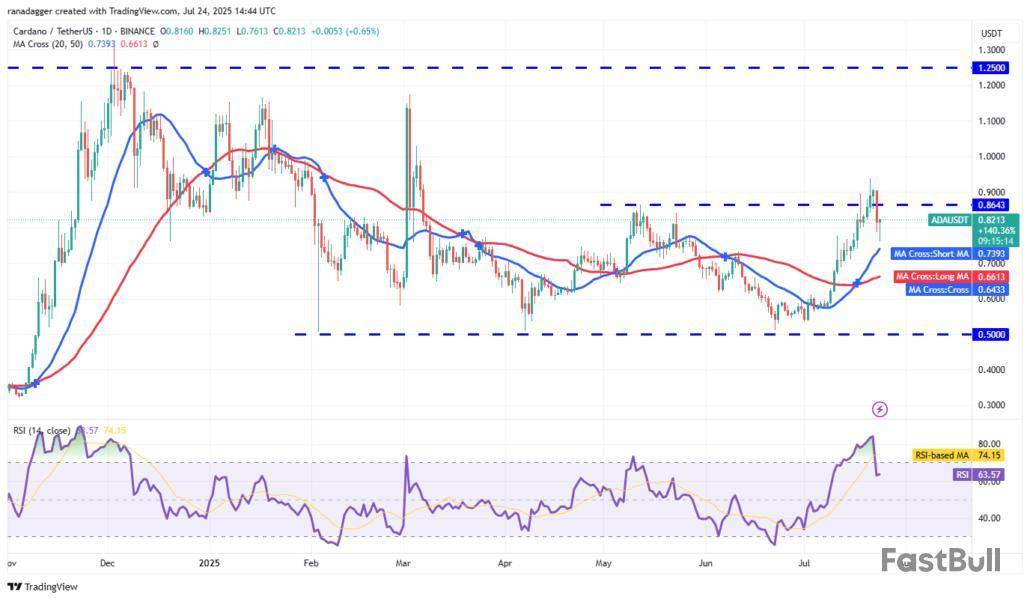
          The price turned down sharply on Wednesday and plunged below the breakout level of $0.86. The bears pulled the price toward the 20-day simple moving average ($0.73) on Thursday, but the long tail on the candlestick shows solid buying at lower levels.

          The bulls will try to challenge the overhead resistance of $0.94. If the level is crossed, the pair could climb to $1.02 and later to $1.17.

          Contrarily, if the price turns down and breaks below the 20-day SMA, it suggests that the breakout above $0.86 may have been a bull trap. The pair could then plunge to the 50-day SMA ($0.66).

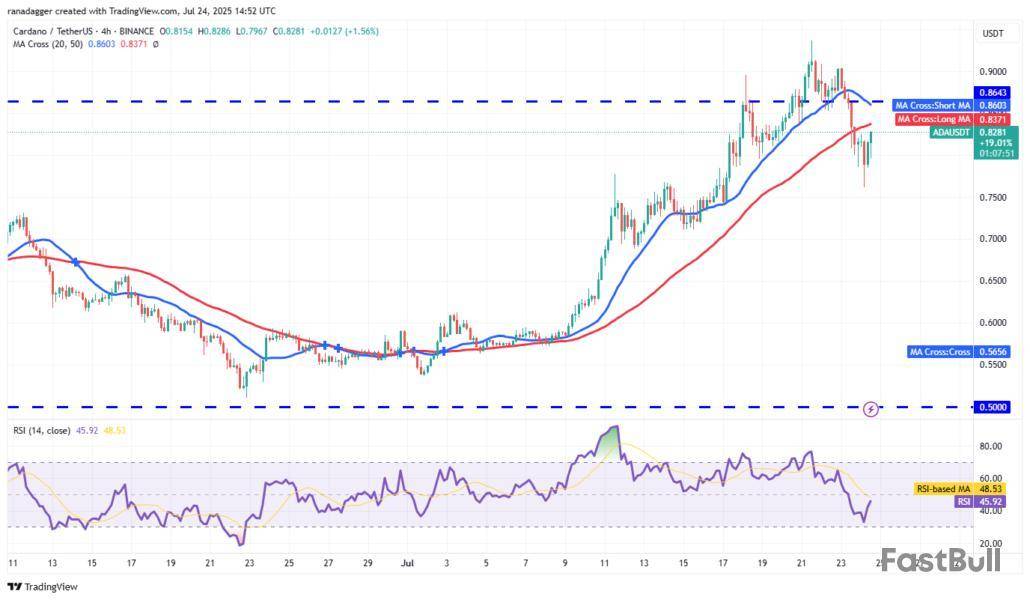
          The moving averages are on the verge of a bearish crossover on the 4-hour chart, indicating a comeback attempt by the bears. Recovery attempts are likely to face selling at the 20-SMA.

          If the price turns down from the 20-SMA, the pair could descend to $0.75 and later to $0.70. The deeper the fall, the greater the time it is likely to take for the next leg of the uptrend to begin.

          Buyers will have to drive the price above the 20-SMA to get back into the driver’s seat. If they do that, the pair could rise to $0.90 and subsequently to $0.94.

          This article does not contain investment advice or recommendations. Every investment and trading move involves risk, and readers should conduct their own research when making a decision.

          Risk Warnings and Disclaimers
          You understand and acknowledge that there is a high degree of risk involved in trading. Following any strategies or investment methods may lead to potential losses. The content on the site is provided by our contributors and analysts for information purposes only. You are solely responsible for determining whether any trading assets, securities, strategy, or any other product is suitable for investing based on your own investment objectives and financial situation.
          Add to Favorites
          Share

          This Ethereum Descending Broadening Wedge Pattern Looks Similar To 2019-2020, Here’s What Happened Last Time

          NewsBTC
          1inch / Tether
          -1.13%
          Vaulta / Tether
          -1.17%
          AAVE / Tether
          +1.43%
          Fusionist / Tether
          -2.56%

          Crypto analyst Crypto Bullet has alluded to a technical pattern for Ethereum, which mirrors its 2019/2020 price action. Based on the similarities, the analyst gave a breakdown of what to expect from ETH in the coming months. 

          Ethereum Shows Descending Broadening Pattern

          In an X post, Crypto Bullet stated that Ethereum has shown an impressive recovery and is now starting to resemble a Descending Broadening Wedge pattern. He further noted that this pattern is almost identical to the one which ETH had between 2019 and 2020. The analyst added that the picture looks very bullish right now. Between 2019 and 2020, when this pattern emerged, the altcoin rallied from around $180 to $700 in just six months. 

          Further commenting on the current Ethereum price action, Crypto Bullet revealed that the altcoin is testing the resistance at around $3,700 for the third time. He believes that ETH will eventually break out from this range. However, the analyst warned that there may be a 10 to 15% pullback around that area before that. 

          Meanwhile, Crypto Bullet assured that Ethereum will rally hard once it breaks out from this formidable resistance. He predicts that this breakout will lead to a new all-time high (ATH) for ETH, meaning the altcoin is likely to reach $4,900 on the next uptrend. The analyst also stated that the cycle top target for ETH is between $8,000 and $10,000. 

          Crypto analyst Mikybull Crypto is also confident that Ethereum can reach $10,000 before this market cycle ends. In an X post, he stated that the euphoria stage will start when ETH breaks a new all-time high (ATH). He indicated that the break above ATH will spark a rally to between $7,000 and $10,000. Once that happens, the analyst believes that a massive bear market will ensue. 

          ETH Is Yet To Enter The Banana Zone

          In an X post, crypto analyst Ted stated that Ethereum is yet to enter the banana zone. He noted that right now, the altcoin is going through a correction after pulling a 70% rally from its April 2025 lows. The analyst further opined that there will be some sideways accumulation before ETH breaks above $4,100. 

          However, once that happens, he predicts that Ethereum will record the “most violent rally.” His accompanying chart showed that ETH could rally to a new ATH of around $7,000 on the first leg up. Based on the chart, Ted also believes that the altcoin could reach $14,000, $41,000, and $92,000 at some point. 

          At the time of writing, the Ethereum price is trading at around $3,563, down over 4% in the last 24 hours, according to data from CoinMarketCap.

          Risk Warnings and Disclaimers
          You understand and acknowledge that there is a high degree of risk involved in trading. Following any strategies or investment methods may lead to potential losses. The content on the site is provided by our contributors and analysts for information purposes only. You are solely responsible for determining whether any trading assets, securities, strategy, or any other product is suitable for investing based on your own investment objectives and financial situation.
          Add to Favorites
          Share

          Ripple USD Stablecoin Dethrones Bitcoin Satoshi Vision in Major Crypto Top

          U.Today
          1inch / Tether
          -1.13%
          Vaulta / Tether
          -1.17%
          AAVE / Tether
          +1.43%
          Fusionist / Tether
          -2.56%

          Ripple USD (RLUSD) stablecoin has officially overtaken Bitcoin SV (BSV) at the CoinMarketCap top, claiming 116th place with a market capitalization of $557.7 million. A new dollar-backed stablecoin has overtaken what was once positioned as a continuation of Satoshi Nakamoto's original vision for Bitcoin — a shift of significance that is hard to overestimate.

          BSV, now at 117, has struggled following a 4.45% drop over the last 24 hours, whereas RLUSD has remained stable at $1.00, as it should be for USD stablecoin. But beyond price, the numbers paint a broader contrast — Ripple stablecoin saw over $512 million in 24-hour trading volume — nearly nine times more than BSV's $58 million. 

          Again, with a market cap of $557.7 million, that is a 91.9% ratio to volume, which highlights an absolutely abnormal market engagement level.CoinMarketCap">

          This comes just two weeks after RLUSD crossed the half-billion market cap mark. It is now the eighth largest stablecoin overall and also ranks eighth among USD-pegged stablecoins specifically — a segment with a combined value of roughly $227 billion.

          Demand for Ripple USD is palpable. The reserves backing it are now being custodied by BNY Mellon, the oldest bank in the United States and one of the largest in the world, with over $2 trillion in assets under management.

          Nonetheless, forecasts remain conservative. According to Bloomberg, JPMorgan views the $2 trillion stablecoin market projection by 2028 as overly ambitious, citing underdeveloped infrastructure. The bank expects growth to double or triple from today's figure.

          For Ripple and its stablecoin, even such conservative projections may be enough to continue growing market presence and take the biggest share of the stablecoin "pie."

          Risk Warnings and Disclaimers
          You understand and acknowledge that there is a high degree of risk involved in trading. Following any strategies or investment methods may lead to potential losses. The content on the site is provided by our contributors and analysts for information purposes only. You are solely responsible for determining whether any trading assets, securities, strategy, or any other product is suitable for investing based on your own investment objectives and financial situation.
          Add to Favorites
          Share

          Top Altcoins To Buy Today As Crypto Market Cools Before Next Bull Run

          Coinpedia
          1inch / Tether
          -1.13%
          Vaulta / Tether
          -1.17%
          AAVE / Tether
          +1.43%
          Fusionist / Tether
          -2.56%

          Top altcoins like ARB, ONDO, XLM, HBAR, and INJ are setting up for the next breakout as the market cools ahead of a renewed altseason push.

          In Brief:

          • The Altcoin Season Index has dropped to 43, offering a healthy cooldown before the next breakout phase.
          • Arbitrum and ONDO are showing textbook breakout patterns backed by strong ecosystem catalysts.
          • Stellar and Hedera (HBAR) are consolidating after sharp rallies driven by RWA and institutional narratives.
          • Injective leads on-chain growth with a 1,770% surge in active users, signaling strong network demand.

          As of July 23, 2025, the CMC Altcoin Season Index stands at 43 out of 100, indicating that the market remains in Bitcoin-dominant territory, although altcoins have started gaining traction.

          This marks a moderate rise from last week’s index of 38 and a significant jump from last month’s low of 18, which was deep in Bitcoin season. The altcoin market cap is currently $1.59 trillion, continuing its uptrend despite not yet reaching peak altcoin season (index >75).

          The yearly high was recorded at 87 (Altcoin Season) in December 2024, while the yearly low hit 12 (Bitcoin Season) in April 2025. This upward momentum could hint at a gradual shift toward a more altcoin-friendly market environment.

          Arbitrum Sets Up for a Breakout: Cup-and-Handle in Play

          ARBUSD

          Arbitrum is forming a textbook Cup and Handle pattern on the daily chart, signaling a potential breakout after absorbing heavy sell pressure from recent token unlocks.

          The price has rebounded from the $0.34 base through multiple support zones and is now consolidating between $0.461 and $0.5045, shaping the handle.

          Technical indicators support this bullish structure: RSI has cooled to 53.7, MACD remains slightly bullish, and volume is gradually rising—all pointing to healthy momentum.

          ARB RSI

          However, bulls may need to sit tight as ARB continues cooling into the $0.415–$0.461 range. With RSI likely heading toward 35–40 and MACD turning south, a temporary dip toward $0.374 remains possible. That said, this zone serves as a key reload area.

          A breakout above $0.5045, likely between August 2–5, could ignite a rally to $0.522, with a measured upside target of $0.60–$0.63. Backed by the $216M Arbitrum DAO grant and growing L2 momentum, ARB stands out as one of the most technically aligned tokens in this altcoin season.

          ONDO Price Forms Double Bottom Amid ETF Filing Surge

          SEC Filing

          Following the July 22 SEC filing of the 21Shares Ondo Trust S-1, ONDO Coin experienced a sharp rally, briefly breaking above the key $1.13 neckline before pulling back.

          The move was fueled by speculation around potential ETF approval and growing momentum in the real-world asset tokenization space.

          On the daily chart, ONDO is now forming a textbook double bottom pattern, with the current price retesting the $0.94–$0.98 support zone—a classic post-breakout setup. If this level holds, the structure remains bullish, targeting $1.30–$1.40, with a measured move projection up to $1.58.

          ONDO USD

          Volume remains elevated, and the ETF narrative continues to provide strong tailwinds. A confirmed bounce could validate this ONDO chart pattern and trigger the next leg higher.

          XLM Price Forms Bullish Flag After 90% Rally Amid RWA Momentum

          Srellar USD

          Stellar has rallied over 90% in July, fueled by rising adoption in real-world asset tokenization and tailwinds from XRP’s legal clarity.

          The XLM price is now consolidating within a bullish flag pattern between $0.33 and $0.44, following its breakout from a long downtrend.

          Volume remains strong, and the MACD is cooling off after a parabolic move, with RSI dipping from 77.5 to 59, suggesting room for re-accumulation before the next leg.

          As long as price holds above the $0.37–$0.38 support, the structure remains intact. A breakout from this flag could target $0.51, with an extended move toward $0.60–$0.62. With $450M+ in tokenized assets, CBDC pilots, and high-profile partnerships like MoneyGram, XLM remains one of the strongest RWA and cross-border payment plays this cycle.

          HBAR Price Breaks Out of W Pattern on Institutional Catalyst

          HBARUSD

          Hedera (HBAR) has convincingly broken out of a multi-month W pattern, rallying from the $0.13–$0.14 buy zone to a local high of $0.287 before pulling back.

          The price is now testing the $0.23–$0.24 level, which should serve as strong support if bullish momentum holds.

          The BBTrend indicator has just flipped green after prolonged negative readings, reinforcing the likelihood of a continuation toward $0.35+.

          On the news front, HBAR’s inclusion in Grayscale’s Smart Contract Platform Fund and Canary Capital’s trust filing provide solid institutional backing.

          These developments, paired with the clean technical breakout, make HBAR a compelling case for the next leg up.

          Injective Sees Explosive Growth in Daily Users Following Nivara and EVM Rollouts

          INj Daily Active Addresses

          Injective price has experienced a dramatic 1,770% surge in daily active addresses—from just 4,500 in early 2025 to a peak of 84,600 on July 19—marking its highest user activity to date.

          This spike coincides with the rollout of the Nivara upgrade and Injective’s EVM testnet, which expands smart contract compatibility and developer tooling.

          The surge signals rising adoption of Injective’s Layer-1 network for DeFi and modular dApp deployment, reinforcing its bullish fundamental momentum.

          INJ USD

          The recent price surge toward $14.2 mirrors this trend, confirming that fundamental momentum is supporting the move.

          INJ Price is also testing its 200-day EMA near $13.6, a critical technical level. If bulls can defend this support, the next upside target sits around $16.5, with a breakout above that potentially opening the door to $19–$20.

          The strong correlation between address activity and price suggests continued upside if usage sustains.

          Risk Warnings and Disclaimers
          You understand and acknowledge that there is a high degree of risk involved in trading. Following any strategies or investment methods may lead to potential losses. The content on the site is provided by our contributors and analysts for information purposes only. You are solely responsible for determining whether any trading assets, securities, strategy, or any other product is suitable for investing based on your own investment objectives and financial situation.
          Add to Favorites
          Share

          Bitcoin miners pivot to HPC: Bitzero raises $25M to expand into high-margin data centers

          Cointelegraph
          1inch / Tether
          -1.13%
          Vaulta / Tether
          -1.17%
          AAVE / Tether
          +1.43%
          Fusionist / Tether
          -2.56%
          Risk Warnings and Disclaimers
          You understand and acknowledge that there is a high degree of risk involved in trading. Following any strategies or investment methods may lead to potential losses. The content on the site is provided by our contributors and analysts for information purposes only. You are solely responsible for determining whether any trading assets, securities, strategy, or any other product is suitable for investing based on your own investment objectives and financial situation.
          Add to Favorites
          Share

          FOMO Frenzy Hits ETH: Is Another Ethereum Rally Brewing as Traders Panic?

          CryptoPotato
          1inch / Tether
          -1.13%
          Vaulta / Tether
          -1.17%
          AAVE / Tether
          +1.43%
          Fusionist / Tether
          -2.56%

          Ethereum (ETH) has surged by more than 50% in the past month, briefly touching $3,850. The recent FOMO-driven volume spike resulted in a 5.8% ETH-BTC movement.

          New data hints at a second bullish wave, even as the leading crypto asset has since retraced its steps and is currently hovering above $3,630.FOMO Spike

          Ethereum’s price ratio against Bitcoin has dropped 5.8% in the past 60 hours. A major FOMO-driven ETH trading volume spike, similar to early May’s pattern, foreshadowed a local top.

          If trading and social volumes continue declining for the rest of the week, Santiment believes it would strongly signal a second bullish wave. Such a trend could arise as retail investors’ impatience and profit-taking behavior set the stage for renewed upside momentum.

          Meanwhile, Ethereum’s spot trading volumes havesurpassedBitcoin’s recently for the first time in over a year, amidst renewed investor interest as altseason gains momentum. Last week, ETH’s spot trading hit $25.7 billion, exceeding Bitcoin’s $24.4 billion. Zooming out, altcoin spot volumes reached $67 billion on July 17, the highest since March, which indicated capital rotation across the crypto market.

          This optimism coincides with a growing appetite among institutional investors seeking direct exposure to ETH through a regulated investment vehicle.Strong Institutional Demand

          One year since US spot Ether ETFs launched, demand for the asset exposure remains strong. Nine ETFs from giants like BlackRock and Fidelity have collectively pulled in $8.65 billion in net inflows, as per SoSoValue data. An unbroken 14-day inflow streak signals confidence in Ethereum’s long-term role within portfolios.

          Institutional interest in Ethereum extends beyond ETFs, with numerous public companies now adding ETH to their treasuries as part of a strategic diversification approach. Firms like SharpLink Gaming, BitMine Immersion Technologies, Bit Digital, Coinbase, BTCS, and GameSquare Holdings have publicly disclosed Ethereum holdings.

          In fact, data shared by CoinGecko revealed that SharpLink holds 360,807 ETH, while BitMine Immersion has accumulated 300,657 ETH. Next up was Coinbase, which maintains a treasury of 137,300 ETH, followed by Bit Digital and BTCS, which hold 120,306 ETH and 55,788 ETH, respectively. GameSquare also has 10,170 ETH.

          Risk Warnings and Disclaimers
          You understand and acknowledge that there is a high degree of risk involved in trading. Following any strategies or investment methods may lead to potential losses. The content on the site is provided by our contributors and analysts for information purposes only. You are solely responsible for determining whether any trading assets, securities, strategy, or any other product is suitable for investing based on your own investment objectives and financial situation.
          Add to Favorites
          Share

          Bitcoin (BTC) Price Prediction for July 24

          U.Today
          1inch / Tether
          -1.13%
          Vaulta / Tether
          -1.17%
          AAVE / Tether
          +1.43%
          Fusionist / Tether
          -2.56%

          The market might have entered a correction phase, according to CoinStats.CoinStats">

          The price of Bitcoin is almost unchanged since yesterday.TradingView">

          On the hourly chart, the rate of BTC is coming back to the local support of $117,465. If bulls cannot seize the initiative, one can expect a test of the $117,000 mark by tomorrow.TradingView">

          On the longer time frame, the situation is rather more bearish than bullish. 

          If the candle closes near the bar low, the accumulated energy might be enough for a test of the $115,226 support level.TradingView">

          From the midterm point of view, the rate of BTC has once again bounced off the resistance of $119,482. If the bar closes far from that mark, one can expect a decline to the nearest level of $112,000.

          Bitcoin is trading at $118,360 at press time.

          Risk Warnings and Disclaimers
          You understand and acknowledge that there is a high degree of risk involved in trading. Following any strategies or investment methods may lead to potential losses. The content on the site is provided by our contributors and analysts for information purposes only. You are solely responsible for determining whether any trading assets, securities, strategy, or any other product is suitable for investing based on your own investment objectives and financial situation.
          Add to Favorites
          Share
          FastBull
          Copyright © 2025 FastBull Ltd

          728 RM B 7/F GEE LOK IND BLDG NO 34 HUNG TO RD KWUN TONG KLN HONG KONG

          TelegramInstagramTwitterfacebooklinkedin
          App Store Google Play Google Play
          Products
          Charts

          Chats

          Q&A with Experts
          Screeners
          Economic Calendar
          Data
          Tools
          Membership
          Features
          Function
          Markets
          Copy Trading
          Latest Signals
          Contests
          News
          Analysis
          24/7
          Columns
          Education
          Company
          Careers
          About Us
          Contact Us
          Advertising
          Help Center
          Feedback
          User Agreement
          Privacy Policy
          Business

          White Label

          Data API

          Web Plug-ins

          Poster Maker

          Affiliate Program

          Risk Disclosure

          The risk of loss in trading financial instruments such as stocks, FX, commodities, futures, bonds, ETFs and crypto can be substantial. You may sustain a total loss of the funds that you deposit with your broker. Therefore, you should carefully consider whether such trading is suitable for you in light of your circumstances and financial resources.

          No decision to invest should be made without thoroughly conducting due diligence by yourself or consulting with your financial advisors. Our web content might not suit you since we don't know your financial conditions and investment needs. Our financial information might have latency or contain inaccuracy, so you should be fully responsible for any of your trading and investment decisions. The company will not be responsible for your capital loss.

          Without getting permission from the website, you are not allowed to copy the website's graphics, texts, or trademarks. Intellectual property rights in the content or data incorporated into this website belong to its providers and exchange merchants.

          Not Logged In

          Log in to access more features

          FastBull Membership

          Not yet

          Purchase

          Become a signal provider
          Help Center
          Customer Service
          Dark Mode
          Price Up/Down Colors

          Log In

          Sign Up

          Position
          Layout
          Fullscreen
          Default to Chart
          The chart page opens by default when you visit fastbull.com