• Trade
  • Markets
  • Copy
  • Contests
  • News
  • 24/7
  • Calendar
  • Q&A
  • Chats
Trending
Screeners
SYMBOL
LAST
BID
ASK
HIGH
LOW
NET CHG.
%CHG.
SPREAD
SPX
S&P 500 Index
6827.42
6827.42
6827.42
6899.86
6801.80
-73.58
-1.07%
--
DJI
Dow Jones Industrial Average
48458.04
48458.04
48458.04
48886.86
48334.10
-245.98
-0.51%
--
IXIC
NASDAQ Composite Index
23195.16
23195.16
23195.16
23554.89
23094.51
-398.69
-1.69%
--
USDX
US Dollar Index
97.890
97.970
97.890
98.070
97.880
-0.060
-0.06%
--
EURUSD
Euro / US Dollar
1.17470
1.17477
1.17470
1.17486
1.17262
+0.00076
+ 0.06%
--
GBPUSD
Pound Sterling / US Dollar
1.33853
1.33862
1.33853
1.33894
1.33546
+0.00146
+ 0.11%
--
XAUUSD
Gold / US Dollar
4340.45
4340.86
4340.45
4350.16
4294.68
+41.06
+ 0.96%
--
WTI
Light Sweet Crude Oil
57.037
57.067
57.037
57.601
57.030
-0.196
-0.34%
--

Community Accounts

Signal Accounts
--
Profit Accounts
--
Loss Accounts
--
View More

Become a signal provider

Sell trading signals to earn additional income

View More

Guide to Copy Trading

Get started with ease and confidence

View More

Signal Accounts for Members

All Signal Accounts

Best Return
  • Best Return
  • Best P/L
  • Best MDD
Past 1W
  • Past 1W
  • Past 1M
  • Past 1Y

All Contests

  • All
  • Trump Updates
  • Recommend
  • Stocks
  • Cryptocurrencies
  • Central Banks
  • Featured News
Top News Only
Share

EU Commission Spokersperson: EU Commission President Set To Travel To Berlin Monday Evening

Share

Brazil Economists See Brazilian Real At 5.40 Per Dollar By Year-End 2025 Versus 5.40 In Previous Estimate - Central Bank Poll

Share

Brazil Economists See Year-End 2026 Interest Rate Selic At 12.13% Versus 12.25% In Previous Estimate - Central Bank Poll

Share

Indonesia Minister: Final Agreement With USA On Tariffs Will Be Signed By Both Leaders And It Likely Would Not Happened This Year

Share

EU Commission Spokesperson: EU Commission Still Expects To Sign EU MERCOSUR Agreement By The End Of The Year

Share

New Czech Finance Minister Schillerova: Aiming For 2026 Budget To Be Approved By Cabinet In Second Half Of January

Share

Capital One Financial-30+ Day Performing Delinquencies Rate For Domestic Credit Card 4.01% At November End

Share

Capital One Financial- November Domestic Credit Card Net Charge-Offs Rate 5.02%

Share

Capital One Financial - November Auto Net Charge-Offs Rate 1.71%

Share

Capital One Financial - 30+ Day Performing Delinquencies Rate For Auto 5.02% At November End

Share

Brazil's Igp-10 Price Index Rises 0.04% In Dec

Share

Ukraine President Zelenskiy Will Meet Dutch Prime Minister Schoof And Dutch King In The Hague On Tuesday

Share

Pakistan Central Bank: Cuts Key Rate By 50 Bps To 10.50%

Share

German Government Spokesperson: Russian Central Bank Lawsuit Has No Impact On EU Plans To Use Frozen Russian State Assets For Ukraine

Share

German Government Spokesperson: United States Is Also Invited To This Evening's Talks Between The Europeans And Ukraine President Zelenskiy

Share

EU Official: EU Foreign Ministers Adopt Sanctions Targeting 14 Persons, Entities Under Russia Hybrid Threats Regime

Share

Polish Zloty Firms To 4.2175 Versus Euro, Strongest Since Early April

Share

China Npc Standing Committee Meeting To Review Draft Revision To Foreign Trade Law

Share

China Npc Standing Committee To Hold Meeting Dec 22-27

Share

The European Council Stated That, In Light Of Recent Mixed Activities And Threats Against Member States, It Has Expanded The List Of Individuals And Entities That Support Or Benefit From Actions Linked To The Belarusian Government

TIME
ACT
FCST
PREV
China, Mainland M1 Money Supply YoY (Nov)

A:--

F: --

P: --

India CPI YoY (Nov)

A:--

F: --

P: --

India Deposit Gowth YoY

A:--

F: --

P: --

Brazil Services Growth YoY (Oct)

A:--

F: --

P: --

Mexico Industrial Output YoY (Oct)

A:--

F: --

P: --

Russia Trade Balance (Oct)

A:--

F: --

P: --

Philadelphia Fed President Henry Paulson delivers a speech
Canada Building Permits MoM (SA) (Oct)

A:--

F: --

P: --

Canada Wholesale Sales YoY (Oct)

A:--

F: --

P: --

Canada Wholesale Inventory MoM (Oct)

A:--

F: --

P: --

Canada Wholesale Inventory YoY (Oct)

A:--

F: --

P: --

Canada Wholesale Sales MoM (SA) (Oct)

A:--

F: --

P: --

Germany Current Account (Not SA) (Oct)

A:--

F: --

P: --

U.S. Weekly Total Rig Count

A:--

F: --

P: --

U.S. Weekly Total Oil Rig Count

A:--

F: --

P: --

Japan Tankan Small Manufacturing Outlook Index (Q4)

A:--

F: --

P: --

Japan Tankan Large Non-Manufacturing Diffusion Index (Q4)

A:--

F: --

P: --

Japan Tankan Large Non-Manufacturing Outlook Index (Q4)

A:--

F: --

P: --

Japan Tankan Large Manufacturing Outlook Index (Q4)

A:--

F: --

P: --

Japan Tankan Small Manufacturing Diffusion Index (Q4)

A:--

F: --

P: --

Japan Tankan Large Manufacturing Diffusion Index (Q4)

A:--

F: --

P: --

Japan Tankan Large-Enterprise Capital Expenditure YoY (Q4)

A:--

F: --

P: --

U.K. Rightmove House Price Index YoY (Dec)

A:--

F: --

P: --

China, Mainland Industrial Output YoY (YTD) (Nov)

A:--

F: --

P: --

China, Mainland Urban Area Unemployment Rate (Nov)

A:--

F: --

P: --

Saudi Arabia CPI YoY (Nov)

A:--

F: --

P: --

Euro Zone Industrial Output YoY (Oct)

A:--

F: --

P: --

Euro Zone Industrial Output MoM (Oct)

A:--

F: --

P: --

Canada Existing Home Sales MoM (Nov)

A:--

F: --

P: --

U.K. Inflation Rate Expectations

--

F: --

P: --

Euro Zone Total Reserve Assets (Nov)

--

F: --

P: --

Canada National Economic Confidence Index

--

F: --

P: --

Canada New Housing Starts (Nov)

--

F: --

P: --

U.S. NY Fed Manufacturing Employment Index (Dec)

--

F: --

P: --

U.S. NY Fed Manufacturing Index (Dec)

--

F: --

P: --

Canada Core CPI YoY (Nov)

--

F: --

P: --

Canada Manufacturing Unfilled Orders MoM (Oct)

--

F: --

P: --

U.S. NY Fed Manufacturing Prices Received Index (Dec)

--

F: --

P: --

U.S. NY Fed Manufacturing New Orders Index (Dec)

--

F: --

P: --

Canada Manufacturing New Orders MoM (Oct)

--

F: --

P: --

Canada Core CPI MoM (Nov)

--

F: --

P: --

Canada Trimmed CPI YoY (SA) (Nov)

--

F: --

P: --

Canada Manufacturing Inventory MoM (Oct)

--

F: --

P: --

Canada CPI YoY (Nov)

--

F: --

P: --

Canada CPI MoM (Nov)

--

F: --

P: --

Canada CPI YoY (SA) (Nov)

--

F: --

P: --

Canada Core CPI MoM (SA) (Nov)

--

F: --

P: --

Canada CPI MoM (SA) (Nov)

--

F: --

P: --

Federal Reserve Board Governor Milan delivered a speech
U.S. NAHB Housing Market Index (Dec)

--

F: --

P: --

Australia Composite PMI Prelim (Dec)

--

F: --

P: --

Australia Services PMI Prelim (Dec)

--

F: --

P: --

Australia Manufacturing PMI Prelim (Dec)

--

F: --

P: --

Japan Manufacturing PMI Prelim (SA) (Dec)

--

F: --

P: --

U.K. 3-Month ILO Employment Change (Oct)

--

F: --

P: --

U.K. Unemployment Claimant Count (Nov)

--

F: --

P: --

U.K. Unemployment Rate (Nov)

--

F: --

P: --

U.K. 3-Month ILO Unemployment Rate (Oct)

--

F: --

P: --

U.K. Average Weekly Earnings (3-Month Average, Including Bonuses) YoY (Oct)

--

F: --

P: --

U.K. Average Weekly Earnings (3-Month Average, Excluding Bonuses) YoY (Oct)

--

F: --

P: --

Q&A with Experts
    • All
    • Chatrooms
    • Groups
    • Friends
    Connecting
    .
    .
    .
    Type here...
    Add Symbol or Code

      No matching data

      All
      Trump Updates
      Recommend
      Stocks
      Cryptocurrencies
      Central Banks
      Featured News
      • All
      • Russia-Ukraine Conflict
      • Middle East Flashpoint
      • All
      • Russia-Ukraine Conflict
      • Middle East Flashpoint
      Search
      Products

      Charts Free Forever

      Chats Q&A with Experts
      Screeners Economic Calendar Data Tools
      Membership Features
      Data Warehouse Market Trends Institutional Data Policy Rates Macro

      Market Trends

      Market Sentiment Order Book Forex Correlations

      Top Indicators

      Charts Free Forever
      Markets

      News

      News Analysis 24/7 Columns Education
      From Institutions From Analysts
      Topics Columnists

      Latest Views

      Latest Views

      Trending Topics

      Top Columnists

      Latest Update

      Signals

      Copy Rankings Latest Signals Become a signal provider AI Rating
      Contests
      Brokers

      Overview Brokers Assessment Rankings Regulators News Claims
      Broker listing Forex Brokers Comparison Tool Live Spread Comparison Scam
      Q&A Complaint Scam Alert Videos Tips to Detect Scam
      More

      Business
      Events
      Careers About Us Advertising Help Center

      White Label

      Data API

      Web Plug-ins

      Affiliate Program

      Awards Institution Evaluation IB Seminar Salon Event Exhibition
      Vietnam Thailand Singapore Dubai
      Fans Party Investment Sharing Session
      FastBull Summit BrokersView Expo
      Recent Searches
        Top Searches
          Markets
          News
          Analysis
          User
          24/7
          Economic Calendar
          Education
          Data
          • Names
          • Latest
          • Prev

          View All

          No data

          Scan to Download

          Faster Charts, Chat Faster!

          Download App
          English
          • English
          • Español
          • العربية
          • Bahasa Indonesia
          • Bahasa Melayu
          • Tiếng Việt
          • ภาษาไทย
          • Français
          • Italiano
          • Türkçe
          • Русский язык
          • 简中
          • 繁中
          Open Account
          Search
          Products
          Charts Free Forever
          Markets
          News
          Signals

          Copy Rankings Latest Signals Become a signal provider AI Rating
          Contests
          Brokers

          Overview Brokers Assessment Rankings Regulators News Claims
          Broker listing Forex Brokers Comparison Tool Live Spread Comparison Scam
          Q&A Complaint Scam Alert Videos Tips to Detect Scam
          More

          Business
          Events
          Careers About Us Advertising Help Center

          White Label

          Data API

          Web Plug-ins

          Affiliate Program

          Awards Institution Evaluation IB Seminar Salon Event Exhibition
          Vietnam Thailand Singapore Dubai
          Fans Party Investment Sharing Session
          FastBull Summit BrokersView Expo

          3 Volatile Stocks with Mounting Challenges

          Stock Story
          Sweetgreen
          +0.97%
          Red Robin
          -0.50%
          Wells Fargo & Co.
          +0.18%

          SG Cover Image

          A highly volatile stock can deliver big gains - or just as easily wipe out a portfolio if things go south. While some investors embrace risk, mistakes can be costly for those who aren’t prepared.

          At StockStory, our job is to help you avoid costly mistakes and stay on the right side of the trade. Keeping that in mind, here are three volatile stocks best left to the gamblers and some better opportunities instead.

          Sweetgreen (SG)

          Rolling One-Year Beta: 1.60

          Founded in 2007 by three Georgetown University alum, Sweetgreen is a casual quick service chain known for its healthy salads and bowls.

          Why Does SG Give Us Pause?

          • Historical operating margin losses point to an inefficient cost structure
          • Cash-burning history makes us doubt the long-term viability of its business model
          • Depletion of cash reserves could lead to a fundraising event that triggers shareholder dilution

          Sweetgreen’s stock price of $12.25 implies a valuation ratio of 35.8x forward EV-to-EBITDA. Check out our free in-depth research report to learn more about why SG doesn’t pass our bar.

          Red Robin (RRGB)

          Rolling One-Year Beta: 1.48

          Known for its bottomless steak fries, Red Robin is a chain of casual restaurants specializing in burgers and general American fare.

          Why Do We Steer Clear of RRGB?

          • Lagging same-store sales over the past two years suggest it might have to change its pricing and marketing strategy to stimulate demand
          • Earnings per share fell by 25.5% annually over the last six years while its revenue was flat, showing each sale was less profitable
          • 10× net-debt-to-EBITDA ratio makes lenders less willing to extend additional capital, potentially necessitating dilutive equity offerings

          Red Robin is trading at $5.09 per share, or 1.5x forward EV-to-EBITDA. To fully understand why you should be careful with RRGB, check out our full research report (it’s free).

          Wells Fargo (WFC)

          Rolling One-Year Beta: 1.18

          Founded during the California Gold Rush in 1852 to provide banking and express delivery services to miners and merchants, Wells Fargo is a diversified financial services company that provides banking, lending, investment, and wealth management services to individuals and businesses.

          Why Are We Wary of WFC?

          • Large revenue base makes it harder to expand quickly, and its annual net interest income growth of 5.8% over the last four years was below our standards for the bank sector
          • Net interest margin of 2.8% is well below other banks, signaling its loans aren’t very profitable
          • High interest payments compared to its earnings raise concerns about its ability to service its debt consistently

          At $74.74 per share, Wells Fargo trades at 1.4x forward P/B. Dive into our free research report to see why there are better opportunities than WFC.

          High-Quality Stocks for All Market Conditions

          The market surged in 2024 and reached record highs after Donald Trump’s presidential victory in November, but questions about new economic policies are adding much uncertainty for 2025.

          While the crowd speculates what might happen next, we’re homing in on the companies that can succeed regardless of the political or macroeconomic environment. Put yourself in the driver’s seat and build a durable portfolio by checking out our Top 6 Stocks for this week. This is a curated list of our High Quality stocks that have generated a market-beating return of 183% over the last five years (as of March 31st 2025).

          Stocks that made our list in 2020 include now familiar names such as Nvidia (+1,545% between March 2020 and March 2025) as well as under-the-radar businesses like the once-micro-cap company Tecnoglass (+1,754% five-year return).

          Risk Warnings and Disclaimers
          You understand and acknowledge that there is a high degree of risk involved in trading. Following any strategies or investment methods may lead to potential losses. The content on the site is provided by our contributors and analysts for information purposes only. You are solely responsible for determining whether any trading assets, securities, strategy, or any other product is suitable for investing based on your own investment objectives and financial situation.
          Add to Favorites
          Share

          Wells Fargo (WFC): Buy, Sell, or Hold Post Q1 Earnings?

          Stock Story
          Wells Fargo & Co.
          +0.18%

          WFC Cover Image

          Since June 2020, the S&P 500 has delivered a total return of 93.6%. But one standout stock has nearly doubled the market - over the past five years, Wells Fargo has surged 171% to $74.74 per share. Its momentum hasn’t stopped as it’s also gained 8.6% in the last six months, beating the S&P by 6.6%.

          Is there a buying opportunity in Wells Fargo, or does it present a risk to your portfolio? See what our analysts have to say in our full research report, it’s free.

          Why Is Wells Fargo Not Exciting?

          Despite the momentum, we don't have much confidence in Wells Fargo. Here are three reasons why WFC doesn't excite us and a stock we'd rather own.

          1. Net Interest Income Points to Soft Demand

          While banks generate revenue from multiple sources, investors view net interest income as the cornerstone - its predictable, recurring characteristics stand in sharp contrast to the volatility of non-interest income.

          Wells Fargo’s net interest income has grown at a 5.8% annualized rate over the last four years, worse than the broader bank industry. Its growth was driven by an increase in its net interest margin, which represents how much a bank earns in relation to its outstanding loans, as its loan book shrank throughout that period.

          Wells Fargo Quarterly Net Interest Income

          2. Low Net Interest Margin Reveals Weak Loan Book Profitability

          Net interest margin represents how much a bank earns in relation to its outstanding loans. It’s one of the most important metrics to track because it shows how a bank’s loans are performing and whether it has the ability to command higher premiums for its services.

          Over the past two years, we can see that Wells Fargo’s net interest margin averaged a weak 2.8%, indicating the company has weak loan book economics.

          Wells Fargo Trailing 12-Month Net Interest Margin

          3. High Interest Expenses Increase Risk

          Leverage is core to the bank’s business model (loans funded by deposits) and to ensure their stability, regulators require certain levels of capital and liquidity, focusing on a bank’s Tier 1 capital ratio.

          Tier 1 capital is the highest-quality capital that a bank holds, consisting primarily of common stock and retained earnings, but also physical gold. It serves as the primary cushion against losses and is the first line of defense in times of financial distress.

          This capital is divided by risk-weighted assets to derive the Tier 1 capital ratio. Risk-weighted means that cash and US treasury securities are assigned little risk while unsecured consumer loans and equity investments get much higher risk weights, for example.

          New regulation after the 2008 financial crisis requires that all banks must maintain a Tier 1 capital ratio greater than 4.5% On top of this, there are additional buffers based on scale, risk profile, and other regulatory classifications, so that at the end of the day, banks generally must maintain a 7-10% ratio at minimum.

          Over the last two years, Wells Fargo has averaged a Tier 1 capital ratio of 12.6%, which is considered unsafe in the event of a black swan or if macro or market conditions suddenly deteriorate. For this reason alone, we will be crossing it off our shopping list.

          Final Judgment

          Wells Fargo isn’t a terrible business, but it doesn’t pass our bar. With its shares beating the market recently, the stock trades at 1.4× forward P/B (or $74.74 per share). This valuation tells us a lot of optimism is priced in - we think other companies feature superior fundamentals at the moment. Let us point you toward our favorite semiconductor picks and shovels play.

          High-Quality Stocks for All Market Conditions

          The market surged in 2024 and reached record highs after Donald Trump’s presidential victory in November, but questions about new economic policies are adding much uncertainty for 2025.

          While the crowd speculates what might happen next, we’re homing in on the companies that can succeed regardless of the political or macroeconomic environment. Put yourself in the driver’s seat and build a durable portfolio by checking out our Top 5 Growth Stocks for this month. This is a curated list of our High Quality stocks that have generated a market-beating return of 183% over the last five years (as of March 31st 2025).

          Stocks that made our list in 2020 include now familiar names such as Nvidia (+1,545% between March 2020 and March 2025) as well as under-the-radar businesses like the once-micro-cap company Kadant (+351% five-year return).

          Risk Warnings and Disclaimers
          You understand and acknowledge that there is a high degree of risk involved in trading. Following any strategies or investment methods may lead to potential losses. The content on the site is provided by our contributors and analysts for information purposes only. You are solely responsible for determining whether any trading assets, securities, strategy, or any other product is suitable for investing based on your own investment objectives and financial situation.
          Add to Favorites
          Share

          Press Release: I2I Logic Partners With Wells Fargo To Provide Personalized Digital Services For Commercial Banking Clients

          Reuters
          Wells Fargo & Co.
          +0.18%
          Risk Warnings and Disclaimers
          You understand and acknowledge that there is a high degree of risk involved in trading. Following any strategies or investment methods may lead to potential losses. The content on the site is provided by our contributors and analysts for information purposes only. You are solely responsible for determining whether any trading assets, securities, strategy, or any other product is suitable for investing based on your own investment objectives and financial situation.
          Add to Favorites
          Share

          Dj Wells Fargo & Corporate Stock Rises 3.1%, Outperforms Competitors

          Reuters
          U.S. Bancorp
          -0.30%
          Wells Fargo & Co.
          +0.18%
          Risk Warnings and Disclaimers
          You understand and acknowledge that there is a high degree of risk involved in trading. Following any strategies or investment methods may lead to potential losses. The content on the site is provided by our contributors and analysts for information purposes only. You are solely responsible for determining whether any trading assets, securities, strategy, or any other product is suitable for investing based on your own investment objectives and financial situation.
          Add to Favorites
          Share

          Dj Avoiding Seed Oils? Here, The Best Alternatives To Buy

          Reuters
          Sweetgreen
          +0.97%
          Risk Warnings and Disclaimers
          You understand and acknowledge that there is a high degree of risk involved in trading. Following any strategies or investment methods may lead to potential losses. The content on the site is provided by our contributors and analysts for information purposes only. You are solely responsible for determining whether any trading assets, securities, strategy, or any other product is suitable for investing based on your own investment objectives and financial situation.
          Add to Favorites
          Share

          Visa, Mastercard Lead Market Cap Stock Movers on Wednesday

          Investing.com
          Coinbase
          -0.58%
          ServiceNow
          -0.28%
          Credo Technology
          -6.84%
          L
          LZ Technology Holdings Limited Class B Ordinary Shares
          0.00%
          Arqit Quantum
          -4.55%

          Wednesday’s market has seen notable movements in various stocks, particularly in the mega-cap and large-cap categories. Stocks like Visa Inc (NYSE:V) and Mastercard Cl A (NYSE:MA) experienced declines, while Circle Internet Group Inc (CRCL) surged. Here are the highlights of some of the most significant stock movers across market cap ranges, reflecting intra-day stock performance.

          Mega-Cap Movers (Market Cap $200B+):

          • Mastercard Cl A (MA): -3.65%
          • Visa Inc (V): -3.14%
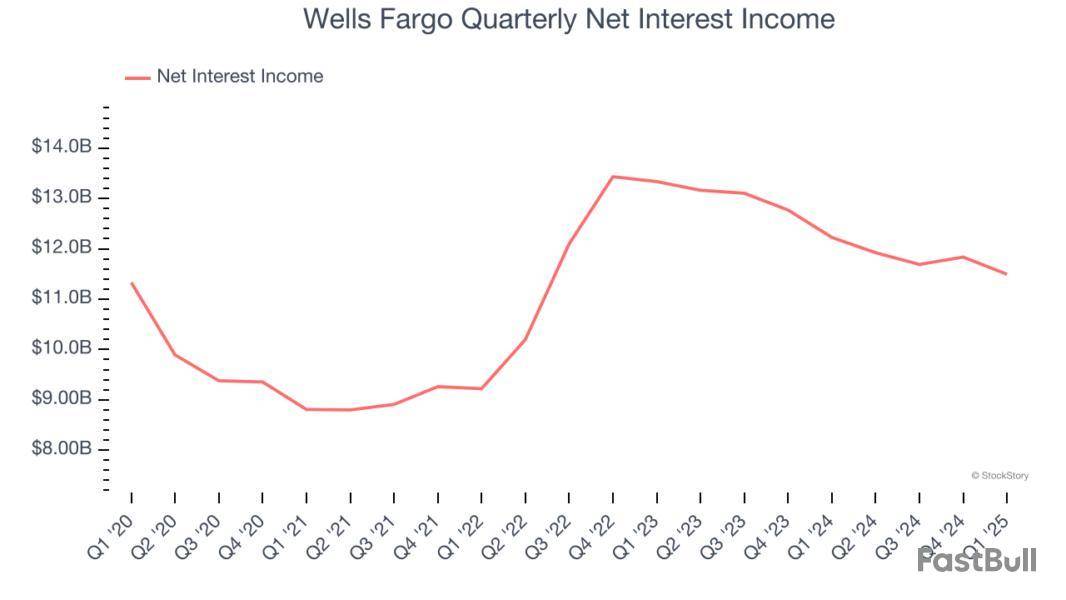
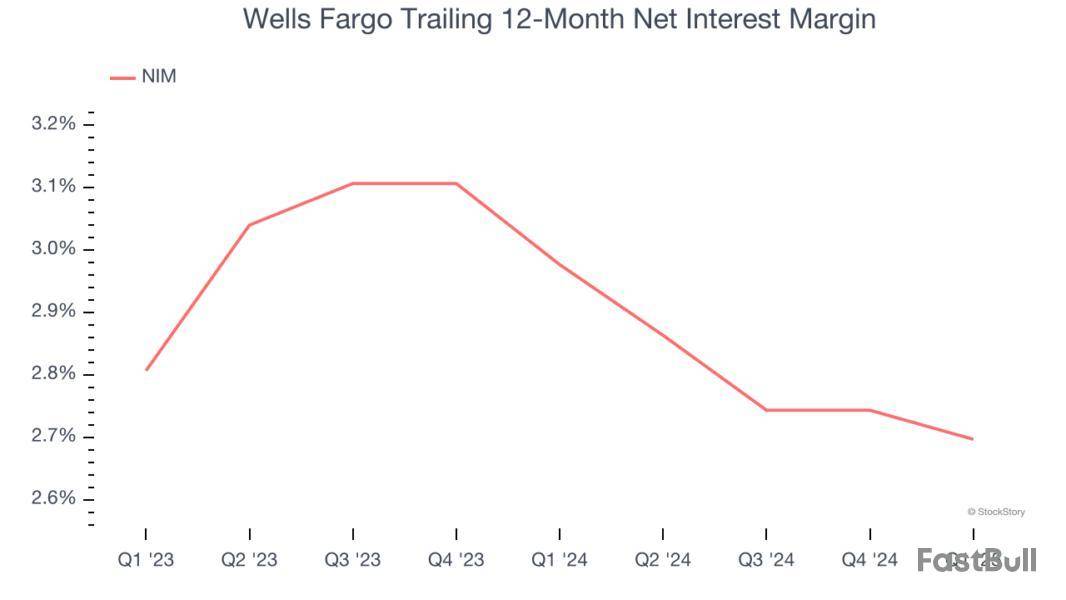
          • Wells Fargo (WFC): +2.98%
          • Servicenow Inc (NYSE:NOW); NowVertical Group to Participate in Bristol Capital Hosted Webinar to Showcase Business Overview: -1.83%

          Large-Cap Stock Movers (Market Cap $10B-$200B):

          • Regencell Bioscience Holdings (RGC): -23.07%
          • Circle Internet Group Inc (CRCL): +21.72%
          • Silversun Tech (QXO); William Blair initiates QXO stock with outperform on acquisition strategy: +14.76%
          • Coinbase Global (NASDAQ:COIN): +14.99%
          • Chime Financial (CHYM): -7.04%
          • Credo Technology Holding (CRDO): +6.85%
          • Ctrip.com International (NASDAQ:TCOM): -6.35%
          • Marvell Technology Group Ltd (NASDAQ:MRVL); Empower Semiconductor partners with Marvell for AI power solutions: +6.97%
          • World Wrestling Entertainment (NYSE:TKO): +5.49%
          • Sharkninja (SN): +5.28%

          Mid-Cap Stock Movers (Market Cap $2B-$10B):

          • LZ Tech Holdings (LZMH): +38.1%
          • SVF Investment 3 (SYM): +18.95%
          • Oscar Health (OSCR): +18.37%
          • Genworth Finl (NYSE:GNW): +14.11%
          • Scholar Rock Holding Corp (NASDAQ:SRRK); Scholar Rock’s apitegromab preserves lean mass during weight loss: +15.38%
          • New Providence Acquisition Corp N (ASTS); Vi and AST SpaceMobile partner to expand satellite connectivity in India: +10.39%
          • GMS Inc (NYSE:GMS); GMS reports mixed Q4 results amid soft end market conditions: +10.53%
          • Upstart Holdings Inc (NASDAQ:UPST): +10.51%
          • Valeant Pharma (NYSE:BHC): +8.81%
          • Blue Safari Group Acquisition Corp (BTDR); Bitdeer announces $300 million convertible notes offering: -7.09%

          Small-Cap Stock Movers (Market Cap $300M-$2B):

          • CONL (CONL): +29.81%
          • Guild Holdings Co (GHLD); Bayview to acquire Guild Holdings for $1.3 billion in all-cash deal: +25.7%
          • Sustainable Opportunities Acqui (TMC): +26.93%
          • SS Innovations International (SSII): +27.19%
          • Jyong Biotech (MENS): -17.41%
          • Slide Insurance Holdings (SLDE): +16.53%
          • Anbio Biotechnology (NNNN): +15.82%
          • Centricus Acquisition (ARQQ): +20.89%
          • Gogo Inc (NASDAQ:GOGO): +16.6%
          • MER Telemanagemen (SBET): -13.62%

          For real-time, market-moving news join Investing Pro.

          This article was generated with the support of AI and reviewed by an editor. For more information see our T&C.

          Risk Warnings and Disclaimers
          You understand and acknowledge that there is a high degree of risk involved in trading. Following any strategies or investment methods may lead to potential losses. The content on the site is provided by our contributors and analysts for information purposes only. You are solely responsible for determining whether any trading assets, securities, strategy, or any other product is suitable for investing based on your own investment objectives and financial situation.
          Add to Favorites
          Share

          Dj Wells Fargo Price Target Raised To $84.00/Share From $78.00 By Raymond James

          Reuters
          Wells Fargo & Co.
          +0.18%
          Risk Warnings and Disclaimers
          You understand and acknowledge that there is a high degree of risk involved in trading. Following any strategies or investment methods may lead to potential losses. The content on the site is provided by our contributors and analysts for information purposes only. You are solely responsible for determining whether any trading assets, securities, strategy, or any other product is suitable for investing based on your own investment objectives and financial situation.
          Add to Favorites
          Share
          FastBull
          Copyright © 2025 FastBull Ltd

          728 RM B 7/F GEE LOK IND BLDG NO 34 HUNG TO RD KWUN TONG KLN HONG KONG

          TelegramInstagramTwitterfacebooklinkedin
          App Store Google Play Google Play
          Products
          Charts

          Chats

          Q&A with Experts
          Screeners
          Economic Calendar
          Data
          Tools
          Membership
          Features
          Function
          Markets
          Copy Trading
          Latest Signals
          Contests
          News
          Analysis
          24/7
          Columns
          Education
          Company
          Careers
          About Us
          Contact Us
          Advertising
          Help Center
          Feedback
          User Agreement
          Privacy Policy
          Business

          White Label

          Data API

          Web Plug-ins

          Poster Maker

          Affiliate Program

          Risk Disclosure

          The risk of loss in trading financial instruments such as stocks, FX, commodities, futures, bonds, ETFs and crypto can be substantial. You may sustain a total loss of the funds that you deposit with your broker. Therefore, you should carefully consider whether such trading is suitable for you in light of your circumstances and financial resources.

          No decision to invest should be made without thoroughly conducting due diligence by yourself or consulting with your financial advisors. Our web content might not suit you since we don't know your financial conditions and investment needs. Our financial information might have latency or contain inaccuracy, so you should be fully responsible for any of your trading and investment decisions. The company will not be responsible for your capital loss.

          Without getting permission from the website, you are not allowed to copy the website's graphics, texts, or trademarks. Intellectual property rights in the content or data incorporated into this website belong to its providers and exchange merchants.

          Not Logged In

          Log in to access more features

          FastBull Membership

          Not yet

          Purchase

          Become a signal provider
          Help Center
          Customer Service
          Dark Mode
          Price Up/Down Colors

          Log In

          Sign Up

          Position
          Layout
          Fullscreen
          Default to Chart
          The chart page opens by default when you visit fastbull.com