Markets
News
Analysis
User
24/7
Economic Calendar
Education
Data
- Names
- Latest
- Prev


Signal Accounts for Members
All Signal Accounts
All Contests


U.K. Trade Balance (Oct)A:--
F: --
P: --
France HICP Final MoM (Nov)A:--
F: --
P: --
China, Mainland Outstanding Loans Growth YoY (Nov)A:--
F: --
P: --
China, Mainland M2 Money Supply YoY (Nov)A:--
F: --
P: --
China, Mainland M0 Money Supply YoY (Nov)A:--
F: --
P: --
China, Mainland M1 Money Supply YoY (Nov)A:--
F: --
P: --
India CPI YoY (Nov)A:--
F: --
P: --
India Deposit Gowth YoYA:--
F: --
P: --
Brazil Services Growth YoY (Oct)A:--
F: --
P: --
Mexico Industrial Output YoY (Oct)A:--
F: --
P: --
Russia Trade Balance (Oct)A:--
F: --
P: --
Philadelphia Fed President Henry Paulson delivers a speech
Canada Building Permits MoM (SA) (Oct)A:--
F: --
P: --
Canada Wholesale Sales YoY (Oct)A:--
F: --
P: --
Canada Wholesale Inventory MoM (Oct)A:--
F: --
P: --
Canada Wholesale Inventory YoY (Oct)A:--
F: --
P: --
Canada Wholesale Sales MoM (SA) (Oct)A:--
F: --
P: --
Germany Current Account (Not SA) (Oct)A:--
F: --
P: --
U.S. Weekly Total Rig CountA:--
F: --
P: --
U.S. Weekly Total Oil Rig CountA:--
F: --
P: --
Japan Tankan Small Manufacturing Outlook Index (Q4)A:--
F: --
P: --
Japan Tankan Large Non-Manufacturing Diffusion Index (Q4)A:--
F: --
P: --
Japan Tankan Large Non-Manufacturing Outlook Index (Q4)A:--
F: --
P: --
Japan Tankan Large Manufacturing Outlook Index (Q4)A:--
F: --
P: --
Japan Tankan Small Manufacturing Diffusion Index (Q4)A:--
F: --
P: --
Japan Tankan Large Manufacturing Diffusion Index (Q4)A:--
F: --
P: --
Japan Tankan Large-Enterprise Capital Expenditure YoY (Q4)A:--
F: --
P: --
U.K. Rightmove House Price Index YoY (Dec)A:--
F: --
P: --
China, Mainland Industrial Output YoY (YTD) (Nov)A:--
F: --
P: --
China, Mainland Urban Area Unemployment Rate (Nov)A:--
F: --
P: --
Saudi Arabia CPI YoY (Nov)--
F: --
P: --
Euro Zone Industrial Output YoY (Oct)--
F: --
P: --
Euro Zone Industrial Output MoM (Oct)--
F: --
P: --
Canada Existing Home Sales MoM (Nov)--
F: --
P: --
Euro Zone Total Reserve Assets (Nov)--
F: --
P: --
U.K. Inflation Rate Expectations--
F: --
P: --
Canada National Economic Confidence Index--
F: --
P: --
Canada New Housing Starts (Nov)--
F: --
P: --
U.S. NY Fed Manufacturing Employment Index (Dec)--
F: --
P: --
U.S. NY Fed Manufacturing Index (Dec)--
F: --
P: --
Canada Core CPI YoY (Nov)--
F: --
P: --
Canada Manufacturing Unfilled Orders MoM (Oct)--
F: --
P: --
U.S. NY Fed Manufacturing Prices Received Index (Dec)--
F: --
P: --
U.S. NY Fed Manufacturing New Orders Index (Dec)--
F: --
P: --
Canada Manufacturing New Orders MoM (Oct)--
F: --
P: --
Canada Core CPI MoM (Nov)--
F: --
P: --
Canada Trimmed CPI YoY (SA) (Nov)--
F: --
P: --
Canada Manufacturing Inventory MoM (Oct)--
F: --
P: --
Canada CPI YoY (Nov)--
F: --
P: --
Canada CPI MoM (Nov)--
F: --
P: --
Canada CPI YoY (SA) (Nov)--
F: --
P: --
Canada Core CPI MoM (SA) (Nov)--
F: --
P: --
Canada CPI MoM (SA) (Nov)--
F: --
P: --
Federal Reserve Board Governor Milan delivered a speech
U.S. NAHB Housing Market Index (Dec)--
F: --
P: --
Australia Composite PMI Prelim (Dec)--
F: --
P: --
Australia Services PMI Prelim (Dec)--
F: --
P: --
Australia Manufacturing PMI Prelim (Dec)--
F: --
P: --
Japan Manufacturing PMI Prelim (SA) (Dec)--
F: --
P: --
U.K. Unemployment Rate (Nov)--
F: --
P: --
U.K. 3-Month ILO Unemployment Rate (Oct)--
F: --
P: --


No matching data
Latest Views
Latest Views
Trending Topics
Top Columnists
Latest Update
White Label
Data API
Web Plug-ins
Affiliate Program
View All

No data
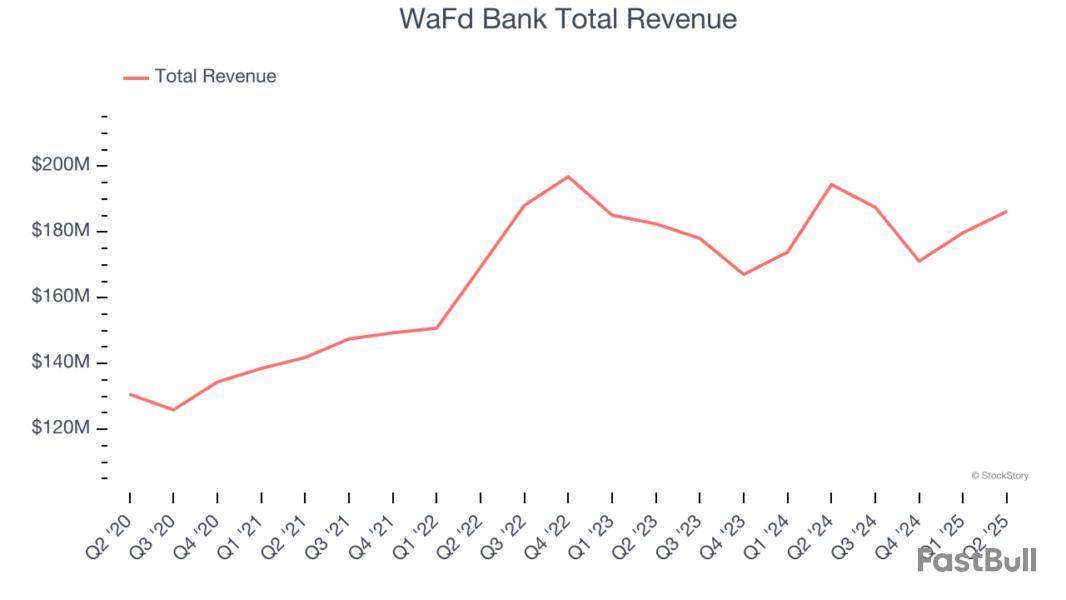
WaFd Bank has followed the market’s trajectory closely, rising in tandem with the S&P 500 over the past six months. The stock has climbed by 13.8% to $31.55 per share while the index has gained 17.7%.
Is there a buying opportunity in WaFd Bank, or does it present a risk to your portfolio? Get the full breakdown from our expert analysts, it’s free.
Why Is WaFd Bank Not Exciting?
We're cautious about WaFd Bank. Here are three reasons there are better opportunities than WAFD and a stock we'd rather own.
1. Net Interest Income Points to Soft Demand
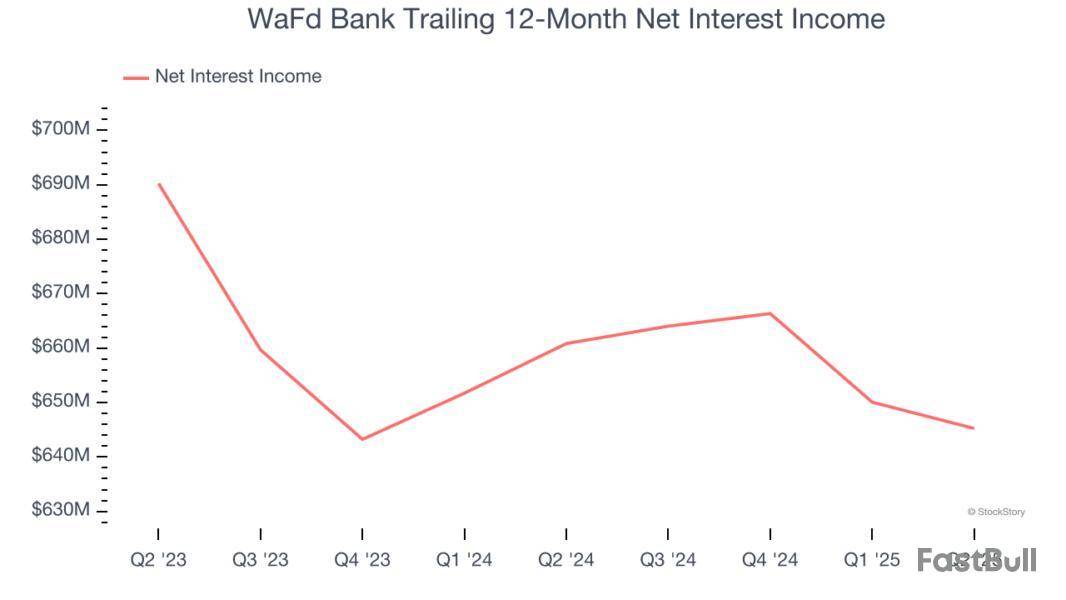
Net interest income commands greater market attention due to its reliability and consistency, whereas one-time fees are often seen as lower-quality revenue that lacks the same dependable characteristics.
WaFd Bank’s net interest income has grown at a 7% annualized rate over the last five years, slightly worse than the broader banking industry and in line with its total revenue.
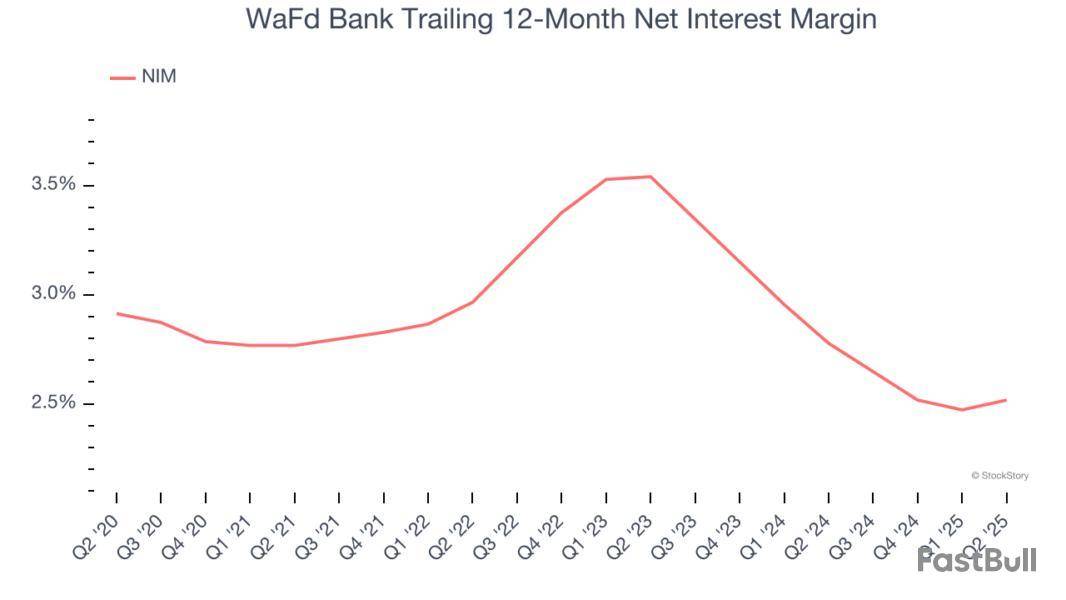
2. Net Interest Margin Dropping
Net interest margin (NIM) represents how much a bank earns in relation to its outstanding loans. It's one of the most important metrics to track because it shows how a bank's loans are performing and whether it has the ability to command higher premiums for its services.
Over the past two years, WaFd Bank’s net interest margin averaged 2.6%. Its margin also contracted from 3.5% to 2.5% over that period.
This decline was a headwind for its net interest income. While prevailing rates are a major determinant of net interest margin changes over time, the decline could mean that WaFd Bank either faced competition for loans and deposits or experienced a negative mix shift in its balance sheet composition.
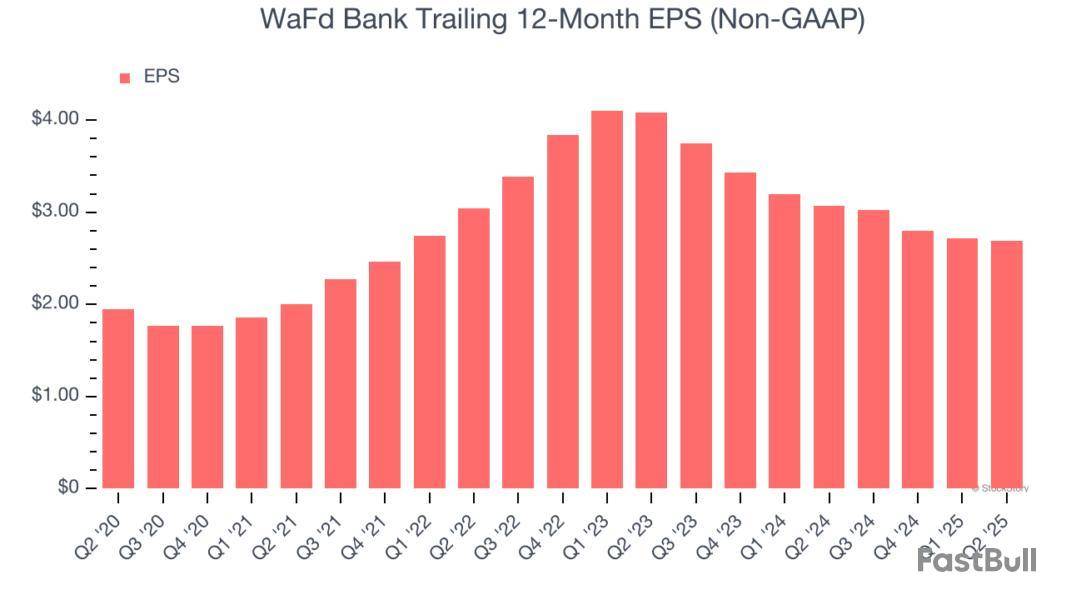
3. EPS Took a Dip Over the Last Two Years
While long-term earnings trends give us the big picture, we also track EPS over a shorter period because it can provide insight into an emerging theme or development for the business.
Sadly for WaFd Bank, its EPS declined by more than its revenue over the last two years, dropping 18.8%. This tells us the company struggled to adjust to shrinking demand.
Final Judgment
WaFd Bank isn’t a terrible business, but it doesn’t pass our bar. That said, the stock currently trades at 0.9× forward P/B (or $31.55 per share). Beauty is in the eye of the beholder, but our analysis shows the upside isn’t great compared to the potential downside. We're fairly confident there are better investments elsewhere. Let us point you toward the most dominant software business in the world.
High-Quality Stocks for All Market Conditions
When Trump unveiled his aggressive tariff plan in April 2025, markets tanked as investors feared a full-blown trade war. But those who panicked and sold missed the subsequent rebound that’s already erased most losses.
Don’t let fear keep you from great opportunities and take a look at Top 6 Stocks for this week. This is a curated list of our High Quality stocks that have generated a market-beating return of 183% over the last five years (as of March 31st 2025).
Stocks that made our list in 2020 include now familiar names such as Nvidia (+1,545% between March 2020 and March 2025) as well as under-the-radar businesses like the once-micro-cap company Tecnoglass (+1,754% five-year return).
StockStory is growing and hiring equity analyst and marketing roles. Are you a 0 to 1 builder passionate about the markets and AI? See the open roles here.
Investors looking for hidden gems should keep an eye on small-cap stocks because they’re frequently overlooked by Wall Street. Many opportunities exist in this part of the market, but it is also a high-risk, high-reward environment due to the lack of reliable analyst price targets.
Luckily for you, our mission at StockStory is to help you make money and avoid losses by sorting the winners from the losers. Keeping that in mind, here are three small-cap stocks to avoid and some other investments you should consider instead.
Cathay General Bancorp (CATY)
Market Cap: $3.45 billion
Founded in 1962 with its first branch in Los Angeles' Chinatown, Cathay General Bancorp operates Cathay Bank, providing commercial banking services to businesses and individuals with a strong presence in Asian-American communities.
Why Do We Think Twice About CATY?
Cathay General Bancorp is trading at $49.91 per share, or 1.2x forward P/B. Dive into our free research report to see why there are better opportunities than CATY.
Hercules Capital (HTGC)
Market Cap: $3.50 billion
Named after the mythological hero known for his strength, Hercules Capital is a business development company that provides debt financing to venture capital-backed and growth-stage technology and life sciences companies.
Why Does HTGC Give Us Pause?
Hercules Capital’s stock price of $19.53 implies a valuation ratio of 9.7x forward P/E. Check out our free in-depth research report to learn more about why HTGC doesn’t pass our bar.
WaFd Bank (WAFD)
Market Cap: $2.48 billion
Founded in 1917 and rebranded from Washington Federal in 2023, WaFd is a bank holding company that provides lending, deposit services, and insurance through its Washington Federal Bank subsidiary across eight western states.
Why Are We Wary of WAFD?
At $31.45 per share, WaFd Bank trades at 0.9x forward P/B. Read our free research report to see why you should think twice about including WAFD in your portfolio.
Stocks We Like More
When Trump unveiled his aggressive tariff plan in April 2025, markets tanked as investors feared a full-blown trade war. But those who panicked and sold missed the subsequent rebound that’s already erased most losses.
Don’t let fear keep you from great opportunities and take a look at Top 5 Strong Momentum Stocks for this week. This is a curated list of our High Quality stocks that have generated a market-beating return of 183% over the last five years (as of March 31st 2025).
Stocks that made our list in 2020 include now familiar names such as Nvidia (+1,545% between March 2020 and March 2025) as well as under-the-radar businesses like the once-small-cap company Exlservice (+354% five-year return).
StockStory is growing and hiring equity analyst and marketing roles. Are you a 0 to 1 builder passionate about the markets and AI? See the open roles here.
A leading Pacific Northwest bank with $26.7B in assets, strong profitability, and high customer satisfaction, has evolved into a full-service commercial bank with a diversified loan and deposit base. Maintains robust capital, liquidity, and asset quality, while returning significant value to shareholders and investing in ESG initiatives.
Original document: WaFd, Inc. [WAFD] Slides Release — Aug. 22 2025
Quarterly earnings results are a good time to check in on a company’s progress, especially compared to its peers in the same sector. Today we are looking at WaFd Bank and the best and worst performers in the thrifts & mortgage finance industry.
Thrifts & Mortgage Finance institutions operate by accepting deposits and extending loans primarily for residential mortgages, earning revenue through interest rate spreads (difference between lending rates and borrowing costs) and origination fees. The industry benefits from demographic tailwinds as millennials enter prime homebuying age, technological advancements streamlining the loan approval process, and potential interest rate stabilization improving affordability. However, significant headwinds include net interest margin compression during rate volatility, increased competition from fintech disruptors offering digital-first experiences, mounting regulatory compliance costs, and potential housing market corrections that could impact loan portfolios and default rates.
The 18 thrifts & mortgage finance stocks we track reported a slower Q2. As a group, revenues missed analysts’ consensus estimates by 29.8% while next quarter’s revenue guidance was in line.
In light of this news, share prices of the companies have held steady as they are up 3.6% on average since the latest earnings results.
Founded in 1917 and rebranded from Washington Federal in 2023, WaFd is a bank holding company that provides lending, deposit services, and insurance through its Washington Federal Bank subsidiary across eight western states.
WaFd Bank reported revenues of $186.3 million, down 4.2% year on year. This print exceeded analysts’ expectations by 1.8%. Overall, it was a strong quarter for the company with a beat of analysts’ EPS estimates and a narrow beat of analysts’ net interest income estimates.
Interestingly, the stock is up 3.2% since reporting and currently trades at $30.67.
Is now the time to buy WaFd Bank? Access our full analysis of the earnings results here, it’s free.
Operating under the guidance of Ellington Management Group, a respected name in structured credit markets, Ellington Financial acquires and manages a diverse portfolio of mortgage-related, consumer-related, and other financial assets to generate returns for investors.
Ellington Financial reported revenues of $92.54 million, up 1.5% year on year, outperforming analysts’ expectations by 11.5%. The business had a stunning quarter with a solid beat of analysts’ tangible book value per share estimates and a beat of analysts’ EPS estimates.
The market seems happy with the results as the stock is up 9.6% since reporting. It currently trades at $13.88.
Is now the time to buy Ellington Financial? Access our full analysis of the earnings results here, it’s free.
Operating as one of only 17 non-bank Small Business Lending Companies with preferred lender status from the SBA, Ready Capital is a multi-strategy real estate finance company that originates, acquires, and services commercial real estate loans, small business loans, and other real estate investments.
Ready Capital reported revenues of -$26.37 million, up 29.4% year on year, falling short of analysts’ expectations by 155%. It was a disappointing quarter as it posted a significant miss of analysts’ tangible book value per share estimates and a significant miss of analysts’ net interest income estimates.
Ready Capital delivered the weakest performance against analyst estimates in the group. As expected, the stock is down 8.6% since the results and currently trades at $3.88.
Read our full analysis of Ready Capital’s results here.
Originating as a small mortgage banking firm during the Great Depression in 1937, Walker & Dunlop provides commercial real estate financing, property sales, appraisal, and investment management services with a focus on multifamily properties.
Walker & Dunlop reported revenues of $319.2 million, up 17.9% year on year. This result beat analysts’ expectations by 17.1%. Overall, it was an exceptional quarter as it also recorded a solid beat of analysts’ net interest income estimates and a beat of analysts’ EPS estimates.
Walker & Dunlop pulled off the biggest analyst estimates beat among its peers. The stock is up 11.7% since reporting and currently trades at $84.28.
Read our full, actionable report on Walker & Dunlop here, it’s free.
With a diverse portfolio spanning commercial properties, residential mortgages, infrastructure loans, and real estate servicing, Starwood Property Trust is a real estate investment trust that originates, acquires, and manages commercial mortgages, residential loans, and other real estate investments.
Starwood Property Trust reported revenues of $165.5 million, down 11.2% year on year. This number lagged analysts' expectations by 20.4%. Overall, it was a softer quarter as it also recorded a significant miss of analysts’ net interest income estimates.
The stock is up 2.8% since reporting and currently trades at $19.97.
Read our full, actionable report on Starwood Property Trust here, it’s free.
Market Update
Thanks to the Fed’s rate hikes in 2022 and 2023, inflation has been on a steady path downward, easing back toward that 2% sweet spot. Fortunately (miraculously to some), all this tightening didn’t send the economy tumbling into a recession, so here we are, cautiously celebrating a soft landing. The cherry on top? Recent rate cuts (half a point in September 2024, a quarter in November) have propped up markets, especially after Trump’s November win lit a fire under major indices and sent them to all-time highs. However, there’s still plenty to ponder — tariffs, corporate tax cuts, and what 2025 might hold for the economy.
SEATTLE--(BUSINESS WIRE)--August 12, 2025--
Today, the Board of Directors of WaFd, Inc. (the "Company"), announced a regular quarterly cash dividend of 27 cents per share. The dividend will be paid September 5, 2025, to common shareholders of record as of August 22, 2025. This will be the Company's 170(th) consecutive quarterly cash dividend.
WaFd, Inc. is the parent company of Washington Federal Bank, a federally insured Washington state chartered commercial bank dba WaFd Bank that operates branches in Washington, Oregon, Idaho, Utah, Nevada, Arizona, Texas, New Mexico, and California. Established in 1917, the bank provides consumer and commercial deposit accounts, financing for small- to middle-market businesses, commercial real estate, residential real estate, and insurance products through a subsidiary. As of June 30, 2025, the Company operated 208 branches and reported $26.7 billion in assets, $21.4 billion in deposits and $3.0 billion in shareholders' equity.
Important Cautionary Statements
The foregoing information should be read in conjunction with the financial statements, notes and other information contained in the Company's Annual Report on Form 10-K, Quarterly Reports on Form 10-Q and Current Reports on Form 8-K.
Statements in this press release that speak to the Company's future performance or financial condition constitute "forward-looking statements" as defined by federal law. Such statements are based on present information the Company has related to its present business circumstances. Although the Company believes any such statements are based on reasonable assumptions, there is no assurance that actual or future outcomes will not be materially different.
Any such statements are made in reliance on the "safe harbor" protections provided under the Private Securities Litigation Reform Act of 1995. Additional information about risks and additional matters that could lead to material changes in the Company's performance or financial condition are contained in the Company's annual and quarterly reports filed with the SEC, including under "Risk Factors" in Part I, Item 1A of the Company's Annual Report on Form 10-K for the year ended September 30, 2024.
To find out more about WaFd Bank, or to find a copy of our 10-K or our other SEC filings, please visit our website www.wafdbank.com.
View source version on businesswire.com: https://www.businesswire.com/news/home/20250812375208/en/
CONTACT: WaFd, Inc.
425 Pike Street, Seattle, WA 98101
Brad Goode, SVP, Chief Marketing Officer 206-626-8178
Brad.Goode@wafd.com
LendingTree, Inc.’s TREE second-quarter 2025 adjusted net income per share of $1.13 topped the Zacks Consensus Estimate of 97 cents. The figure compares favorably with the 54 cents reported in the prior-year quarter.
Results were driven by a rise in revenues. An increase in adjusted EBITDA was an added positive. However, a rise in total cost was a spoilsport.
Results exclude certain non-recurring items. After considering these, TREE reported a GAAP net income of $8.9 million compared with $7.8 million in the year-ago quarter.
TREE’s Revenues, Variable Marketing Margin Increase
Total revenues in the second quarter grew 19% year over year to $250.1 million. The reported figure matched the Zacks Consensus Estimate.
The total cost of revenues was $10 million, up 19.2% from the prior-year quarter.
Adjusted EBITDA totaled $31.8 million, up 35.3% from the year-ago quarter. The variable marketing margin was $83.6 million, up 17.9% year over year.
As of June 30, 2025, cash and cash equivalents were $149.1 million compared with $126.4 million as of March 31, 2025. Long-term debt was $385.1 million compared with $387.7 million as of March 31, 2025.
LendingTree’s Outlook
The company provided the third-quarter view and updated its 2025 outlook.
Q3
For the third quarter of 2025, total revenues are estimated to be between $273 million and $281 million.
Adjusted EBITDA and the variable marketing margin are anticipated to be $34-$36 million and $86-$89 million, respectively.
2025
For 2025, total revenues are expected to be between $1 billion and $1.05 billion compared with the prior mentioned $955-$995 million.
Adjusted EBITDA is projected to be in the range of $119-$126 million compared with the prior stated $116-$124 million. The variable marketing margin is expected to be $329-$336 million compared with the $319-$332 million mentioned previously.
Our View on LendingTree
TREE’s inorganic growth moves have strengthened its online lending platform. Its second-quarter results primarily benefited from an increase in EBITDA. The company’s efforts to increase revenues by diversifying its non-mortgage product offerings will support top-line growth in the future.
LendingTree, Inc. Price, Consensus and EPS Surprise
LendingTree, Inc. price-consensus-eps-surprise-chart | LendingTree, Inc. Quote
Currently, LendingTree carries a Zacks Rank #3 (Hold). You can see the complete list of today’s Zacks #1 Rank (Strong Buy) stocks here.
Performance of Other Finance Stocks
WaFd, Inc. WAFD reported third-quarter fiscal 2025 (ended June 30) adjusted earnings of 73 cents per share, which outpaced the Zacks Consensus Estimate of 67 cents. However, the bottom line decreased 3.9% year over year.
WAFD’s results benefited from an increase in non-interest income and a decline in expenses. However, a fall in net interest income (NII) and lower loan and deposit balances were the major undermining factors. Also, provision for credit losses rose during the quarter.
Hancock Whitney Corp.’s HWC second-quarter 2025 adjusted earnings per share of $1.37 exceeded the Zacks Consensus Estimate of $1.34. Further, the bottom line rose 4.6% from the prior year quarter.
Results benefited from an increase in non-interest income and NII. Also, higher loans were another positive. However, higher adjusted expenses and provisions alongside lower deposit balances were headwinds for HWC.
This article originally published on Zacks Investment Research (zacks.com).
Zacks Investment Research
White Label
Data API
Web Plug-ins
Poster Maker
Affiliate Program
The risk of loss in trading financial instruments such as stocks, FX, commodities, futures, bonds, ETFs and crypto can be substantial. You may sustain a total loss of the funds that you deposit with your broker. Therefore, you should carefully consider whether such trading is suitable for you in light of your circumstances and financial resources.
No decision to invest should be made without thoroughly conducting due diligence by yourself or consulting with your financial advisors. Our web content might not suit you since we don't know your financial conditions and investment needs. Our financial information might have latency or contain inaccuracy, so you should be fully responsible for any of your trading and investment decisions. The company will not be responsible for your capital loss.
Without getting permission from the website, you are not allowed to copy the website's graphics, texts, or trademarks. Intellectual property rights in the content or data incorporated into this website belong to its providers and exchange merchants.
Not Logged In
Log in to access more features

FastBull Membership
Not yet
Purchase
Log In
Sign Up