Markets
News
Analysis
User
24/7
Economic Calendar
Education
Data
- Names
- Latest
- Prev


Signal Accounts for Members
All Signal Accounts
All Contests


U.K. Trade Balance (Oct)A:--
F: --
P: --
U.K. Services Index MoMA:--
F: --
P: --
U.K. Construction Output MoM (SA) (Oct)A:--
F: --
P: --
U.K. Industrial Output YoY (Oct)A:--
F: --
P: --
U.K. Trade Balance (SA) (Oct)A:--
F: --
P: --
U.K. Trade Balance EU (SA) (Oct)A:--
F: --
P: --
U.K. Manufacturing Output YoY (Oct)A:--
F: --
P: --
U.K. GDP MoM (Oct)A:--
F: --
P: --
U.K. GDP YoY (SA) (Oct)A:--
F: --
P: --
U.K. Industrial Output MoM (Oct)A:--
F: --
P: --
U.K. Construction Output YoY (Oct)A:--
F: --
P: --
France HICP Final MoM (Nov)A:--
F: --
P: --
China, Mainland Outstanding Loans Growth YoY (Nov)A:--
F: --
P: --
China, Mainland M2 Money Supply YoY (Nov)A:--
F: --
P: --
China, Mainland M0 Money Supply YoY (Nov)A:--
F: --
P: --
China, Mainland M1 Money Supply YoY (Nov)A:--
F: --
P: --
India CPI YoY (Nov)A:--
F: --
P: --
India Deposit Gowth YoYA:--
F: --
P: --
Brazil Services Growth YoY (Oct)A:--
F: --
P: --
Mexico Industrial Output YoY (Oct)A:--
F: --
P: --
Russia Trade Balance (Oct)A:--
F: --
P: --
Philadelphia Fed President Henry Paulson delivers a speech
Canada Building Permits MoM (SA) (Oct)A:--
F: --
P: --
Canada Wholesale Sales YoY (Oct)A:--
F: --
P: --
Canada Wholesale Inventory MoM (Oct)A:--
F: --
P: --
Canada Wholesale Inventory YoY (Oct)A:--
F: --
P: --
Canada Wholesale Sales MoM (SA) (Oct)A:--
F: --
P: --
Germany Current Account (Not SA) (Oct)A:--
F: --
P: --
U.S. Weekly Total Rig CountA:--
F: --
P: --
U.S. Weekly Total Oil Rig CountA:--
F: --
P: --
Japan Tankan Large Non-Manufacturing Diffusion Index (Q4)--
F: --
P: --
Japan Tankan Small Manufacturing Outlook Index (Q4)--
F: --
P: --
Japan Tankan Large Non-Manufacturing Outlook Index (Q4)--
F: --
P: --
Japan Tankan Large Manufacturing Outlook Index (Q4)--
F: --
P: --
Japan Tankan Small Manufacturing Diffusion Index (Q4)--
F: --
P: --
Japan Tankan Large Manufacturing Diffusion Index (Q4)--
F: --
P: --
Japan Tankan Large-Enterprise Capital Expenditure YoY (Q4)--
F: --
P: --
U.K. Rightmove House Price Index YoY (Dec)--
F: --
P: --
China, Mainland Industrial Output YoY (YTD) (Nov)--
F: --
P: --
China, Mainland Urban Area Unemployment Rate (Nov)--
F: --
P: --
Saudi Arabia CPI YoY (Nov)--
F: --
P: --
Euro Zone Industrial Output YoY (Oct)--
F: --
P: --
Euro Zone Industrial Output MoM (Oct)--
F: --
P: --
Canada Existing Home Sales MoM (Nov)--
F: --
P: --
Euro Zone Total Reserve Assets (Nov)--
F: --
P: --
U.K. Inflation Rate Expectations--
F: --
P: --
Canada National Economic Confidence Index--
F: --
P: --
Canada New Housing Starts (Nov)--
F: --
P: --
U.S. NY Fed Manufacturing Employment Index (Dec)--
F: --
P: --
U.S. NY Fed Manufacturing Index (Dec)--
F: --
P: --
Canada Core CPI YoY (Nov)--
F: --
P: --
Canada Manufacturing Unfilled Orders MoM (Oct)--
F: --
P: --
Canada Manufacturing New Orders MoM (Oct)--
F: --
P: --
Canada Core CPI MoM (Nov)--
F: --
P: --
Canada Manufacturing Inventory MoM (Oct)--
F: --
P: --
Canada CPI YoY (Nov)--
F: --
P: --
Canada CPI MoM (Nov)--
F: --
P: --
Canada CPI YoY (SA) (Nov)--
F: --
P: --
Canada Core CPI MoM (SA) (Nov)--
F: --
P: --
Canada CPI MoM (SA) (Nov)--
F: --
P: --


No matching data
Latest Views
Latest Views
Trending Topics
Top Columnists
Latest Update
White Label
Data API
Web Plug-ins
Affiliate Program
View All

No data
Even if they go mostly unnoticed, industrial businesses are the backbone of our country. But their prominence also brings high exposure to the ups and downs of economic cycles. Luckily, the tide is turning in their favor as the industry’s 18.1% return over the past six months has topped the S&P 500 by 8.9 percentage points.
Although these companies have produced results lately, a cautious approach is imperative. When the cycle naturally turns, the losers can be left for dead while the winners consolidate and take more of the market. On that note, here are three industrials stocks we’re passing on.
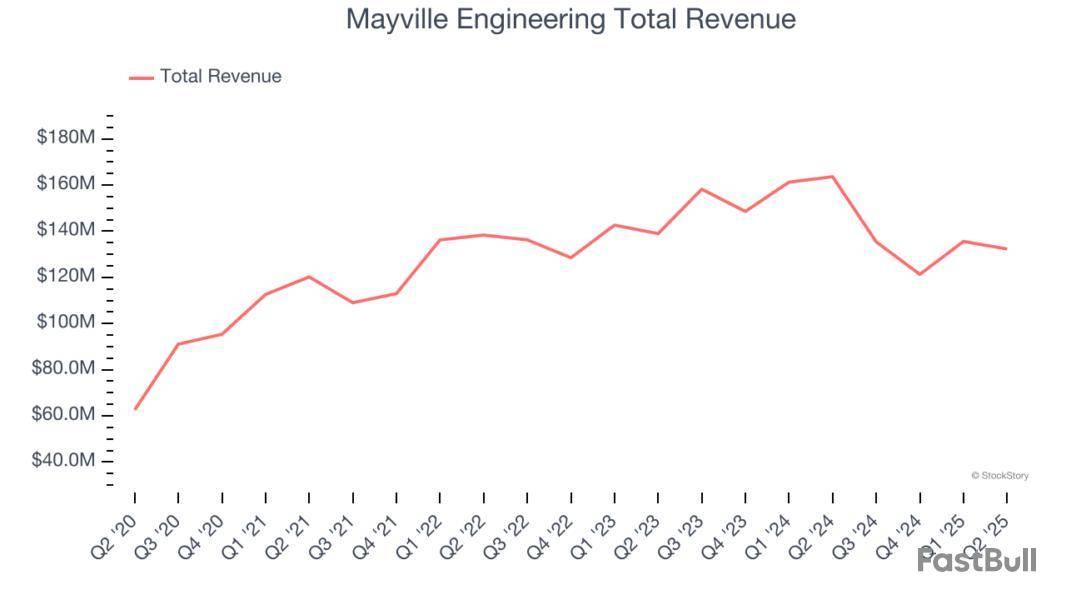
Mayville Engineering (MEC)
Market Cap: $296.2 million
Originally founded solely on tool and die manufacturing, Mayville Engineering Company specializes in metal fabrication, tube bending, and welding to be used in various industries.
Why Does MEC Worry Us?
Mayville Engineering’s stock price of $14.58 implies a valuation ratio of 15.3x forward P/E. Read our free research report to see why you should think twice about including MEC in your portfolio.
Fortive (FTV)
Market Cap: $16.24 billion
Taking its name from the Latin root of "strong", Fortive manufactures products and develops industrial software for numerous industries.
Why Do We Pass on FTV?
At $48.01 per share, Fortive trades at 17.8x forward P/E. Check out our free in-depth research report to learn more about why FTV doesn’t pass our bar.
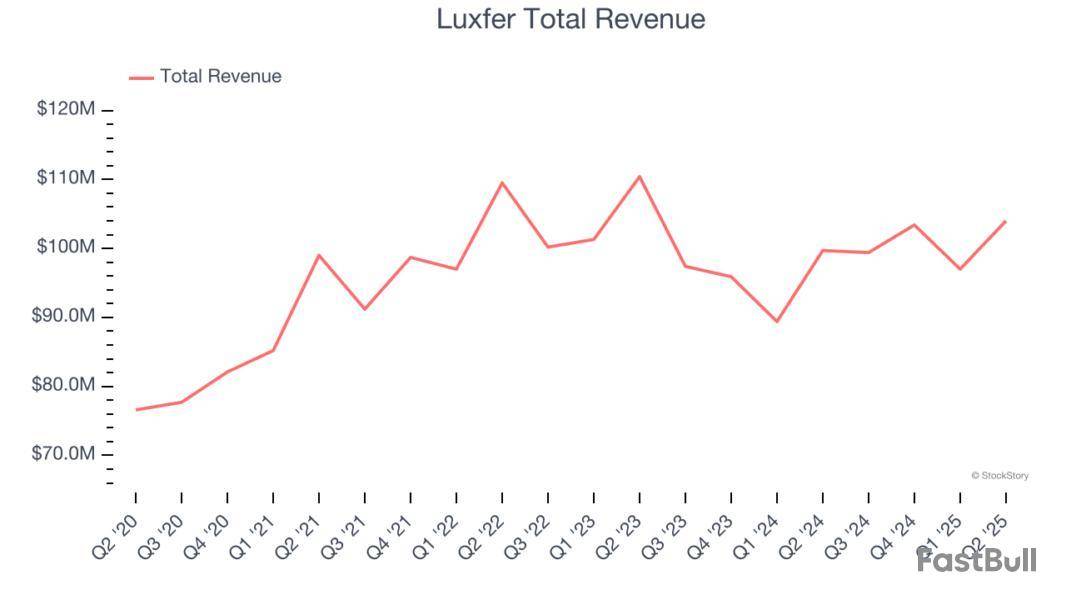
Luxfer (LXFR)
Market Cap: $366.4 million
With its magnesium alloys used in the construction of the famous Spirit of St. Louis aircraft, Luxfer offers specialized materials, components, and gas containment devices to various industries.
Why Are We Out on LXFR?
Luxfer is trading at $13.70 per share, or 12.5x forward P/E. If you’re considering LXFR for your portfolio, see our FREE research report to learn more.
High-Quality Stocks for All Market Conditions
Donald Trump’s April 2025 "Liberation Day" tariffs sent markets into a tailspin, but stocks have since rebounded strongly, proving that knee-jerk reactions often create the best buying opportunities.
The smart money is already positioning for the next leg up. Don’t miss out on the recovery - check out our Top 9 Market-Beating Stocks. This is a curated list of our High Quality stocks that have generated a market-beating return of 183% over the last five years (as of March 31st 2025).
Stocks that made our list in 2020 include now familiar names such as Nvidia (+1,545% between March 2020 and March 2025) as well as under-the-radar businesses like the once-small-cap company Exlservice (+354% five-year return).
StockStory is growing and hiring equity analyst and marketing roles. Are you a 0 to 1 builder passionate about the markets and AI? See the open roles here.
Let’s dig into the relative performance of Mayville Engineering and its peers as we unravel the now-completed Q2 engineered components and systems earnings season.
Engineered components and systems companies possess technical know-how in sometimes narrow areas such as metal forming or intelligent robotics. Lately, automation and connected equipment collecting analyzable data have been trending, creating new demand. On the other hand, like the broader industrials sector, engineered components and systems companies are at the whim of economic cycles. Consumer spending and interest rates, for example, can greatly impact the industrial production that drives demand for these companies’ offerings.
The 13 engineered components and systems stocks we track reported a mixed Q2. As a group, revenues along with next quarter’s revenue guidance were in line with analysts’ consensus estimates.
In light of this news, share prices of the companies have held steady as they are up 3.3% on average since the latest earnings results.
Originally founded solely on tool and die manufacturing, Mayville Engineering Company specializes in metal fabrication, tube bending, and welding to be used in various industries.
Mayville Engineering reported revenues of $132.3 million, down 19.1% year on year. This print fell short of analysts’ expectations by 4.1%. Overall, it was a slower quarter for the company with a miss of analysts’ Commercial Vehicle revenue estimates and full-year revenue guidance missing analysts’ expectations significantly.
Mayville Engineering delivered the slowest revenue growth of the whole group. Unsurprisingly, the stock is down 12.7% since reporting and currently trades at $14.58.
Read our full report on Mayville Engineering here, it’s free.
Founded as a single retail store, Arrow Electronics provides electronic components and enterprise computing solutions to businesses globally.
Arrow Electronics reported revenues of $7.58 billion, up 10% year on year, outperforming analysts’ expectations by 5.9%. The business had an exceptional quarter with a beat of analysts’ EPS estimates and an impressive beat of analysts’ ECS revenue estimates.
Arrow Electronics scored the biggest analyst estimates beat among its peers. Although it had a fine quarter compared its peers, the market seems unhappy with the results as the stock is down 1.7% since reporting. It currently trades at $127.78.
Is now the time to buy Arrow Electronics? Access our full analysis of the earnings results here, it’s free.
A developer of the communication systems used in the Batmobile of “The Dark Knight,” ESCO is a provider of engineered components for the aerospace, defense, and utility sectors.
ESCO reported revenues of $296.3 million, up 13.6% year on year, falling short of analysts’ expectations by 7%. It was a disappointing quarter as it posted full-year revenue guidance missing analysts’ expectations significantly and full-year EPS guidance missing analysts’ expectations significantly.
ESCO delivered the fastest revenue growth but had the weakest performance against analyst estimates in the group. Interestingly, the stock is up 4.3% since the results and currently trades at $198.51.
Read our full analysis of ESCO’s results here.
Formerly called The Ohio Ball Bearing Company, Applied Industrial distributes industrial products–everything from power tools to industrial valves–and services to a wide variety of industries.
Applied Industrial reported revenues of $1.22 billion, up 5.5% year on year. This result beat analysts’ expectations by 3.5%. It was a strong quarter as it also logged a solid beat of analysts’ organic revenue estimates and a decent beat of analysts’ EBITDA estimates.
The stock is down 2.6% since reporting and currently trades at $268.40.
Read our full, actionable report on Applied Industrial here, it’s free.
Headquartered in Milwaukee, Regal Rexnord provides power transmission and industrial automation products.
Regal Rexnord reported revenues of $1.50 billion, down 3.3% year on year. This print was in line with analysts’ expectations. Taking a step back, it was a mixed quarter as it also recorded full-year EPS guidance slightly topping analysts’ expectations but a slight miss of analysts’ adjusted operating income estimates.
The stock is up 5.1% since reporting and currently trades at $152.72.
Read our full, actionable report on Regal Rexnord here, it’s free.
Market Update
The Fed’s interest rate hikes throughout 2022 and 2023 have successfully cooled post-pandemic inflation, bringing it closer to the 2% target. Inflationary pressures have eased without tipping the economy into a recession, suggesting a soft landing. This stability, paired with recent rate cuts (0.5% in September 2024 and 0.25% in November 2024), fueled a strong year for the stock market in 2024. The markets surged further after Donald Trump’s presidential victory in November, with major indices reaching record highs in the days following the election. Still, questions remain about the direction of economic policy, as potential tariffs and corporate tax changes add uncertainty for 2025.
Wrapping up Q2 earnings, we look at the numbers and key takeaways for the general industrial machinery stocks, including 3M and its peers.
Automation that increases efficiency and connected equipment that collects analyzable data have been trending, creating new demand for general industrial machinery companies. Those who innovate and create digitized solutions can spur sales and speed up replacement cycles, but all general industrial machinery companies are still at the whim of economic cycles. Consumer spending and interest rates, for example, can greatly impact the industrial production that drives demand for these companies’ offerings.
The 15 general industrial machinery stocks we track reported a satisfactory Q2. As a group, revenues beat analysts’ consensus estimates by 2.3% while next quarter’s revenue guidance was in line.
In light of this news, share prices of the companies have held steady as they are up 1.1% on average since the latest earnings results.
Producers of the first asthma inhaler, 3M Company is a global conglomerate known for products in industries like healthcare, safety, electronics, and consumer goods.
3M reported revenues of $6.34 billion, up 1.4% year on year. This print exceeded analysts’ expectations by 4%. Overall, it was a very strong quarter for the company with full-year EPS guidance exceeding analysts’ expectations and a solid beat of analysts’ adjusted operating income estimates.
Unsurprisingly, the stock is down 1.8% since reporting and currently trades at $156.25.
Is now the time to buy 3M? Access our full analysis of the earnings results here, it’s free.
With its magnesium alloys used in the construction of the famous Spirit of St. Louis aircraft, Luxfer offers specialized materials, components, and gas containment devices to various industries.
Luxfer reported revenues of $104 million, up 4.3% year on year, outperforming analysts’ expectations by 5.9%. The business had an incredible quarter with a beat of analysts’ EPS estimates and a solid beat of analysts’ EBITDA estimates.
The market seems happy with the results as the stock is up 13.5% since reporting. It currently trades at $14.
Is now the time to buy Luxfer? Access our full analysis of the earnings results here, it’s free.
Founded in 1987, Icahn Enterprises is a diversified holding company primarily engaged in investment and asset management across various sectors.
Icahn Enterprises reported revenues of $2.32 billion, up 5.3% year on year, falling short of analysts’ expectations by 3%. It was a disappointing quarter as it posted a significant miss of analysts’ EPS estimates.
Icahn Enterprises delivered the weakest performance against analyst estimates in the group. As expected, the stock is down 7% since the results and currently trades at $8.35.
Read our full analysis of Icahn Enterprises’s results here.
One of the original 12 companies on the Dow Jones Industrial Average, General Electric is a multinational conglomerate providing technologies for various sectors including aviation, power, renewable energy, and healthcare.
GE Aerospace reported revenues of $10.15 billion, up 23.4% year on year. This number beat analysts’ expectations by 6.5%. Overall, it was a stunning quarter as it also put up an impressive beat of analysts’ EBITDA estimates and a solid beat of analysts’ adjusted operating income estimates.
GE Aerospace delivered the biggest analyst estimates beat among its peers. The stock is up 3.2% since reporting and currently trades at $274.94.
Read our full, actionable report on GE Aerospace here, it’s free.
Tracing back to its invention of the mechanical milk bottle filler in 1884, John Bean (NYSE:JBT) designs, manufactures, and sells equipment used for food processing and aviation.
John Bean reported revenues of $934.8 million, up 132% year on year. This result topped analysts’ expectations by 4.9%. It was a strong quarter as it also recorded a solid beat of analysts’ EBITDA estimates and a beat of analysts’ EPS estimates.
John Bean pulled off the fastest revenue growth among its peers. The stock is up 8.9% since reporting and currently trades at $145.52.
Read our full, actionable report on John Bean here, it’s free.
Market Update
As a result of the Fed’s rate hikes in 2022 and 2023, inflation has come down from frothy levels post-pandemic. The general rise in the price of goods and services is trending towards the Fed’s 2% goal as of late, which is good news. The higher rates that fought inflation also didn't slow economic activity enough to catalyze a recession. So far, soft landing. This, combined with recent rate cuts (half a percent in September 2024 and a quarter percent in November 2024) have led to strong stock market performance in 2024. The icing on the cake for 2024 returns was Donald Trump’s victory in the U.S. Presidential Election in early November, sending major indices to all-time highs in the week following the election. Still, debates around the health of the economy and the impact of potential tariffs and corporate tax cuts remain, leaving much uncertainty around 2025.
All major U.S. stock indices improved more than 1.5% on Aug. 22, 2025, following Federal Reserve Chair Jerome Powell’s latest hint at a possible cut in the nation’s interest rate next month. Resultantly, traders across the board reacted to this optimistically and thus Wall Street observed a decent hike.
This might encourage stakeholders to invest more in the stock market right now in the anticipation that market will move up more each day as we progress towards the upcoming September Fed-meet. However, considering the fact that the share market has lately been on edge, we recommend choosing safe-bet stocks stocks like NatWest Group (NWG), Sterling Infrastructure (STRL), Luxfer Holdings (LXFR), Evercore (EVR) and Hillman Solutions Corp. (HLMN) that are less leveraged and thus likely to provide a protective cushion against a sudden economic crisis.
Now, before selecting low-leverage stocks, let’s explore what leverage is and how choosing a low-leverage stock helps investors.
In finance, leverage is a term used to denote the practice of borrowing capital by companies to run their operations smoothly and expand them. Such borrowings are done through debt financing. But there remains an option for equity finance. This is probably due to the cheap and easy availability of debt over equity financing.
However, debt financing has its share of drawbacks. Particularly, it is desirable only as long as it successfully generates a higher rate of return compared to the interest rate. So, to avoid considerable losses in your portfolio, one should always avoid companies that resort to excessive debt financing.
The crux of safe investment lies in choosing a company that is not burdened with debt, as a debt-free stock is almost impossible to find.
The equity market can be volatile at times, and, as an investor, if you don’t want to lose big time, we suggest you invest in stocks that bear low leverage and are, hence, less risky.
To identify such stocks, historically, several leverage ratios have been developed to measure the amount of debt a company bears. The debt-to-equity ratio is one of the most common ratios.
Debt-to-Equity Ratio = Total Liabilities/Shareholders’ Equity
This metric is a liquidity ratio that indicates the amount of financial risk a company bears. A lower debt-to-equity ratio reflects improved solvency for a company.
With the second-quarter 2025 earnings season almost in its last lap, investors must be eyeing stocks that have exhibited solid earnings growth in the recent past.
But if a stock bears a high debt-to-equity ratio in times of economic downturn, its so-called booming earnings picture might turn into a nightmare.
Considering the factors above, it is prudent to choose stocks with a low debt-to-equity ratio to ensure steady returns.
Yet, an investment strategy based solely on the debt-to-equity ratio might not fetch the desired outcome. To choose stocks that have the potential to give you steady returns, we have expanded our screening criteria to include some other factors.
Debt/Equity less than X-Industry Median: Stocks that are less leveraged than their industry peers.
Current Price greater than or equal to 10: The stocks must be trading at a minimum of $10 or above.
Average 20-day Volume greater than or equal to 50000: A substantial trading volume ensures that the stock is easily tradable.
Percentage Change in EPS F(0)/F(-1) greater than X-Industry Median: Earnings growth adds to optimism, leading to a stock’s price appreciation.
VGM Score of A or B: Our research shows that stocks with a VGM Score of A or B, when combined with a Zacks Rank #1 (Strong Buy) or 2 (Buy), offer the best upside potential.
Estimated One-Year EPS Growth F(1)/F(0) greater than 5: This shows earnings growth expectation.
Zacks Rank #1 or 2: Irrespective of market conditions, stocks with a Zacks Rank #1 or 2 have a proven history of success.
Excluding stocks that have a negative or a zero debt-to-equity ratio, here we present our five picks out of the 14 stocks that made it through the screen.
NatWest Group: It operates as a banking and financial services company. On Aug. 22, 2025, NatWest announced that it has joined the debt financing syndicate to fund the essential upgrades and tunnel replacements, ensuring continued water supply for the UK’s largest potable water aqueduct — Haweswater Aqueduct. As a Mandated Lead Arranger, NWG will provide £140 million in lending. This project further reinforced NatWest’s position as the UK’s leading bank for infrastructure financing.
The Zacks Consensus Estimate for NWG’s 2025 sales suggests an improvement of 20.1% from the 2024 reported figure. The company boasts a long-term (three-to-five years) earnings growth rate of 10.9%. It currently has a Zacks Rank #2.
Sterling Infrastructure: It operates through subsidiaries within segments specializing in E-Infrastructure, Building and Transportation Solutions, principally in the United States. On Aug. 4, 2025, STRL announced its second-quarter 2025 results. Its revenues improved 21% year over year, while its earnings per share surged a solid 40.8%.
The Zacks Consensus Estimate for STRL’s 2025 earnings suggests a year-over-year improvement of 45.9%. The stock boasts a four-quarter average earnings surprise of 12.1%. It currently carries a Zacks Rank #2. You can see the complete list of today’s Zacks #1 Rank stocks here.
Luxfer Holdings: It is a materials technology company specializing in the design, manufacture and supply of high-performance materials, components and gas cylinders. On July 29, 2025, LXFR released its second-quarter 2025 results. Its adjusted net sales improved 5.8% year over year, while its adjusted earnings per share surged a solid 25%.
LXFR boasts a solid long-term earnings growth rate of 8%. The Zacks Consensus Estimate for Luxfer’s 2025 sales suggests a year-over-year improvement of 1.1%. It currently carries a Zacks Rank #2.
Evercore: It is a premier global independent investment banking advisory firm. On July 30, 2025, Evercore announced its second-quarter 2025 results. Its adjusted revenues improved 20.7% year over year, while its earnings surged 30.4%.
The Zacks Consensus Estimate for EVR’s 2025 sales indicates an improvement of 15.9% from the 2024 reported actuals. The Zacks Consensus Estimate for 2025 earnings also indicates an improvement of 31.7% from the 2024 reported figure. It currently carries a Zacks Rank #2.
Hillman Solutions: It is a leading provider of hardware-related products and solutions to retail markets in North America. On Aug. 5, 2025, Hillman Solutions announced its second-quarter 2025 results. Its sales improved a solid 6.2% year over year, while adjusted earnings per share grew 6.3%.
The Zacks Consensus Estimate for HLMN’s 2025 sales indicates an improvement of 6.6% from the 2024 reported actuals. The Zacks Consensus Estimate for 2025 earnings also indicates an improvement of 12.2% from the 2024 reported figure. It currently carries a Zacks Rank #2.
You can get the remaining nine stocks on this list by signing up now for your 2-week free trial to the Research Wizard and start using this screen in your trading.
Further, you can also create your strategies and backtest them first before taking the investment plunge.
The Research Wizard is a great place to begin. It's easy to use. Everything is in plain language. And it's very intuitive. Start your Research Wizard trial today.
And the next time you read an economic report, open up the Research Wizard, plug your finds in, and see what gems come out.
Click here to sign up for a free trial to the Research Wizard today.
Disclosure: Officers, directors and/or employees of Zacks Investment Research may own or have sold short securities and/or hold long and/or short positions in options that are mentioned in this material. An affiliated investment advisory firm may own or have sold short securities and/or hold long and/or short positions in options that are mentioned in this material.
Disclosure: Performance information for Zacks’ portfolios and strategies are available at: https://www.zacks.com/performance.
Want the latest recommendations from Zacks Investment Research? Today, you can download 7 Best Stocks for the Next 30 Days. Click to get this free report
Evercore Inc (EVR) : Free Stock Analysis Report
Sterling Infrastructure, Inc. (STRL) : Free Stock Analysis Report
Luxfer Holdings PLC (LXFR) : Free Stock Analysis Report
NatWest Group plc (NWG) : Free Stock Analysis Report
Hillman Solutions Corp. (HLMN) : Free Stock Analysis Report
This article originally published on Zacks Investment Research (zacks.com).
Zacks Investment Research
White Label
Data API
Web Plug-ins
Poster Maker
Affiliate Program
The risk of loss in trading financial instruments such as stocks, FX, commodities, futures, bonds, ETFs and crypto can be substantial. You may sustain a total loss of the funds that you deposit with your broker. Therefore, you should carefully consider whether such trading is suitable for you in light of your circumstances and financial resources.
No decision to invest should be made without thoroughly conducting due diligence by yourself or consulting with your financial advisors. Our web content might not suit you since we don't know your financial conditions and investment needs. Our financial information might have latency or contain inaccuracy, so you should be fully responsible for any of your trading and investment decisions. The company will not be responsible for your capital loss.
Without getting permission from the website, you are not allowed to copy the website's graphics, texts, or trademarks. Intellectual property rights in the content or data incorporated into this website belong to its providers and exchange merchants.
Not Logged In
Log in to access more features

FastBull Membership
Not yet
Purchase
Log In
Sign Up