• Trade
  • Markets
  • Copy
  • Contests
  • 24/7
  • Calendar
  • Q&A
  • Chats
Screeners
SYMBOL
LAST
BID
ASK
HIGH
LOW
NET CHG.
%CHG.
SPREAD
SOURCE
SPX
S&P 500 Index
7718.12
7718.12
7718.12
7738.70
7715.03
+5.55
+ 0.07%
--
--
DJI
Dow Jones Industrial Average
52415.33
52415.33
52415.33
52711.93
52392.28
-80.55
-0.15%
--
--
IXIC
NASDAQ Composite Index
26519.50
26519.50
26519.50
26636.65
26511.24
+94.70
+ 0.36%
--
--
USDX
US Dollar Index
101.530
101.530
101.610
101.620
101.420
+0.050
+ 0.05%
--
--
EURUSD
Euro / US Dollar
1.12264
1.12264
1.12272
1.12373
1.12134
-0.00098
-0.09%
--
--
GBPUSD
Pound Sterling / US Dollar
1.33863
1.33863
1.33874
1.34026
1.33638
+0.00080
+ 0.06%
--
--
XAUUSD
Gold / US Dollar
4126.93
4126.93
4127.34
4141.76
4106.07
+1.93
+ 0.05%
--
--
WTI
Light Sweet Crude Oil
97.518
97.518
97.548
100.059
96.633
-0.367
-0.37%
--
--

Community Accounts

Signal Accounts
--
Profit Accounts
--
Loss Accounts
--
View More

Become a signal provider

Sell trading signals to earn additional income

View More

Guide to Copy Trading

Get started with ease and confidence

View More

Signal Accounts for Members

All Signal Accounts

Best Return
  • Best Return
  • Best P/L
  • Best MDD
Past 1W
  • Past 1W
  • Past 1M
  • Past 1Y

All Contests

  • All
  • Recommend
  • Stocks
  • Cryptocurrencies
  • Central Banks
  • Trump Updates
  • Featured News
Top News Only
Share

The Ebola Outbreak In The Democratic Republic Of Congo Has Killed 4,646 People

Share

Iowa Republicans Oppose Ending The Tomato Suspension Agreement Between The US And Mexico

Share

Iowa Republicans Are Urging President Trump To Protect Pork Producers

Share

Honduras' Economic Activity Grew By 2.9% Year-on-Year In August

Share

The Yield On 30-year UK Government Bonds Fell To 5.7726%, The Lowest Level Since September 23, Down About 6 Basis Points On The Day

Share

Argus Data Shows That Despite The Houthi Claim To Have Launched The Attack, Saudi Aramco's Facilities In Yanbu And Sheba Were Undamaged

Share

The Trading Volume Of Polypropylene 2701 Has Exceeded 10.5 Billion Yuan, With A Daily Decline Of 1.18%, And The Latest Price Is 9159 Yuan/ton. The Daily Open Interest Has Decreased By Nearly 5900 Lots, And The Open Interest Has Slightly Declined

Share

Bankless Co-founder Calls ZEC Again: This Cycle Will Reach 10% Of Bitcoin's Market Cap

Share

Brad Rand Said He Has Been Released By The Israel Defense Forces

Share

Kuwait Petroleum Corporation CEO: Kuwait's Crude Oil Exports Exceed 1.1 Million Barrels Per Day

Share

Leidos Has Been Awarded A $160 Million Full-spectrum Cyber Warfare Contract By The U.S. Department Of Defense

Share

Pan-European Wheat Futures Fell 3% After The US And Russia Held Talks On The Russia-Ukraine Conflict

Share

The French Procurement Agency Has Ordered Four SAMP/T Air Defense Systems

Share

Israeli Central Bank Governor Yarron Stated That GDP Data Is Distorted By Israeli Companies' Overseas Production, And The Share Of Overseas Production In GDP Is Growing Rapidly

Share

Kremlin: The EU's New Proposal On Ukraine Is Of Little Value

Share

Rosatom: We Have Not Received Any Formal Notification From Our Clients Regarding Their Intention To Terminate The Contract, Nor Have We Seen Any Legally Grounded Reasons To Support Such A Decision

Share

Rosatom, The Russian State Nuclear Energy Corporation, Stated That It Will Continue The Paks-2 Nuclear Power Plant Project In Hungary

Share

Whittaker: The Talks Between Witkov And Kushner Progressed Productively

Share

British Government Bonds Rose Across The Board, With The Yield On 10-year Bonds Falling 5 Basis Points To 5.36%

Share

Kremlin: Implementing The Russia-US Diesel Agreement Is An Important Part Of The Negotiations

TIME
ACT
FCST
PREV
IMPACT
U.S. API Weekly Gasoline Stocks

A:--

F: --

P: --

WTI
  • WTI
  • XAUUSD
  • XAGUSD
  • USDX
U.S. API Weekly Refined Oil Stocks

A:--

F: --

P: --

WTI
  • WTI
  • XAUUSD
  • XAGUSD
  • USDX
U.S. API Weekly Crude Oil Stocks

A:--

F: --

P: --

WTI
  • WTI
  • XAUUSD
  • XAGUSD
  • USDX
U.S. API Weekly Cushing Crude Oil Stocks

A:--

F: --

P: --

WTI
  • WTI
  • XAUUSD
  • XAGUSD
  • USDX
South Korea PPI MoM (Sept)

A:--

F: --

P: --

XAUUSD
  • XAUUSD
  • XAGUSD
  • WTI
  • USDX
Japan Imports YoY (Sept)

A:--

F: --

P: --

USDJPY
  • USDJPY
  • XAUUSD
  • XAGUSD
  • WTI
  • USDX
Japan Goods Trade Balance (SA) (Sept)

A:--

F: --

P: --

USDJPY
  • USDJPY
  • XAUUSD
  • XAGUSD
  • WTI
  • USDX
Japan Exports YoY (Sept)

A:--

F: --

P: --

USDJPY
  • USDJPY
  • XAUUSD
  • XAGUSD
  • WTI
  • USDX
U.K. Input PPI MoM (Not SA) (Sept)

A:--

F: --

P: --
GBPUSD
  • GBPUSD
  • XAUUSD
  • XAGUSD
  • WTI
  • USDX
U.K. Input PPI YoY (Not SA) (Sept)

A:--

F: --

P: --
GBPUSD
  • GBPUSD
  • XAUUSD
  • XAGUSD
  • WTI
  • USDX
U.K. Output PPI YoY (Not SA) (Sept)

A:--

F: --

P: --
GBPUSD
  • GBPUSD
  • XAUUSD
  • XAGUSD
  • WTI
  • USDX
U.K. Output PPI MoM (Not SA) (Sept)

A:--

F: --

P: --

GBPUSD
  • GBPUSD
  • XAUUSD
  • XAGUSD
  • WTI
  • USDX
U.K. Core CPI YoY (Sept)

A:--

F: --

P: --

GBPUSD
  • GBPUSD
  • XAUUSD
  • XAGUSD
  • WTI
  • USDX
U.K. Core CPI MoM (Sept)

A:--

F: --

P: --

GBPUSD
  • GBPUSD
  • XAUUSD
  • XAGUSD
  • WTI
  • USDX
U.K. Core Retail Prices Index YoY (Sept)

A:--

F: --

P: --

GBPUSD
  • GBPUSD
  • XAUUSD
  • XAGUSD
  • WTI
  • USDX
U.K. Retail Prices Index YoY (Sept)

A:--

F: --

P: --

GBPUSD
  • GBPUSD
  • XAUUSD
  • XAGUSD
  • WTI
  • USDX
U.K. CPI MoM (Sept)

A:--

F: --

P: --

GBPUSD
  • GBPUSD
  • XAUUSD
  • XAGUSD
  • WTI
  • USDX
U.K. Retail Prices Index MoM (Sept)

A:--

F: --

P: --

GBPUSD
  • GBPUSD
  • XAUUSD
  • XAGUSD
  • WTI
  • USDX
U.K. CPI YoY (Sept)

A:--

F: --

P: --

GBPUSD
  • GBPUSD
  • XAUUSD
  • XAGUSD
  • WTI
  • USDX
Indonesia Deposit Facility Rate (Oct)

A:--

F: --

P: --

XAUUSD
  • XAUUSD
  • XAGUSD
  • WTI
  • USDX
Indonesia Lending Facility Rate (Oct)

A:--

F: --

P: --

XAUUSD
  • XAUUSD
  • XAGUSD
  • WTI
  • USDX
Indonesia Loan Growth YoY (Sept)

A:--

F: --

P: --

XAUUSD
  • XAUUSD
  • XAGUSD
  • WTI
  • USDX
Indonesia 7-Day Reverse Repo Rate

A:--

F: --

P: --

XAUUSD
  • XAUUSD
  • XAGUSD
  • WTI
  • USDX
Turkey Capacity Utilization (Oct)

A:--

F: --

P: --

XAUUSD
  • XAUUSD
  • XAGUSD
  • WTI
  • USDX
South Africa Core CPI YoY (Sept)

A:--

F: --

P: --

XAUUSD
  • XAUUSD
  • XAGUSD
  • WTI
  • USDX
South Africa CPI YoY (Sept)

A:--

F: --

P: --

XAUUSD
  • XAUUSD
  • XAGUSD
  • WTI
  • USDX
U.S. MBA Mortgage Application Activity Index WoW

A:--

F: --

P: --

USDX
  • USDX
  • XAUUSD
  • XAGUSD
  • WTI
South Africa Retail Sales YoY (Aug)

A:--

F: --

P: --

XAUUSD
  • XAUUSD
  • XAGUSD
  • WTI
  • USDX
Mexico Retail Sales MoM (Aug)

A:--

F: --

P: --

XAUUSD
  • XAUUSD
  • XAGUSD
  • WTI
  • USDX
BOE Gov Bailey Speaks
U.S. EIA Weekly Heating Oil Stock Changes

--

F: --

P: --

U.S. EIA Weekly Crude Oil Imports Changes

--

F: --

P: --

U.S. EIA Weekly Crude Stocks Change

--

F: --

P: --

U.S. EIA Weekly Cushing, Oklahoma Crude Oil Stocks Change

--

F: --

P: --

U.S. EIA Weekly Crude Demand Projected by Production

--

F: --

P: --

U.S. EIA Weekly Gasoline Stocks Change

--

F: --

P: --

Russia PPI MoM (Sept)

--

F: --

P: --

Russia PPI YoY (Sept)

--

F: --

P: --

ECB President Lagarde Speaks
South Korea Benchmark Interest Rate

--

F: --

P: --

Turkey Consumer Confidence Index (Oct)

--

F: --

P: --

U.K. CBI Industrial Prices Expectations (Oct)

--

F: --

P: --

U.K. CBI Industrial Trends - Orders (Oct)

--

F: --

P: --

Turkey Late Liquidity Window Rate (LON) (Oct)

--

F: --

P: --

Turkey Overnight Lending Rate (O/N) (Oct)

--

F: --

P: --

Turkey 1-Week Repo Rate

--

F: --

P: --

Mexico Unemployment Rate (Not SA) (Sept)

--

F: --

P: --

Canada New Housing Price Index MoM (Sept)

--

F: --

P: --

Canada Industrial Product Price Index YoY (Sept)

--

F: --

P: --

Canada Industrial Product Price Index MoM (Sept)

--

F: --

P: --

U.S. Weekly Initial Jobless Claims (SA)

--

F: --

P: --

U.S. Initial Jobless Claims 4-Week Avg. (SA)

--

F: --

P: --

U.S. Weekly Continued Jobless Claims (SA)

--

F: --

P: --

BOE Gov Bailey Speaks
U.S. Conference Board Coincident Economic Index MoM (Sept)

--

F: --

P: --

U.S. Conference Board Lagging Economic Index MoM (Sept)

--

F: --

P: --

U.S. Conference Board Leading Economic Index (Sept)

--

F: --

P: --

Euro Zone Consumer Confidence Index Prelim (Oct)

--

F: --

P: --

U.S. Conference Board Leading Economic Index MoM (Sept)

--

F: --

P: --

U.S. EIA Weekly Natural Gas Stocks Change

--

F: --

P: --

U.S. Kansas Fed Manufacturing Production Index (Oct)

--

F: --

P: --

Q&A with Experts
    • All
    • Chatrooms
    • Groups
    • Friends
    Osaghae Cephas flag
    EuroTrader
    @Oscarmaybe i was not seeing it in real time but i took only thesells you called earlier, the buys i didnt take
    @EuroTraderu didn't exit in profit in that btc short did u
    Skylark flag
    Skylark
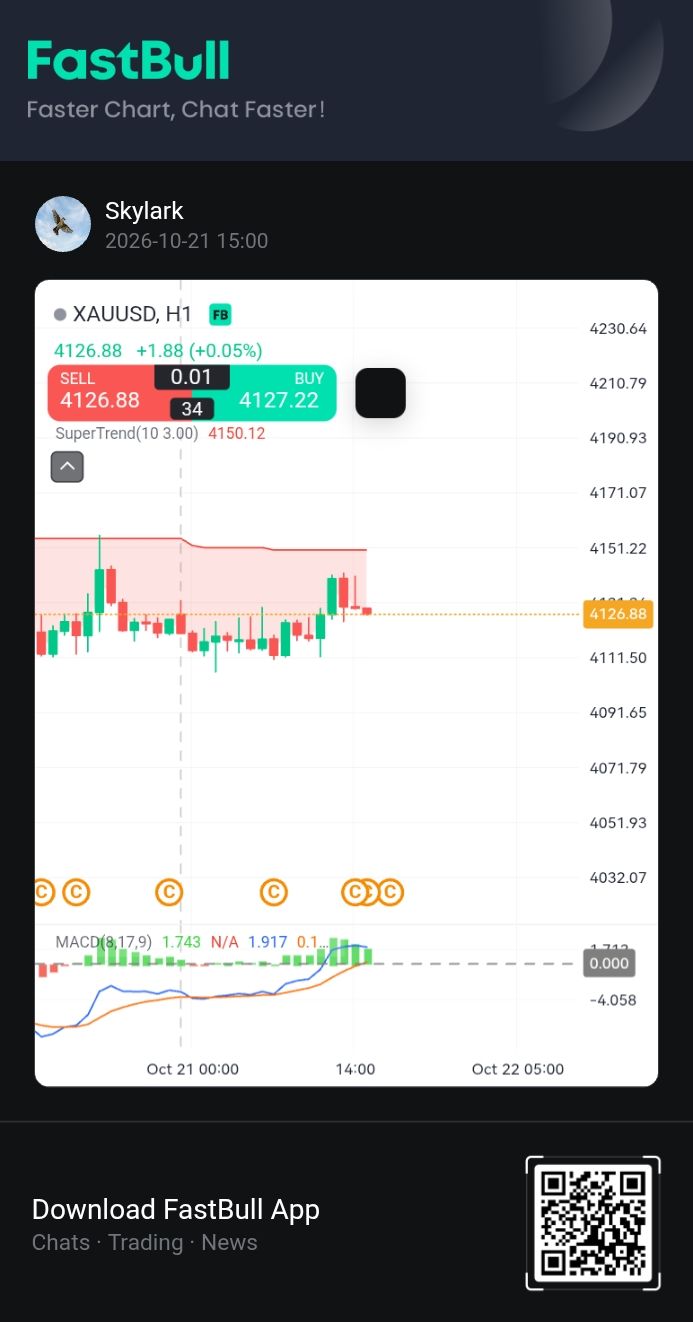
    @Faburama Bojangit seems like the buying pressure is lesser now and the bears what's to flip it again 🤔 and it's very close to your entry at 4125
    EuroTrader flag
    Osaghae Cephas
    @EuroTraderu didn't exit in profit in that btc short did u
    @Osaghae Cephasfirst short was a loss buddy, i took a cold and noit so nice loss on the first short on xauusd
    Oscar flag
    EuroTrader
    @Oscarmaybe i was not seeing it in real time but i took only thesells you called earlier, the buys i didnt take
    @EuroTraderokay
    EuroTrader flag
    Oscar
    @EuroTraderokay
    @Oscaryeah so whjere shoud we be looking to take profit on the trade on gold
    Oscar flag
    yh am I too good in trading
    Oscar flag
    EuroTrader
    @Oscaryeah so whjere shoud we be looking to take profit on the trade on gold
    bro when ever you feel like but for me I am waiting for price to hit my tp
    Okpodi luc flag
    EuroTrader
    @Osaghae Cephasfirst short was a loss buddy, i took a cold and noit so nice loss on the first short on xauusd
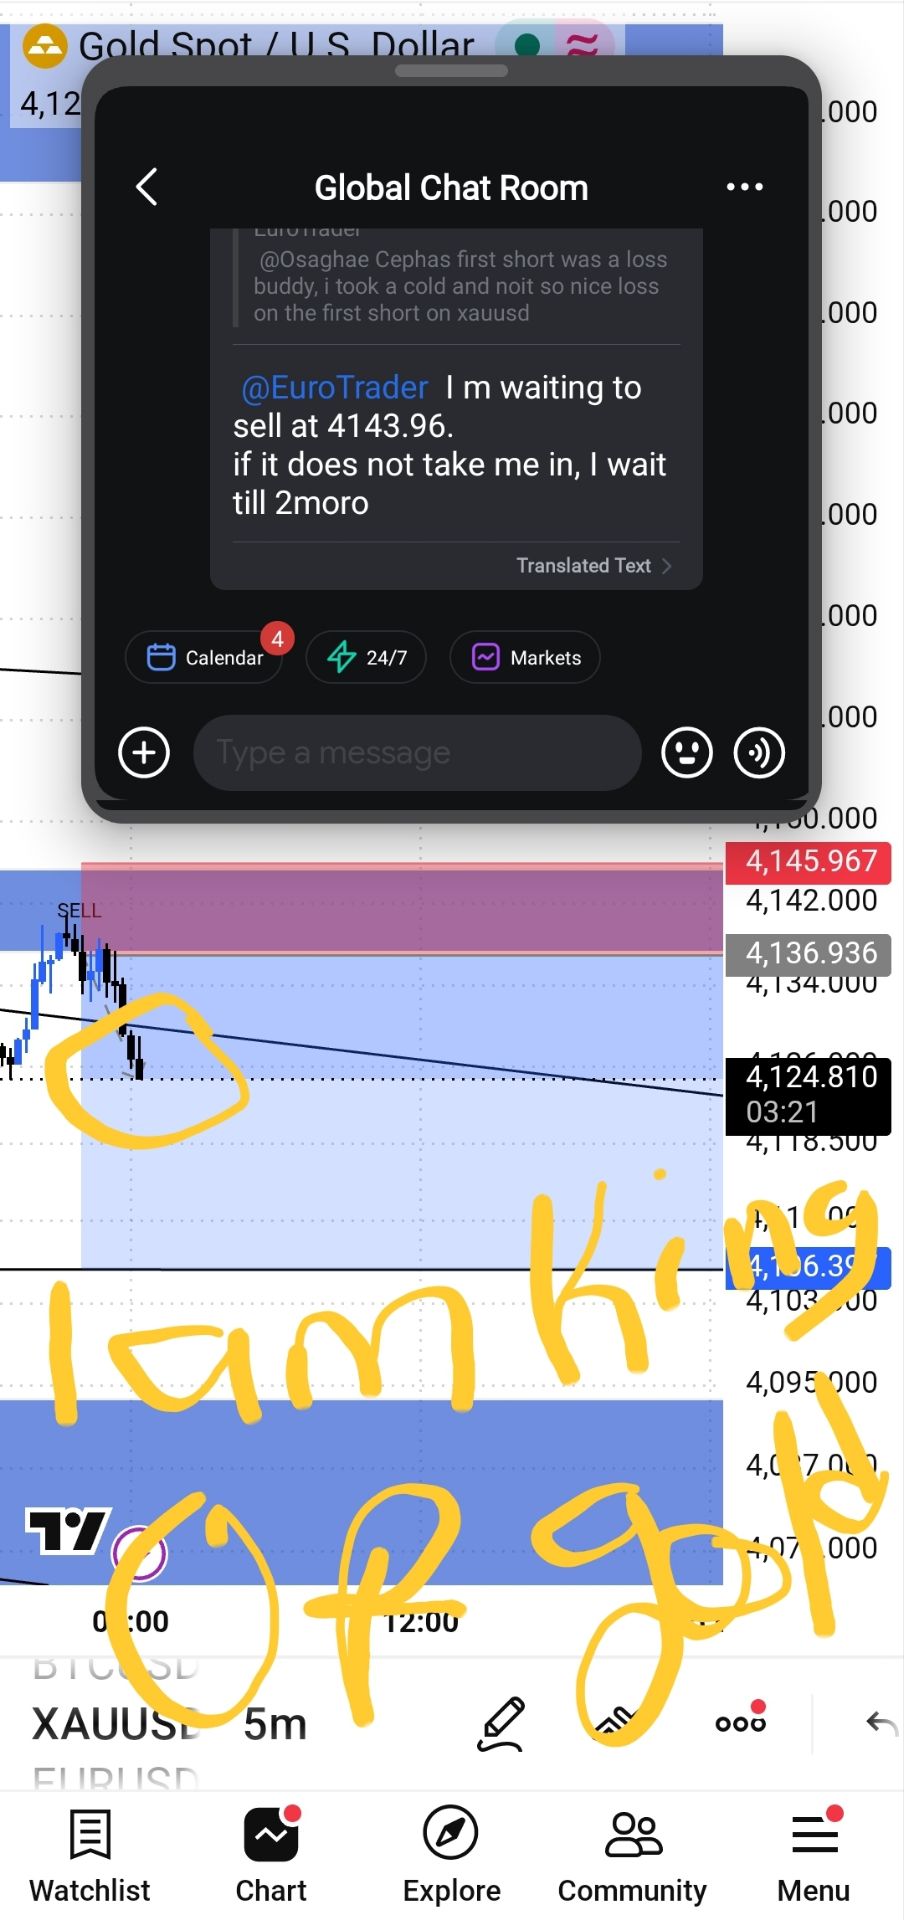
    @EuroTrader I m waiting to sell at 4143.96. if it does not take me in, I wait till 2moro
    EuroTrader flag
    Okpodi luc
    @EuroTrader I m waiting to sell at 4143.96. if it does not take me in, I wait till 2moro
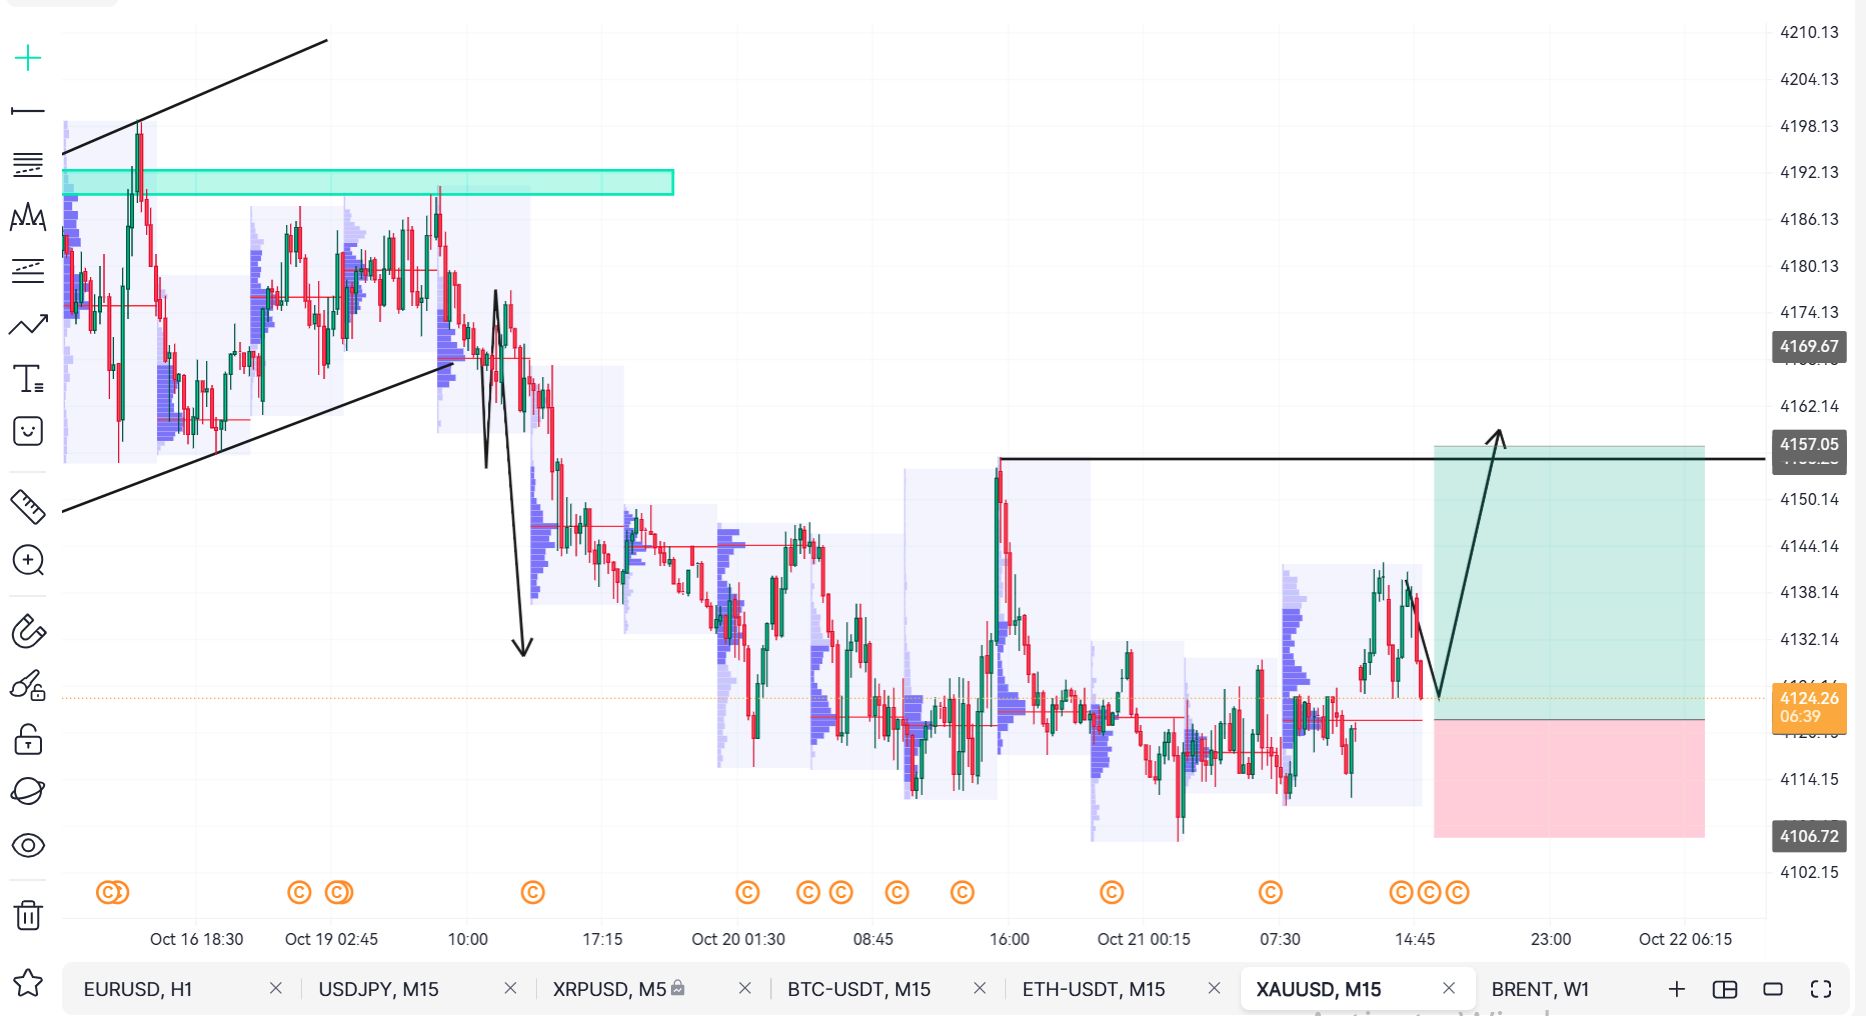
    @Okpodi luc nice plan, me i am looking more at going long in gold to take out that recent highs but i might be wrong
    Oscar flag
    Oscar flag
    yh I am
    EuroTrader flag
    EuroTrader flag
    Oscar
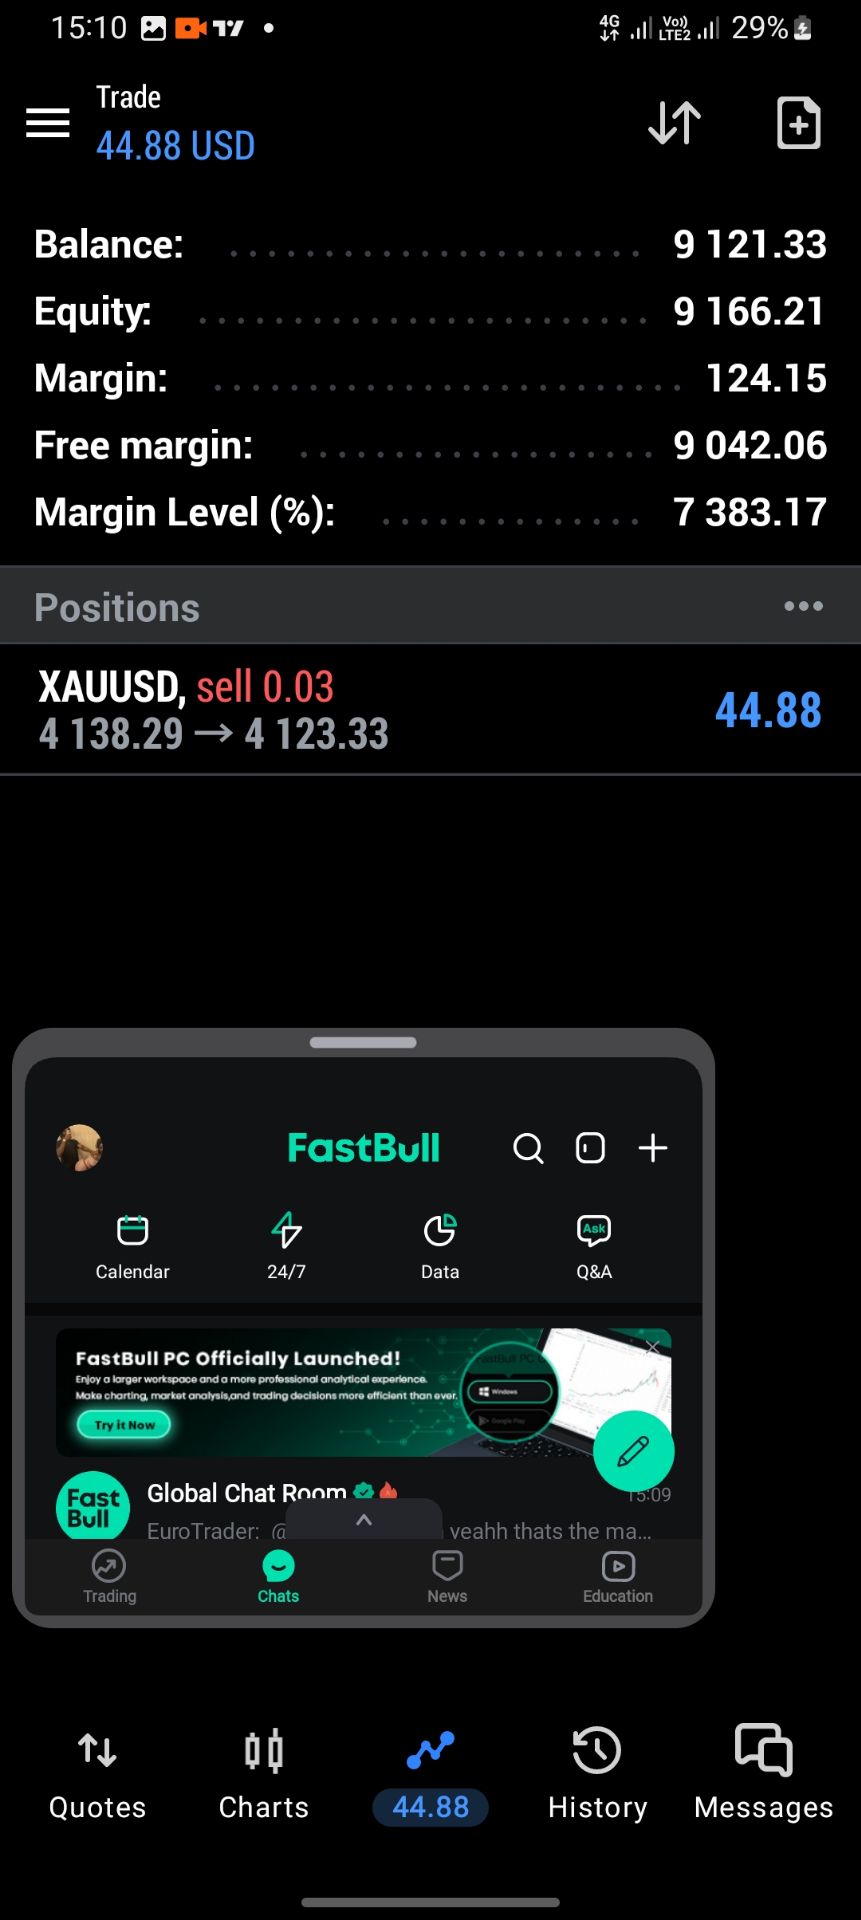
    @Oscarnice shorts you have here on xauusd, that risk to reward ratio is really massive, congrats buddy
    Okpodi luc flag
    EuroTrader
    @Okpodi luc nice plan, me i am looking more at going long in gold to take out that recent highs but i might be wrong
    @EuroTrader, that why you are a good trader ,by putting probability into your trader
    EuroTrader flag
    EuroTrader
    liquidity was taken lower and then we have had a break of structure higher so if i am selling it will be a scalp@Okpodi luc
    Skylark flag
    @Okpodi luc waiting is also a great strategy that many traders out there don't really have though
    EuroTrader flag
    Okpodi luc
    @EuroTrader, that why you are a good trader ,by putting probability into your trader
    @Okpodi luc ohh yeahh thats the markets, we dont talk in absolutes, we talk in probabilities
    Oscar flag
    Skylark flag
    Oscar
    @Oscar@Oscarthe king of gold, I see gold really went in your favour today. weldon bro so what's your next plan resting for the day till tomorrow or what
    Oscar flag
    Skylark
    @Oscar@Oscarthe king of gold, I see gold really went in your favour today. weldon bro so what's your next plan resting for the day till tomorrow or what
    @Skylarkyh bro
    Type here...
    Add Symbol or Code

      No matching data

      All
      Recommend
      Stocks
      Cryptocurrencies
      Central Banks
      Trump Updates
      Featured News
      • All
      • Russia-Ukraine Conflict
      • Middle East Flashpoint
      • All
      • Russia-Ukraine Conflict
      • Middle East Flashpoint

      Search
      Products

      Charts Free Forever

      Chats Q&A with Experts
      Screeners Economic Calendar Data Tools
      Membership Features
      Data Warehouse Market Trends Institutional Data Policy Rates Macro

      Market Trends

      Market Sentiment Order Book Forex Correlations

      Top Indicators

      Charts Free Forever
      Markets

      News

      24/7 Analysis Education

      Latest Views

      Latest Update

      Signals

      Copy Rankings Latest Signals Become a signal provider AI Rating
      Contests
      Brokers

      Overview Brokers Assessment Rankings Regulators News Claims
      Broker listing Forex Brokers Comparison Tool Live Spread Comparison Scam
      Q&A Complaint Scam Alert Videos Tips to Detect Scam
      More

      Business
      Events
      Careers About Us Advertising Help Center

      White Label

      Broker API

      Data API

      Web Plug-ins

      Affiliate Program

      Awards Institution Evaluation IB Seminar Salon Event Exhibition
      Vietnam Thailand Singapore Dubai
      Fans Party Investment Sharing Session
      FastBull Summit BrokersView Expo
      Recent Searches
        Top Searches
          Markets
          Analysis
          User
          24/7
          Economic Calendar
          Education
          Data
          • Names
          • Latest
          • Prev

          View All

          No data

          Scan to Download

          Faster Charts, Chat Faster!

          Download
          English
          • English
          • Español
          • العربية
          • Bahasa Indonesia
          • Bahasa Melayu
          • Tiếng Việt
          • ภาษาไทย
          • Français
          • Italiano
          • Türkçe
          • Русский язык
          • 简中
          • 繁中
          Open Account
          Search
          Products
          Charts Free Forever
          Markets
          News
          Signals

          Copy Rankings Latest Signals Become a signal provider AI Rating
          Contests
          Brokers

          Overview Brokers Assessment Rankings Regulators News Claims
          Broker listing Forex Brokers Comparison Tool Live Spread Comparison Scam
          Q&A Complaint Scam Alert Videos Tips to Detect Scam
          More

          Business
          Events
          Careers About Us Advertising Help Center

          White Label

          Broker API

          Data API

          Web Plug-ins

          Affiliate Program

          Awards Institution Evaluation IB Seminar Salon Event Exhibition
          Vietnam Thailand Singapore Dubai
          Fans Party Investment Sharing Session
          FastBull Summit BrokersView Expo

          USD/JPY Remains Range-Bound as BoJ and Fed Signals Drive Sentiment

          Warren Takunda

          Traders' Opinions

          Summary:

          The Yen rebounds toward 158.00 against the US Dollar as hawkish BoJ comments revive expectations of a December rate hike. Meanwhile, traders await the Fed meeting for clues about the timing of potential US rate increases.

          SELL USDJPY
          EXP
          TRADING

          157.900

          Entry Price

          154.800

          TP

          160.000

          SL

          158.046 -0.105 -0.07%

          0.0

          Pips

          Flat

          154.800

          TP

          Exit Price

          157.900

          Entry Price

          160.000

          SL
          The Japanese Yen is regaining ground against the US Dollar on Wednesday, with USD/JPY retreating toward 158.00 after reaching an intraday high near 158.40. The recovery comes despite weaker Japanese trade balance data, as hawkish remarks from a senior Bank of Japan official reinforce expectations of further monetary tightening. Nevertheless, the pair remains within the horizontal trading range that has prevailed over the past three weeks.
          BoJ Deputy Governor Ryozo Himino said that Japan’s underlying inflation is approaching the central bank’s 2% target, while financial conditions remain accommodative and medium- to long-term inflation expectations continue to rise. These comments have strengthened the case for another interest rate increase, with markets anticipating a potential 25-basis-point hike before year-end, possibly at the December 17 meeting.
          The remarks have helped offset the impact of the disappointing trade figures, suggesting that investors remain focused on the BoJ’s policy outlook rather than near-term economic weakness alone. In my assessment, the Yen’s recovery reflects growing sensitivity to signals that Japan’s prolonged period of accommodative monetary policy could gradually give way to further tightening.
          Meanwhile, the US Dollar remains under pressure as traders prepare for the Federal Reserve’s upcoming policy meeting, where a pause is widely anticipated. However, uncertainty surrounding the Middle East and elevated oil prices continue to provide some support for the Greenback through safe-haven demand.
          Commerzbank analysts note that markets have increasingly priced in a potential Fed rate hike in December, with the possibility of another increase by the middle of next year also being considered. The bank cautions that a hawkish pause next week could provide short-term support for the Dollar as policymakers maintain a restrictive stance. Conversely, any indication that the Fed is becoming less hawkish could prompt markets to scale back tightening expectations and weigh further on the currency.
          For USD/JPY, the contrasting policy outlooks of the BoJ and Fed remain central to the near-term direction. Further hawkish signals from Japan could extend the Yen’s recovery, while a more restrictive-than-expected Fed message could revive Dollar demand. Until either catalyst pushes the pair out of its recent range, continued consolidation remains a possibility.

          Technical AnalysisUSD/JPY Remains Range-Bound as BoJ and Fed Signals Drive Sentiment_1

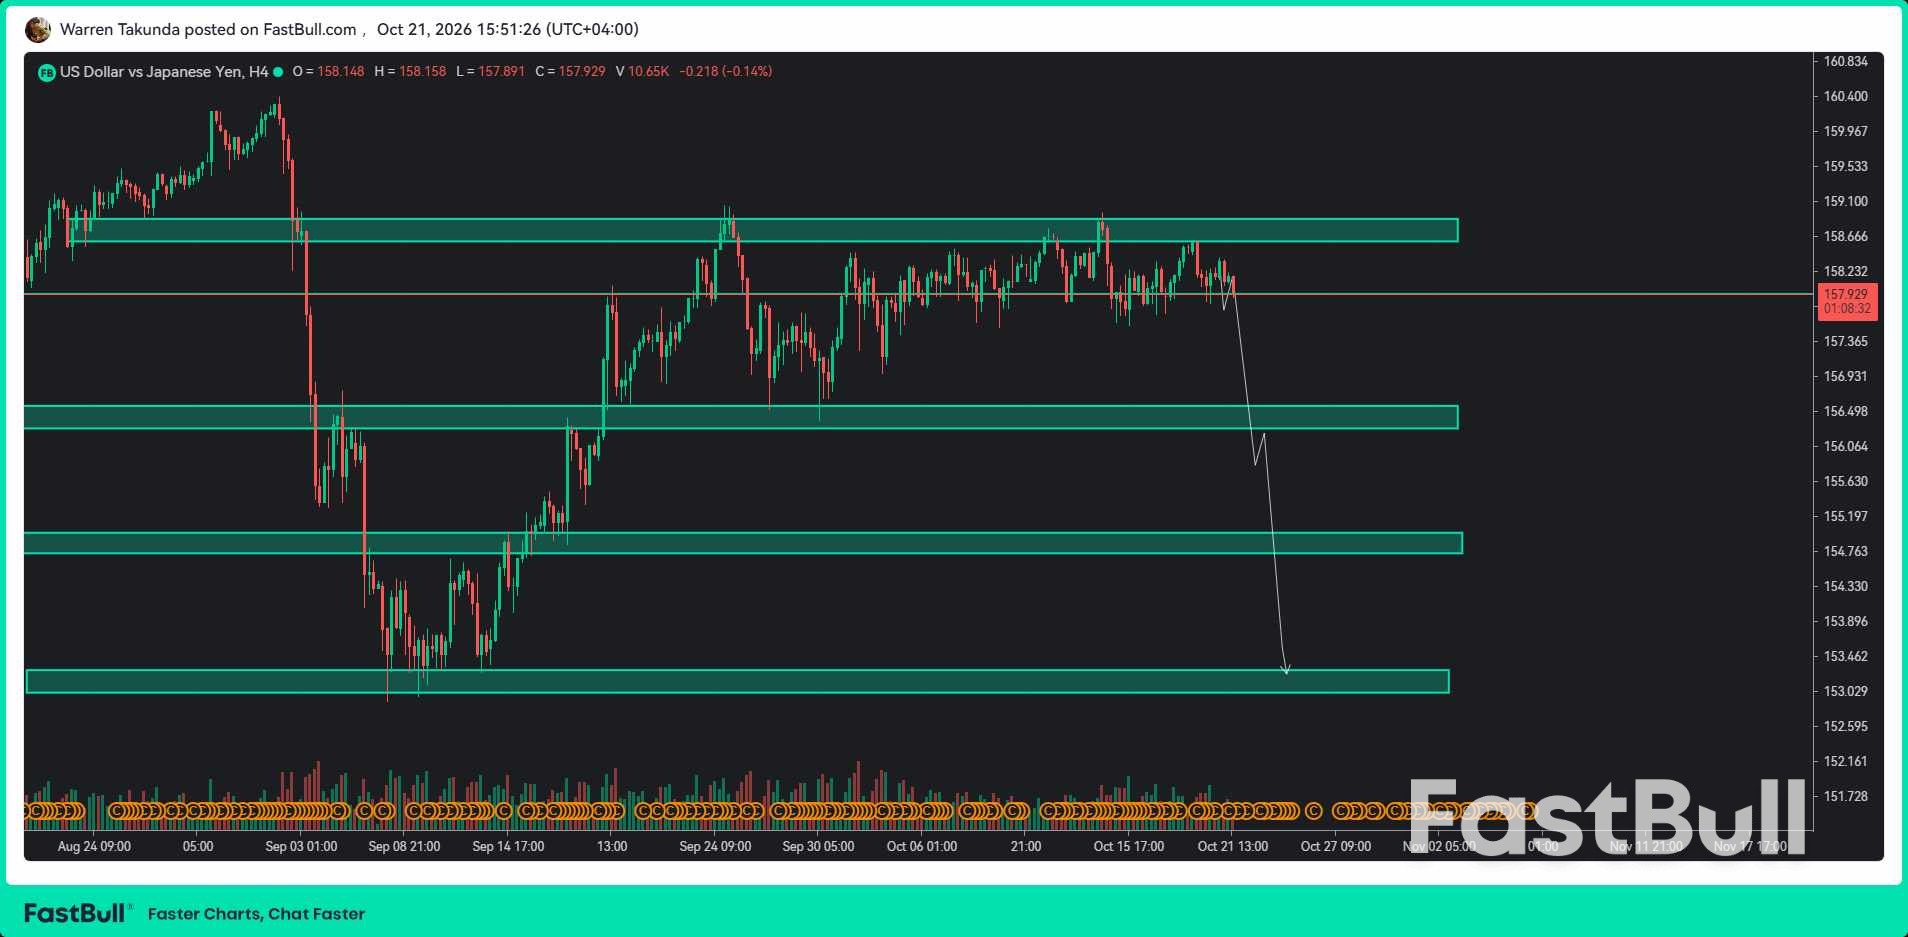
          USD/JPY is showing signs of bearish pressure on the H4 timeframe, with price trading around 157.93 after repeatedly failing to establish a sustained breakout above the 158.50–158.80 resistance zone. The pair has spent the past several sessions consolidating within a relatively narrow range, but the latest price action suggests that sellers are attempting to regain control and push the market toward lower support levels.
          The immediate resistance zone lies around 158.50–158.80, where previous upward attempts encountered selling pressure. As long as the pair remains below this region, the near-term outlook favors a potential downside continuation. Price is currently hovering around 157.90–158.00, an important short-term area to watch. A decisive break below this level could open the way toward the 156.20–156.50 support zone, where buyers may attempt to slow the decline.
          If bearish momentum strengthens and the first support zone fails to hold, USD/JPY could extend its losses toward 154.70–154.95. Further selling pressure may expose the broader support region around 153.00–153.35, which represents the lower target area illustrated on the chart. Reaching this level would require a substantial extension of the current decline, so price reactions at intermediate support zones will be important.
          On the upside, a recovery above 158.00 followed by a sustained move through 158.50–158.80 would weaken the immediate bearish setup and potentially extend consolidation. However, repeated failures near resistance suggest that buyers have yet to establish convincing upward momentum.
          Overall, the H4 structure favors a bearish scenario while USD/JPY remains below 158.50–158.80. A confirmed breakdown below the current trading area could trigger further selling toward 156.40, followed by 154.80 and potentially 153.20. Traders should monitor the reaction around 157.90 and the first support zone for confirmation, as a temporary rebound remains possible within the broader range.

          TRADE RECOMMENDATION

          SELL USD/JPY
          ENTRY PRICE: 157.90
          STOP LOSS: 160.00
          TAKE PROFIT: 154.80
          Risk Warnings and Disclaimers
          You understand and acknowledge that there is a high degree of risk involved in trading. Following any strategies or investment methods may lead to potential losses. The content on the site is provided by our contributors and analysts for information purposes only. You are solely responsible for determining whether any trading assets, securities, strategy, or any other product is suitable for investing based on your own investment objectives and financial situation.
          Add to Favorites
          Share
          FastBull
          Copyright © 2026 FastBull Ltd

          728 RM B 7/F GEE LOK IND BLDG NO 34 HUNG TO RD KWUN TONG KLN HONG KONG

          TelegramInstagramTwitterfacebooklinkedin
          App Store Google Play Android Windows
          Products
          Charts

          Chats

          Q&A with Experts
          Screeners
          Economic Calendar
          Data
          Tools
          Membership
          Features
          Function
          Markets
          Copy Trading
          Latest Signals
          Contests
          24/7
          Analysis
          Education
          Company
          Careers
          About Us
          Contact Us
          Advertising
          Download FastBull
          Help Center
          Feedback
          User Agreement
          Privacy Policy
          Personal Information Protection Statement
          Business

          White Label

          Broker API

          Data API

          Web Plug-ins

          Poster Maker

          Affiliate Program

          Risk Disclosure

          The risk of loss in trading financial instruments such as stocks, FX, commodities, futures, bonds, ETFs and crypto can be substantial. You may sustain a total loss of the funds that you deposit with your broker. Therefore, you should carefully consider whether such trading is suitable for you in light of your circumstances and financial resources.

          No decision to invest should be made without thoroughly conducting due diligence by yourself or consulting with your financial advisors. Our web content might not suit you since we don't know your financial conditions and investment needs. Our financial information might have latency or contain inaccuracy, so you should be fully responsible for any of your trading and investment decisions. The company will not be responsible for your capital loss.

          Without getting permission from the website, you are not allowed to copy the website's graphics, texts, or trademarks. Intellectual property rights in the content or data incorporated into this website belong to its providers and exchange merchants.

          Not Logged In

          Log in to access more features

          Connect Broker
          Become a signal provider
          Help Center
          Customer Service
          Dark Mode
          Price Up/Down Colors

          Log In

          Sign Up

          Position
          Layout
          Fullscreen
          Default to Chart
          The chart page opens by default when you visit fastbull.com