


Markets
Analysis
User
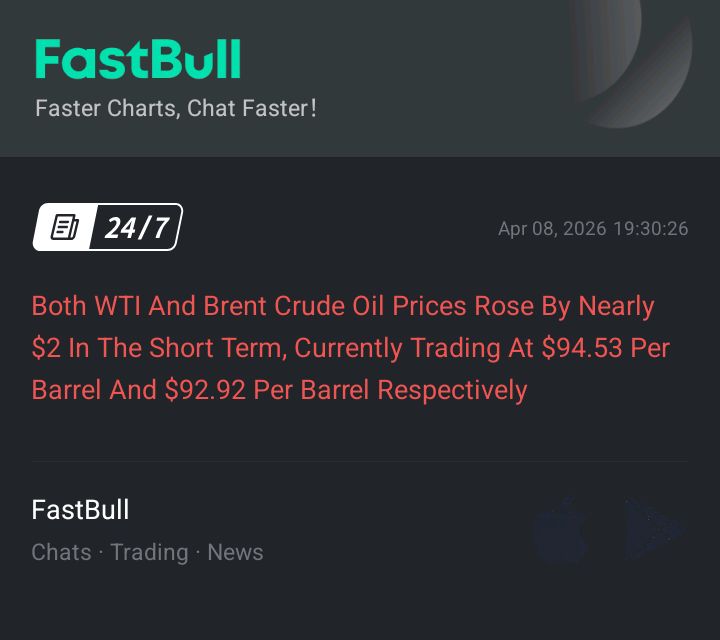
24/7
Economic Calendar
Education
Data
- Names
- Latest
- Prev


The Euro fell against the British Pound for a third consecutive session on Wednesday, with EUR/GBP testing the critical 0.8700 support level as a last-minute US-Iran ceasefire deal — struck less than two hours before Trump's deadline — unleashed a wave of risk appetite that disproportionately benefited the Pound over the common currency, even as weak economic data from both the UK and Eurozone failed to derail the broader relief rally.
0.87000
Entry Price
0.85500
TP
0.87450
SL
0.0
Pips
Flat
0.85500
TP
Exit Price
0.87000
Entry Price
0.87450
SL

728 RM B 7/F GEE LOK IND BLDG NO 34 HUNG TO RD KWUN TONG KLN HONG KONG


The risk of loss in trading financial instruments such as stocks, FX, commodities, futures, bonds, ETFs and crypto can be substantial. You may sustain a total loss of the funds that you deposit with your broker. Therefore, you should carefully consider whether such trading is suitable for you in light of your circumstances and financial resources.
No decision to invest should be made without thoroughly conducting due diligence by yourself or consulting with your financial advisors. Our web content might not suit you since we don't know your financial conditions and investment needs. Our financial information might have latency or contain inaccuracy, so you should be fully responsible for any of your trading and investment decisions. The company will not be responsible for your capital loss.
Without getting permission from the website, you are not allowed to copy the website's graphics, texts, or trademarks. Intellectual property rights in the content or data incorporated into this website belong to its providers and exchange merchants.
Not Logged In
Log in to access more features


Log In
Sign Up


