


- USDX
- XAUUSD
- XAGUSD
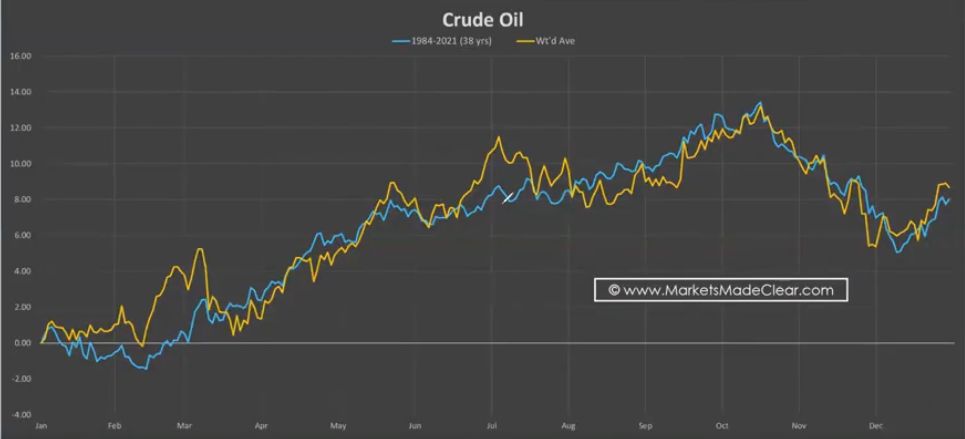
- WTI


Markets
Analysis
User
24/7
Economic Calendar
Education
Data
- Names
- Latest
- Prev


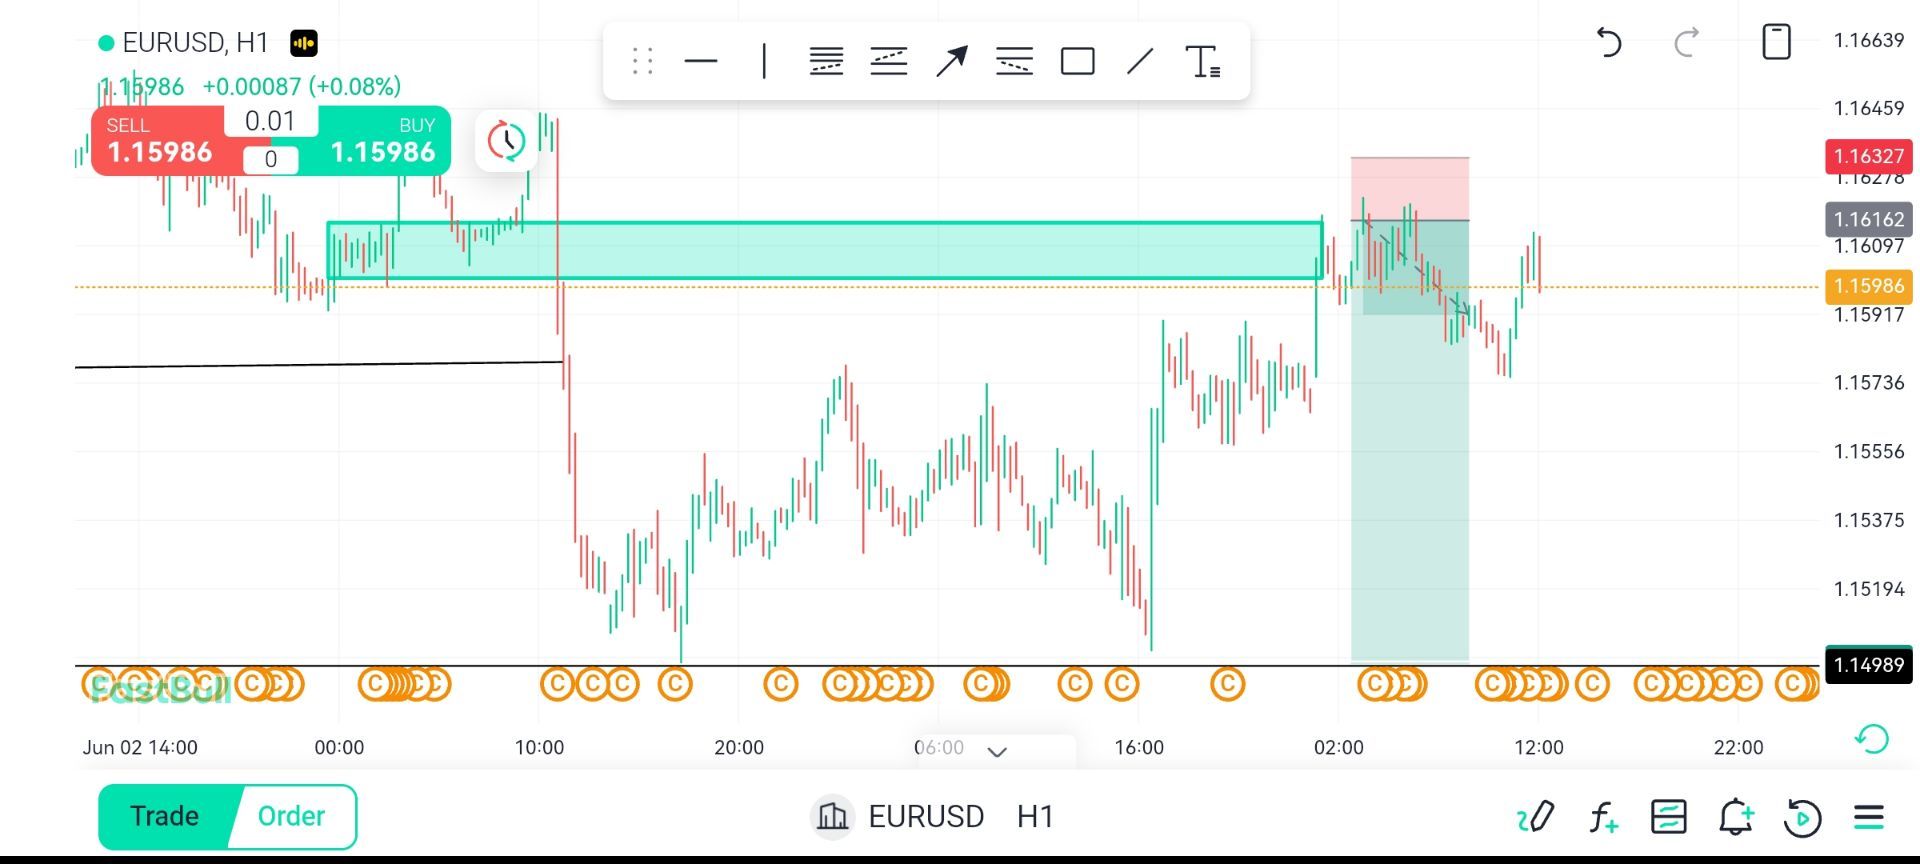


The implementation of the U.S.-Iran agreement could reduce the likelihood of further Fed rate hikes, prompting policymakers to adopt a wait-and-see approach or even soften their hawkish guidance, which would weigh on the U.S. dollar. However, market uncertainty surrounding the incoming Fed Chair may limit the euro's upside in the short term.
1.16183
Entry Price
1.14927
TP
1.16535
SL
--
Pips
PENDING
1.14927
TP
Exit Price
1.16183
Entry Price
1.16535
SL


728 RM B 7/F GEE LOK IND BLDG NO 34 HUNG TO RD KWUN TONG KLN HONG KONG


The risk of loss in trading financial instruments such as stocks, FX, commodities, futures, bonds, ETFs and crypto can be substantial. You may sustain a total loss of the funds that you deposit with your broker. Therefore, you should carefully consider whether such trading is suitable for you in light of your circumstances and financial resources.
No decision to invest should be made without thoroughly conducting due diligence by yourself or consulting with your financial advisors. Our web content might not suit you since we don't know your financial conditions and investment needs. Our financial information might have latency or contain inaccuracy, so you should be fully responsible for any of your trading and investment decisions. The company will not be responsible for your capital loss.
Without getting permission from the website, you are not allowed to copy the website's graphics, texts, or trademarks. Intellectual property rights in the content or data incorporated into this website belong to its providers and exchange merchants.
Not Logged In
Log in to access more features


Log In
Sign Up


