• Trade
  • Markets
  • Copy
  • Contests
  • 24/7
  • Calendar
  • Q&A
  • Chats
Screeners
SYMBOL
LAST
BID
ASK
HIGH
LOW
NET CHG.
%CHG.
SPREAD
SOURCE
SPX
S&P 500 Index
7483.25
7483.25
7483.25
7540.75
7427.55
+0.03
0.00%
--
--
DJI
Dow Jones Industrial Average
52900.06
52900.06
52900.06
52903.85
52448.91
+594.81
+ 1.14%
--
--
IXIC
NASDAQ Composite Index
25832.66
25832.66
25832.66
26261.09
25630.51
-207.36
-0.80%
--
--
USDX
US Dollar Index
100.460
100.460
100.540
100.720
100.420
-0.150
-0.15%
--
--
EURUSD
Euro / US Dollar
1.14516
1.14516
1.14523
1.14546
1.14204
+0.00187
+ 0.16%
--
--
GBPUSD
Pound Sterling / US Dollar
1.33718
1.33718
1.33727
1.33770
1.33341
+0.00267
+ 0.20%
--
--
XAUUSD
Gold / US Dollar
4176.02
4176.02
4176.41
4195.31
4120.98
+52.90
+ 1.28%
--
--
WTI
Light Sweet Crude Oil
69.016
69.016
69.046
69.143
68.292
+0.636
+ 0.93%
--
--

Community Accounts

Signal Accounts
--
Profit Accounts
--
Loss Accounts
--
View More

Become a signal provider

Sell trading signals to earn additional income

View More

Guide to Copy Trading

Get started with ease and confidence

View More

Signal Accounts for Members

All Signal Accounts

Best Return
  • Best Return
  • Best P/L
  • Best MDD
Past 1W
  • Past 1W
  • Past 1M
  • Past 1Y

All Contests

  • All
  • Recommend
  • Stocks
  • Cryptocurrencies
  • Central Banks
  • Trump Updates
  • Featured News
Top News Only
Share

The South Korean Presidential Office Announced That South Korean President Lee Jae-myung Will Visit Mongolia From July 9 To 11

Share

European Central Bank President Lagarde Hinted That She Might Run In The French Presidential Election

Share

The South Korean Presidential Office Announced That South Korean President Lee Jae-myung Will Attend The NATO Summit In Ankara From July 7 To 8

Share

The China Earthquake Networks Center Officially Determined That A Magnitude 3.0 Earthquake Occurred At 12:44 On July 3 In Haixi Prefecture, Qinghai Province (37.86 Degrees North Latitude, 95.40 Degrees East Longitude), With A Focal Depth Of 10 Kilometers

Share

This Year's No. 10 Typhoon, "Maysak," Is Expected To Make Landfall In Hainan, Becoming The First Typhoon To Strike China This Year

Share

The Thai National Shipping Association: The Thai Baht Should Weaken To Boost Exports

Share

A Magnitude 6.4 Earthquake Struck Off The Northwest Coast Of Japan's Miyako Island

Share

Russian News Outlet Vesti Reports That Local Officials Say An Industrial Facility In Russia’s Belgorod Region Caught Fire Following An Attack By Ukraine

Share

Russia Has Taken Measures To Stabilize Domestic Fuel Supplies

Share

Both WTI And Brent Crude Oil Prices Rose 1% During The Day

Share

The China Earthquake Networks Center Officially Reported That A 6.2-magnitude Earthquake Occurred At 10:31 A.m. On July 3 In The Sea Area Near Halmahera Island, Indonesia (1.85 Degrees North Latitude, 127.40 Degrees East Longitude), With A Focal Depth Of 120 Kilometers

Share

U.S. Stocks Are Closed Today; Gold, Silver, And Oil Trading Will End Early

Share

Hainan Has Raised Its Emergency Response For Flood And Typhoon Control To Level III

Share

Vietnam's Exports In June Rose By 28.1% Year-on-Year, Up From The Previous Reading Of 18.00%

Share

Vietnam's Trade Balance In June Was -$2.644 Billion, Compared To -$5.21 Billion Previously

Share

Vietnam's Industrial Value-added Year-on-Year Growth Rate In June Was 12.7%, Compared With The Previous Reading Of 8.80%

Share

The Yield On Japan's 10-year Government Bond Fell 1.5 Basis Points To 2.765%

Share

LME Nickel Rose 2.00% Intraday, Currently Trading At $16,638.90 Per Ton

Share

Vietnam's GDP Annualized Rate In Q2 Was 8.39%, Compared To The Previous Reading Of 7.83%

Share

Yu Wenjian, Chairman Of The Shanghai Gold Exchange, Has Been Appointed As Governor Of The Shanghai Branch Of China's Central Bank

TIME
ACT
FCST
PREV
IMPACT
Italy Unemployment Rate (SA) (May)

A:--

F: --

P: --

EURUSD
  • EURUSD
  • XAUUSD
  • XAGUSD
  • WTI
  • USDX
France 10-Year OAT Auction Avg. Yield

A:--

F: --

P: --

EURUSD
  • EURUSD
  • XAUUSD
  • XAGUSD
  • WTI
  • USDX
Euro Zone Unemployment Rate (May)

A:--

F: --

P: --
EURUSD
  • EURUSD
  • XAUUSD
  • XAGUSD
  • WTI
  • USDX
U.S. Government Employment (Jun)

A:--

F: --

P: --

USDX
  • USDX
  • XAUUSD
  • XAGUSD
  • WTI
U.S. Average Hourly Wage MoM (SA) (Jun)

A:--

F: --

P: --

XAUUSD
  • XAUUSD
  • XAGUSD
  • WTI
  • USDX
U.S. U6 Unemployment Rate (SA) (Jun)

A:--

F: --

P: --

XAUUSD
  • XAUUSD
  • XAGUSD
  • WTI
  • USDX
U.S. Unemployment Rate (SA) (Jun)

A:--

F: --

P: --

XAUUSD
  • XAUUSD
  • XAGUSD
  • WTI
  • USDX
U.S. Nonfarm Payrolls (SA) (Jun)

A:--

F: --

P: --
XAUUSD
  • XAUUSD
  • XAGUSD
  • WTI
  • USDX
U.S. Weekly Initial Jobless Claims (SA)

A:--

F: --

P: --
XAUUSD
  • XAUUSD
  • XAGUSD
  • WTI
  • USDX
U.S. Average Hourly Wage YoY (Jun)

A:--

F: --

P: --

XAUUSD
  • XAUUSD
  • XAGUSD
  • WTI
  • USDX
U.S. Average Weekly Working Hours (SA) (Jun)

A:--

F: --

P: --

XAUUSD
  • XAUUSD
  • XAGUSD
  • WTI
  • USDX
U.S. Initial Jobless Claims 4-Week Avg. (SA)

A:--

F: --

P: --
XAUUSD
  • XAUUSD
  • XAGUSD
  • WTI
  • USDX
U.S. Weekly Continued Jobless Claims (SA)

A:--

F: --

P: --
XAUUSD
  • XAUUSD
  • XAGUSD
  • WTI
  • USDX
U.S. Private Nonfarm Payrolls (SA) (Jun)

A:--

F: --

P: --
XAUUSD
  • XAUUSD
  • XAGUSD
  • WTI
  • USDX
U.S. Manufacturing Employment (SA) (Jun)

A:--

F: --

P: --
USDX
  • USDX
  • XAUUSD
  • XAGUSD
  • WTI
U.S. Labor Force Participation Rate (SA) (Jun)

A:--

F: --

P: --

XAUUSD
  • XAUUSD
  • XAGUSD
  • WTI
  • USDX
Canada Manufacturing PMI (SA) (Jun)

A:--

F: --

P: --

USDCAD
  • USDCAD
  • XAUUSD
  • XAGUSD
  • WTI
  • USDX
U.S. Factory Orders MoM (Excl. Defense) (May)

A:--

F: --

P: --

USDX
  • USDX
  • XAUUSD
  • XAGUSD
  • WTI
U.S. Factory Orders MoM (May)

A:--

F: --

P: --
USDX
  • USDX
  • XAUUSD
  • XAGUSD
  • WTI
U.S. Factory Orders MoM (Excl. Transport) (May)

A:--

F: --

P: --
USDX
  • USDX
  • XAUUSD
  • XAGUSD
  • WTI
U.S. EIA Weekly Natural Gas Stocks Change

A:--

F: --

P: --

WTI
  • WTI
  • XAUUSD
  • XAGUSD
  • USDX
U.S. Weekly Total Oil Rig Count

A:--

F: --

P: --

WTI
  • WTI
  • XAUUSD
  • XAGUSD
  • USDX
U.S. Weekly Total Rig Count

A:--

F: --

P: --

WTI
  • WTI
  • XAUUSD
  • XAGUSD
  • USDX
U.S. Weekly Treasuries Held by Foreign Central Banks

A:--

F: --

P: --

USDX
  • USDX
  • XAUUSD
  • XAGUSD
  • WTI
Japan IHS Markit Composite PMI (Jun)

A:--

F: --

P: --

USDJPY
  • USDJPY
  • XAUUSD
  • XAGUSD
  • WTI
Japan IHS Markit Services PMI (Jun)

A:--

F: --

P: --

USDJPY
  • USDJPY
  • XAUUSD
  • XAGUSD
  • WTI
China, Mainland Caixin Composite PMI (Jun)

A:--

F: --

P: --

XAUUSD
  • XAUUSD
  • XAGUSD
  • WTI
  • USDX
China, Mainland Caixin Services PMI (Jun)

A:--

F: --

P: --

XAUUSD
  • XAUUSD
  • XAGUSD
  • WTI
  • USDX
India IHS Markit Composite PMI (Jun)

A:--

F: --

P: --

XAUUSD
  • XAUUSD
  • XAGUSD
  • WTI
  • USDX
India HSBC Services PMI Final (Jun)

A:--

F: --

P: --

XAUUSD
  • XAUUSD
  • XAGUSD
  • WTI
  • USDX
Russia IHS Markit Services PMI (Jun)

--

F: --

P: --

France Industrial Output MoM (SA) (May)

--

F: --

P: --

Turkey PPI YoY (Jun)

--

F: --

P: --

Turkey CPI YoY (Jun)

--

F: --

P: --

South Africa IHS Markit Composite PMI (SA) (Jun)

--

F: --

P: --

Italy Composite PMI (Jun)

--

F: --

P: --

Italy Services PMI (SA) (Jun)

--

F: --

P: --

Germany Composite PMI Final (SA) (Jun)

--

F: --

P: --

Italy Retail Sales MoM (SA) (May)

--

F: --

P: --

Euro Zone Composite PMI Final (Jun)

--

F: --

P: --

Euro Zone Services PMI Final (Jun)

--

F: --

P: --

U.K. Composite PMI Prelim (Jun)

--

F: --

P: --

U.K. Services PMI Prelim (Jun)

--

F: --

P: --

U.K. Official Reserves Changes (Jun)

--

F: --

P: --

Turkey Trade Balance (Jun)

--

F: --

P: --

Mexico Consumer Confidence Index (Jun)

--

F: --

P: --

Brazil IHS Markit Composite PMI (Jun)

--

F: --

P: --

Brazil IHS Markit Services PMI (Jun)

--

F: --

P: --

Saudi Arabia IHS Markit Composite PMI (Jun)

--

F: --

P: --

Germany Construction PMI (SA) (Jun)

--

F: --

P: --

Euro Zone Sentix Investor Confidence Index (Jul)

--

F: --

P: --

U.K. Markit/CIPS Construction PMI (Jun)

--

F: --

P: --

Euro Zone PPI MoM (May)

--

F: --

P: --

Euro Zone PPI YoY (May)

--

F: --

P: --

Euro Zone Retail Sales MoM (May)

--

F: --

P: --

Euro Zone Retail Sales YoY (May)

--

F: --

P: --

Canada National Economic Confidence Index

--

F: --

P: --

U.S. ISM Non-Manufacturing PMI (Jun)

--

F: --

P: --

U.S. ISM Non-Manufacturing Inventories Index (Jun)

--

F: --

P: --

Q&A with Experts
    • All
    • Chatrooms
    • Groups
    • Friends
    Roberd Hud flag
    SlowBear ⛅
    @4921165Oh trying to login, Robert, my estrange friend, i think the inability to login could be internet issue
    This was the inddicator
    SlowBear ⛅ flag
    Roberd Hud
    @Roberd HudOh yesh this is the EA you were talkigm about yesterday right?
    Roberd Hud flag
    som kys will not work on my kyboar, so b6ar with mi
    SlowBear ⛅ flag
    Roberd Hud
    This was the inddicator
    @Roberd HudI see, thanks for sharing, can you share the gold but on daily chart
    EuroTrader flag
    Roberd Hud
    @Roberd Hudis this an algorithm or you were the one that put the lines yourself in the charts
    SlowBear ⛅ flag
    Roberd Hud
    som kys will not work on my kyboar, so b6ar with mi
    @Roberd Hud No problem bro, i am here with you till the ebnd
    EuroTrader flag
    Roberd Hud
    This was the inddicator
    @Roberd Hudwhat is the name of the indicator cause it looks like it automatically plots support and resistance levels on the charts
    SlowBear ⛅ flag
    Roberd Hud
    @Roberd Hud Also is it possible that the chart is shifted to the left a little so there can be some gap in the right side
    Roberd Hud flag
    this is on mor in
    Roberd Hud flag
    Roberd Hud flag
    but i on't kno th nami
    SlowBear ⛅ flag
    Roberd Hud
    this is on mor in
    @Roberd HudAlright i will check that one out
    SlowBear ⛅ flag
    Roberd Hud
    @Roberd HudOh well this looks like a normal indicator, what is the name of this one?
    EuroTrader flag
    Roberd Hud
    but i on't kno th nami
    @Roberd Hudthis looks like the super trend indicator if i am correct about it? whats the name of the indicator
    Roberd Hud flag
    SlowBear ⛅
    @Roberd Hud Also is it possible that the chart is shifted to the left a little so there can be some gap in the right side
    @SlowBear ⛅ i am not sure how to do it in mt5
    SlowBear ⛅ flag
    Roberd Hud
    but i on't kno th nami
    @Roberd HudOh you do not know the name, can you get one that is trend based indicator, that will be real good
    SlowBear ⛅ flag
    Roberd Hud
    @SlowBear ⛅ i am not sure how to do it in mt5
    @Roberd HudOh alright, so those are just picture from mql5 right?
    Roberd Hud flag
    gold stuff indicator mt5
    SlowBear ⛅ flag
    Roberd Hud
    gold stuff indicator mt5
    @Roberd Hud Oh that is interesting, i will like to see more of this bro
    Ashok Sen flag
    4200 will hit gold
    Type here...
    Add Symbol or Code

      No matching data

      All
      Recommend
      Stocks
      Cryptocurrencies
      Central Banks
      Trump Updates
      Featured News
      • All
      • Russia-Ukraine Conflict
      • Middle East Flashpoint
      • All
      • Russia-Ukraine Conflict
      • Middle East Flashpoint

      Search
      Products

      Charts Free Forever

      Chats Q&A with Experts
      Screeners Economic Calendar Data Tools
      Membership Features
      Data Warehouse Market Trends Institutional Data Policy Rates Macro

      Market Trends

      Market Sentiment Order Book Forex Correlations

      Top Indicators

      Charts Free Forever
      Markets

      News

      24/7 Analysis Education

      Latest Views

      Latest Update

      Signals

      Copy Rankings Latest Signals Become a signal provider AI Rating
      Contests
      Brokers

      Overview Brokers Assessment Rankings Regulators News Claims
      Broker listing Forex Brokers Comparison Tool Live Spread Comparison Scam
      Q&A Complaint Scam Alert Videos Tips to Detect Scam
      More

      Business
      Events
      Careers About Us Advertising Help Center

      White Label

      Broker API

      Data API

      Web Plug-ins

      Affiliate Program

      Awards Institution Evaluation IB Seminar Salon Event Exhibition
      Vietnam Thailand Singapore Dubai
      Fans Party Investment Sharing Session
      FastBull Summit BrokersView Expo
      Recent Searches
        Top Searches
          Markets
          Analysis
          User
          24/7
          Economic Calendar
          Education
          Data
          • Names
          • Latest
          • Prev

          View All

          No data

          Scan to Download

          Faster Charts, Chat Faster!

          Download
          English
          • English
          • Español
          • العربية
          • Bahasa Indonesia
          • Bahasa Melayu
          • Tiếng Việt
          • ภาษาไทย
          • Français
          • Italiano
          • Türkçe
          • Русский язык
          • 简中
          • 繁中
          Open Account
          Search
          Products
          Charts Free Forever
          Markets
          News
          Signals

          Copy Rankings Latest Signals Become a signal provider AI Rating
          Contests
          Brokers

          Overview Brokers Assessment Rankings Regulators News Claims
          Broker listing Forex Brokers Comparison Tool Live Spread Comparison Scam
          Q&A Complaint Scam Alert Videos Tips to Detect Scam
          More

          Business
          Events
          Careers About Us Advertising Help Center

          White Label

          Broker API

          Data API

          Web Plug-ins

          Affiliate Program

          Awards Institution Evaluation IB Seminar Salon Event Exhibition
          Vietnam Thailand Singapore Dubai
          Fans Party Investment Sharing Session
          FastBull Summit BrokersView Expo

          Short Covering Fuels Rebound, but the Daily Bearish Structure Remains Intact

          Eva Chen
          Summary:

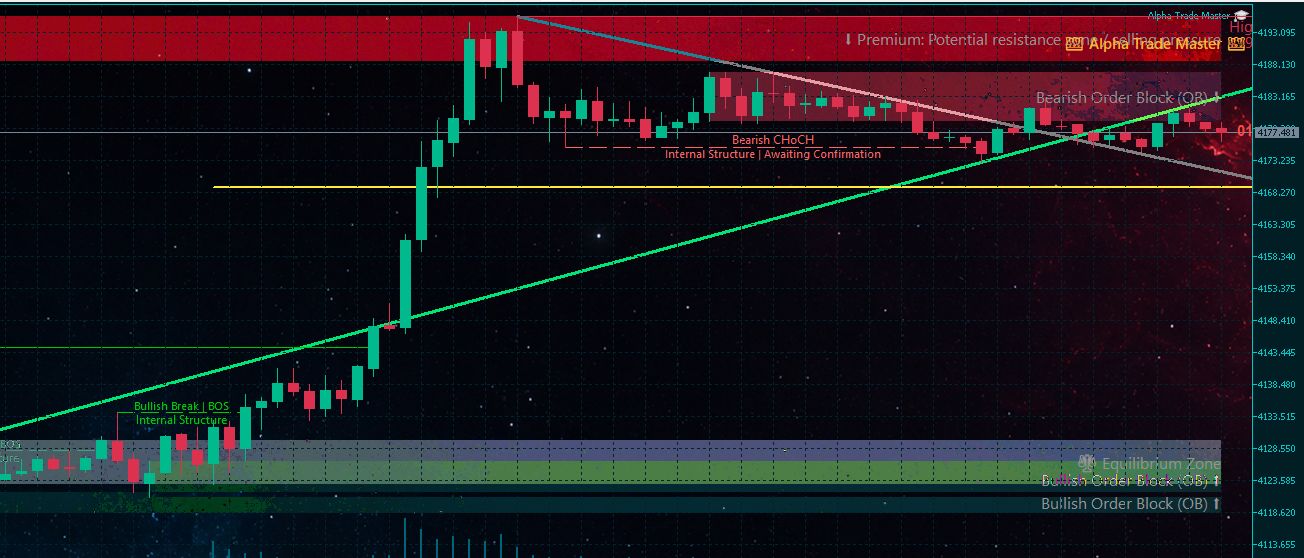
          Ethereum (ETH) gained approximately 4% over the past 24 hours, triggering roughly $101 million in leveraged liquidations across the crypto market. Of that total, $67.2 million came from short positions, making short covering the primary driver behind the latest rally. Although the short squeeze has propelled prices sharply higher, the daily chart continues to show ETHUSD trading beneath its key moving averages, suggesting that the medium-term bearish trend has yet to improve materially.

          SELL ETH-USDT
          EXP
          PENDING

          1750.00

          Entry Price

          685.00

          TP

          2000.00

          SL

          1710.66 +9.96 +0.59%

          --

          Pips

          PENDING

          685.00

          TP

          Exit Price

          1750.00

          Entry Price

          2000.00

          SL

          Fundamentals

          The latest rally has been driven primarily by short covering in the derivatives market. Over the past 24 hours, approximately $67.2 million worth of short positions were liquidated, creating a classic short squeeze. The resulting wave of forced buying accelerated ETH's advance. However, at this stage, the move appears to be more of a technical rebound driven by position adjustments rather than the beginning of a sustainable trend reversal.
          Recently, overall sentiment in the cryptocurrency market has remained cautious as global liquidity conditions have tightened, spot ETF outflows have persisted, and on-chain active addresses have declined, leading institutional investors to adopt a more defensive stance.
          Nevertheless, several structural factors continue to provide medium- to long-term support. Ethereum's staking ratio continues to rise, locking up an increasing portion of the circulating supply and helping to ease selling pressure. In addition, on-chain data shows that several large whale wallets have continued accumulating ETH at lower price levels, suggesting that long-term investors remain confident and that panic selling has yet to emerge.
          Short Covering Fuels Rebound, but the Daily Bearish Structure Remains Intact_1

          Technical Analysis

          From a daily chart perspective, ETHUSD remains firmly within a bearish trend. Price continues to trade below the 20-day, 50-day, and 100-day moving averages, which are currently clustered between $1,668 and $1,998. The continued bearish alignment of these moving averages indicates that the medium-term downtrend remains intact.
          Momentum indicators paint a mixed picture. The Relative Strength Index (RSI) is hovering around 45, remaining in neutral-to-bearish territory, while the Stochastic Oscillator is also near neutral levels. This suggests that bearish momentum is gradually fading, but buyers have yet to gain sufficient control to trigger a decisive bullish reversal. For now, ETH is more likely to remain in a base-building consolidation phase than enter a sustained uptrend.
          On the upside, the first major resistance lies near the 20-day moving average at $1,668. A successful breakout above this level could open the door toward $1,743 and $1,806. The 50-day moving average, located around $1,819, coincides with a previous high-volume trading zone, forming a significant supply area. Only a decisive move above this region would allow ETH to target $1,910 and eventually $2,020.
          On the downside, traders should closely monitor the descending trendline for support. If ETH breaks back below this trendline, $1,525 will serve as the first key support level. A decisive break below that level could expose the longer-term bottom near $1,156.
          Overall, the current rebound appears to be a technical recovery driven by short covering rather than a confirmed trend reversal. Unless ETH can decisively break above its major moving average resistance cluster, the rally should be viewed as a correction within a broader bearish trend rather than the beginning of a new bull market.

          Trading Recommendation

          Direction: Sell
          Entry: 1750
          Target: 685
          Stop Loss: 2000
          Valid Until: 2026-07-31 23:55
          Support: 1512, 1386, 1236
          Resistance: 1638, 1721, 1850
          Risk Warnings and Disclaimers
          You understand and acknowledge that there is a high degree of risk involved in trading. Following any strategies or investment methods may lead to potential losses. The content on the site is provided by our contributors and analysts for information purposes only. You are solely responsible for determining whether any trading assets, securities, strategy, or any other product is suitable for investing based on your own investment objectives and financial situation.
          Add to Favorites
          Share
          FastBull
          Copyright © 2026 FastBull Ltd

          728 RM B 7/F GEE LOK IND BLDG NO 34 HUNG TO RD KWUN TONG KLN HONG KONG

          TelegramInstagramTwitterfacebooklinkedin
          App Store Google Play Android Windows
          Products
          Charts

          Chats

          Q&A with Experts
          Screeners
          Economic Calendar
          Data
          Tools
          Membership
          Features
          Function
          Markets
          Copy Trading
          Latest Signals
          Contests
          24/7
          Analysis
          Education
          Company
          Careers
          About Us
          Contact Us
          Advertising
          Download FastBull
          Help Center
          Feedback
          User Agreement
          Privacy Policy
          Personal Information Protection Statement
          Business

          White Label

          Broker API

          Data API

          Web Plug-ins

          Poster Maker

          Affiliate Program

          Risk Disclosure

          The risk of loss in trading financial instruments such as stocks, FX, commodities, futures, bonds, ETFs and crypto can be substantial. You may sustain a total loss of the funds that you deposit with your broker. Therefore, you should carefully consider whether such trading is suitable for you in light of your circumstances and financial resources.

          No decision to invest should be made without thoroughly conducting due diligence by yourself or consulting with your financial advisors. Our web content might not suit you since we don't know your financial conditions and investment needs. Our financial information might have latency or contain inaccuracy, so you should be fully responsible for any of your trading and investment decisions. The company will not be responsible for your capital loss.

          Without getting permission from the website, you are not allowed to copy the website's graphics, texts, or trademarks. Intellectual property rights in the content or data incorporated into this website belong to its providers and exchange merchants.

          Not Logged In

          Log in to access more features

          Connect Broker
          Become a signal provider
          Help Center
          Customer Service
          Dark Mode
          Price Up/Down Colors

          Log In

          Sign Up

          Position
          Layout
          Fullscreen
          Default to Chart
          The chart page opens by default when you visit fastbull.com