• Trade
  • Markets
  • Copy
  • Contests
  • 24/7
  • Calendar
  • Q&A
  • Chats
Screeners
SYMBOL
LAST
BID
ASK
HIGH
LOW
NET CHG.
%CHG.
SPREAD
SPX
S&P 500 Index
6506.49
6506.49
6506.49
6593.21
6473.51
-100.00
-1.51%
--
DJI
Dow Jones Industrial Average
45577.46
45577.46
45577.46
46068.31
45369.39
-443.96
-0.96%
--
IXIC
NASDAQ Composite Index
21647.62
21647.62
21647.62
21997.09
21522.75
-443.06
-2.01%
--
USDX
US Dollar Index
99.240
99.240
99.320
99.570
99.020
+0.170
+ 0.17%
--
EURUSD
Euro / US Dollar
1.15697
1.15697
1.15720
1.15945
1.15243
-0.00187
-0.16%
--
GBPUSD
Pound Sterling / US Dollar
1.33380
1.33380
1.33420
1.34418
1.32986
-0.00918
-0.68%
--
XAUUSD
Gold / US Dollar
4493.07
4493.07
4493.07
4735.68
4477.27
-155.65
-3.35%
--
WTI
Light Sweet Crude Oil
97.340
97.340
97.717
98.253
92.063
+3.262
+ 3.47%
--

Community Accounts

Signal Accounts
--
Profit Accounts
--
Loss Accounts
--
View More

Become a signal provider

Sell trading signals to earn additional income

View More

Guide to Copy Trading

Get started with ease and confidence

View More

Signal Accounts for Members

All Signal Accounts

Best Return
  • Best Return
  • Best P/L
  • Best MDD
Past 1W
  • Past 1W
  • Past 1M
  • Past 1Y

All Contests

  • All
  • Trump Updates
  • Recommend
  • Stocks
  • Cryptocurrencies
  • Central Banks
  • Featured News
Top News Only
Share

[Resolv Vulnerability Discovered: 100K Usdc Mints 50M Usr, Leading To 74.2% Price Plunge] March 22, According To On-Chain Analyst Ai Yi (@Ai_9684Xtpa), Resolv Has Reportedly Experienced A Vulnerability Where 100,000 Usdc Minted 50 Million Usr, Causing Usr To Momentarily Plummet To $0.257, A 74.2% Drop. It Has Since Rebounded To $0.7847. The Resolv Team Has Not Yet Responded

Share

[Polymarket Prediction: Probability Of "Bitcoin Dropping To $65K In March" Rises To 49%] March 22Nd, As Bitcoin Briefly Dropped Below $69,000, The Probability Of "Bitcoin Dropping To $65,000 In March" On Polymarket Rose To 49%. Additionally, The Probability Of Dropping To $60,000 Is 16%, And Rising To $80,000 Is 12%

Share

Saudi Defense Ministry Says It Detected Three Missiles Launched Toward Riyadh, One Of The Missiles Was Intercepted While Two Fell In An Uninhabited Area

Share

[Polls Show Trump'S Approval Rating At Record Low, Disapproval Rate Reaches 63%] March 22, A New Poll By American Research Group (Arg) Shows That Trump'S Approval Rating Hits A Record Low, With A Disapproval Rating Of 63% And An Approval Rating Of Only 34%

Share

[In The Past 4 Hours, The Entire Network Has Seen $254 Million In Liquidations, Primarily From Long Positions] March 22, According To Coinglass Data, The Entire Network Liquidated $254 Million In The Past 4 Hours, With $236 Million In Long Liquidations And $17.73 Million In Short Liquidations

Share

[A Whale Went Long On 739,000 Hype Tokens, Equivalent To $28.98 Million] March 22Nd, According To Onchain Lens Monitoring, A Whale Created A New Wallet "0X18E" And Went Long 80,000 Hype Tokens (About $3 Million) With 10X Leverage.Currently, The Whale Holds Long Positions Totaling 739,000 Hype Tokens (About $28.98 Million) Across 4 Wallets With 10X Leverage. Additionally, They Hold 45,562 Hype Spot Tokens (About $1.79 Million)

Share

Qatar's Defense Ministry Says A Qatari Helicopter Had Technical Malfunction During A Routine Duty, Which Led To Its Crash In The Regional Waters Of The Country

Share

Israeli Military Says It Is Currently Conducting Strikes In Tehran

Share

["Rug Pull" Ethereum Meme Coin Suffers Another Complete Liquidation, Total Losses Now Exceed $30 Million] March 22, According To Hyperinsight Monitoring, Due To The Crypto Market Downturn, The 25X Ethereum Long Position Held By "Big Brother Whale" Huang Licheng'S Address Has Been Liquidated Again. Currently, Only $158,000 In Assets Remains In The Address, With Total Losses Exceeding $30 Million

Share

Unified Combatant Command Of The Iranian Armed Forces Says If Iran's Fuel And Energy Infrastructure Is Attacked, All Energy Infrastructures Belonging To The USA In The Region Will Be Targeted

Share

Energy Minister: Australia Fuel Supply Strong, No Plans To Ration

Share

Ukmto Says It Has Received A Report Of An Incident 15 Nautical Miles North Of United Arab Emirates's Sharjah

Share

Nuclear-Powered Royal Navy Submarine Hms Anson Arrives In Arabian Sea, With Capacity To Launch Strikes On Iran If Conflict Escalates - Daily Mail

Share

Airstrikes Target Iraq's Popular Mobilisation Forces Positions Near Mosul - Security Sources

Share

Israeli Military Spokesperson Says Air Defences Operated But Did Not Intercept The Missile That Targeted Southern Israel

Share

After Iranian Strikes On Southern Israel, Netanyahu Says In Statement: This Is A Very Difficult Evening In The Campaign For Our Future

Share

Two Explosive Drones Target Iranian Opposition Group Positions Near Sulaymaniyah In Iraqi Kurdistan -Security Sources

Share

WHO Chief Tedros: Sudan's Al Deain Teaching Hospital Is Currently Non-Functional Due To Extensive Damage From Attack

Share

Ukrainian Officials: Power, Water Cut Off In Parts Of Kyiv

Share

Ukraine Says Talks On Resolving War To Continue In US On Sunday

TIME
ACT
FCST
PREV
U.S. New Home Sales Annualized MoM (Jan)

A:--

F: --

P: --
U.S. Conference Board Leading Economic Index MoM (Feb)

A:--

F: --

P: --

U.S. Conference Board Coincident Economic Index MoM (Feb)

A:--

F: --

P: --

U.S. Conference Board Leading Economic Index (Feb)

A:--

F: --

P: --

U.S. Conference Board Lagging Economic Index MoM (Feb)

A:--

F: --

P: --

U.S. Wholesale Inventory MoM (SA) (Jan)

A:--

F: --

P: --

U.S. EIA Weekly Natural Gas Stocks Change

A:--

F: --

P: --

U.S. 10-Year TIPS Auction Avg. Yield

A:--

F: --

P: --

Argentina Trade Balance (Feb)

A:--

F: --

P: --

U.S. Weekly Treasuries Held by Foreign Central Banks

A:--

F: --

P: --

China, Mainland 1-Year Loan Prime Rate (LPR)

A:--

F: --

P: --

China, Mainland 5-Year Loan Prime Rate

A:--

F: --

P: --

Germany PPI YoY (Feb)

A:--

F: --

P: --
Germany PPI MoM (Feb)

A:--

F: --

P: --
Euro Zone Current Account (Not SA) (Jan)

A:--

F: --

P: --

Euro Zone Current Account (SA) (Jan)

A:--

F: --

P: --

Euro Zone Trade Balance (Not SA) (Jan)

A:--

F: --

P: --
Euro Zone Trade Balance (SA) (Jan)

A:--

F: --

P: --
Russia Key Rate

A:--

F: --

P: --

U.K. CBI Industrial Prices Expectations (Mar)

A:--

F: --

P: --

U.K. CBI Industrial Trends - Orders (Mar)

A:--

F: --

P: --

Canada New Housing Price Index MoM (Feb)

A:--

F: --

P: --

Canada Industrial Product Price Index YoY (Feb)

A:--

F: --

P: --
Canada Retail Sales MoM (SA) (Jan)

A:--

F: --

P: --

Canada Industrial Product Price Index MoM (Feb)

A:--

F: --

P: --
Canada Core Retail Sales MoM (SA) (Jan)

A:--

F: --

P: --
U.S. Weekly Total Rig Count

A:--

F: --

P: --

U.S. Weekly Total Oil Rig Count

A:--

F: --

P: --

Argentina GDP YoY (Constant Prices) (Q4)

A:--

F: --

P: --

Argentina Retail Sales YoY (Jan)

A:--

F: --

P: --

Turkey Consumer Confidence Index (Mar)

--

F: --

P: --

Mexico Retail Sales MoM (Jan)

--

F: --

P: --

Canada National Economic Confidence Index

--

F: --

P: --

U.S. Chicago Fed National Activity Index (Feb)

--

F: --

P: --

U.S. Construction Spending MoM (Jan)

--

F: --

P: --

ECB Chief Economist Lane Speaks
South Korea PPI MoM (Feb)

--

F: --

P: --

Japan CPI MoM (Feb)

--

F: --

P: --

Japan National CPI YoY (Feb)

--

F: --

P: --

Japan National CPI MoM (Feb)

--

F: --

P: --

Japan National Core CPI YoY (Feb)

--

F: --

P: --

Japan National CPI MoM (Not SA) (Feb)

--

F: --

P: --

Turkey Capacity Utilization (Mar)

--

F: --

P: --

U.K. 10-Year Note Auction Yield

--

F: --

P: --

U.K. CBI Distributive Trades (Mar)

--

F: --

P: --

U.K. CBI Retail Sales Expectations Index (Mar)

--

F: --

P: --

Mexico Economic Activity Index YoY (Jan)

--

F: --

P: --

U.S. Nonfarm Unit Labor Cost Final (Q4)

--

F: --

P: --

U.S. Weekly Redbook Index YoY

--

F: --

P: --

U.S. Richmond Fed Services Revenue Index (Mar)

--

F: --

P: --

U.S. Richmond Fed Manufacturing Shipments Index (Mar)

--

F: --

P: --

U.S. Richmond Fed Manufacturing Composite Index (Mar)

--

F: --

P: --

ECB Chief Economist Lane Speaks
U.S. 2-Year Note Auction Avg. Yield

--

F: --

P: --

U.S. API Weekly Refined Oil Stocks

--

F: --

P: --

U.S. API Weekly Gasoline Stocks

--

F: --

P: --

U.S. API Weekly Cushing Crude Oil Stocks

--

F: --

P: --

U.S. API Weekly Crude Oil Stocks

--

F: --

P: --

Australia RBA Trimmed Mean CPI YoY (Feb)

--

F: --

P: --

U.K. CPI MoM (Feb)

--

F: --

P: --

U.K. Retail Prices Index MoM (Feb)

--

F: --

P: --

Q&A with Experts
    • All
    • Chatrooms
    • Groups
    • Friends
    EuroTrader flag
    EuroTrader
    @MatthewEth and BTC are correlated so if eth gives us a clear direction lower then Bitcoin should follow
    Matthew flag
    EuroTrader
    @MatthewEth and BTC are correlated so if eth gives us a clear direction lower then Bitcoin should follow
    @EuroTraderI'll have a look at eth also
    Matthew flag
    EuroTrader
    @MatthewEth and BTC are correlated so if eth gives us a clear direction lower then Bitcoin should follow
    @EuroTraderI never knew they were correlated .just learnt this for the first time today
    EuroTrader flag
    Matthew
    @EuroTraderI never knew they were correlated .just learnt this for the first time today
    @MatthewOhh woww. They are the top two crypto currency on the markets so they gotta be correlated
    EuroTrader flag
    Matthew
    @EuroTraderI never knew they were correlated .just learnt this for the first time today
    @MatthewYou could also add Solana and maybe bnb to the list of correlated crypto currencies
    EuroTrader flag
    Matthew
    @EuroTraderI never knew they were correlated .just learnt this for the first time today
    @Matthewseems I gotta call it a day here. It's been a long day in the markets for me today. have a lovely time mate.
    Matthew flag
    EuroTrader
    @Matthewseems I gotta call it a day here. It's been a long day in the markets for me today. have a lovely time mate.
    @EuroTraderokay thank you
    Matthew flag
    EuroTrader
    @Matthewseems I gotta call it a day here. It's been a long day in the markets for me today. have a lovely time mate.
    @EuroTraderI'll do so e studies on this .thank you for opening my eyes to it
    Aegon flag
    请问标准专业高手这三个有什么区别
    Aegon flag
    账户
    Aegon flag
    我刚刚开户
    Aegon flag
    我开了一个标准账号
    Sanjeev Ku flag
    Sanjeev Ku
    btc sell below 70375 tgt 69496/68476 .low so far 70441 and high 70877. no strength in btc so better to look for sell than buy CMP 70586 but sell only below 70375
    both tgt hit btc
    Ikeh Sunday flag
    3597520 flag
    各位推推 还没下班吗
    Ikeh Sunday flag
    Z4EXROXR92 flag
    RPGFX
    @Z4EXROXR92Can you give an example? I do not seem to understand what you mean
    @RPGFX. claro... quiero las correlaciones de DIVISAS con índices, materias primas e.t.c. todas correlacionadas
    3813509 flag
    Aegon go with standard
    3813509 flag
    Later u can update
    Z4EXROXR92 flag
    3813509
    Later u can update
    @Visitantes3813509ok gracias
    Type here...
    Add Symbol or Code

      No matching data

      All
      Trump Updates
      Recommend
      Stocks
      Cryptocurrencies
      Central Banks
      Featured News
      • All
      • Russia-Ukraine Conflict
      • Middle East Flashpoint
      • All
      • Russia-Ukraine Conflict
      • Middle East Flashpoint

      Search
      Products

      Charts Free Forever

      Chats Q&A with Experts
      Screeners Economic Calendar Data Tools
      Membership Features
      Data Warehouse Market Trends Institutional Data Policy Rates Macro

      Market Trends

      Market Sentiment Order Book Forex Correlations

      Top Indicators

      Charts Free Forever
      Markets

      News

      24/7 Analysis Education

      Latest Views

      Latest Update

      Signals

      Copy Rankings Latest Signals Become a signal provider AI Rating
      Contests
      Brokers

      Overview Brokers Assessment Rankings Regulators News Claims
      Broker listing Forex Brokers Comparison Tool Live Spread Comparison Scam
      Q&A Complaint Scam Alert Videos Tips to Detect Scam
      More

      Business
      Events
      Careers About Us Advertising Help Center

      White Label

      Broker API

      Data API

      Web Plug-ins

      Affiliate Program

      Awards Institution Evaluation IB Seminar Salon Event Exhibition
      Vietnam Thailand Singapore Dubai
      Fans Party Investment Sharing Session
      FastBull Summit BrokersView Expo
      Recent Searches
        Top Searches
          Markets
          Analysis
          User
          24/7
          Economic Calendar
          Education
          Data
          • Names
          • Latest
          • Prev

          View All

          No data

          Scan to Download

          Faster Charts, Chat Faster!

          Download App
          English
          • English
          • Español
          • العربية
          • Bahasa Indonesia
          • Bahasa Melayu
          • Tiếng Việt
          • ภาษาไทย
          • Français
          • Italiano
          • Türkçe
          • Русский язык
          • 简中
          • 繁中
          Open Account
          Search
          Products
          Charts Free Forever
          Markets
          News
          Signals

          Copy Rankings Latest Signals Become a signal provider AI Rating
          Contests
          Brokers

          Overview Brokers Assessment Rankings Regulators News Claims
          Broker listing Forex Brokers Comparison Tool Live Spread Comparison Scam
          Q&A Complaint Scam Alert Videos Tips to Detect Scam
          More

          Business
          Events
          Careers About Us Advertising Help Center

          White Label

          Broker API

          Data API

          Web Plug-ins

          Affiliate Program

          Awards Institution Evaluation IB Seminar Salon Event Exhibition
          Vietnam Thailand Singapore Dubai
          Fans Party Investment Sharing Session
          FastBull Summit BrokersView Expo

          Range Trading Strategy by Selling High and Buying Low

          Eva Chen
          Summary:

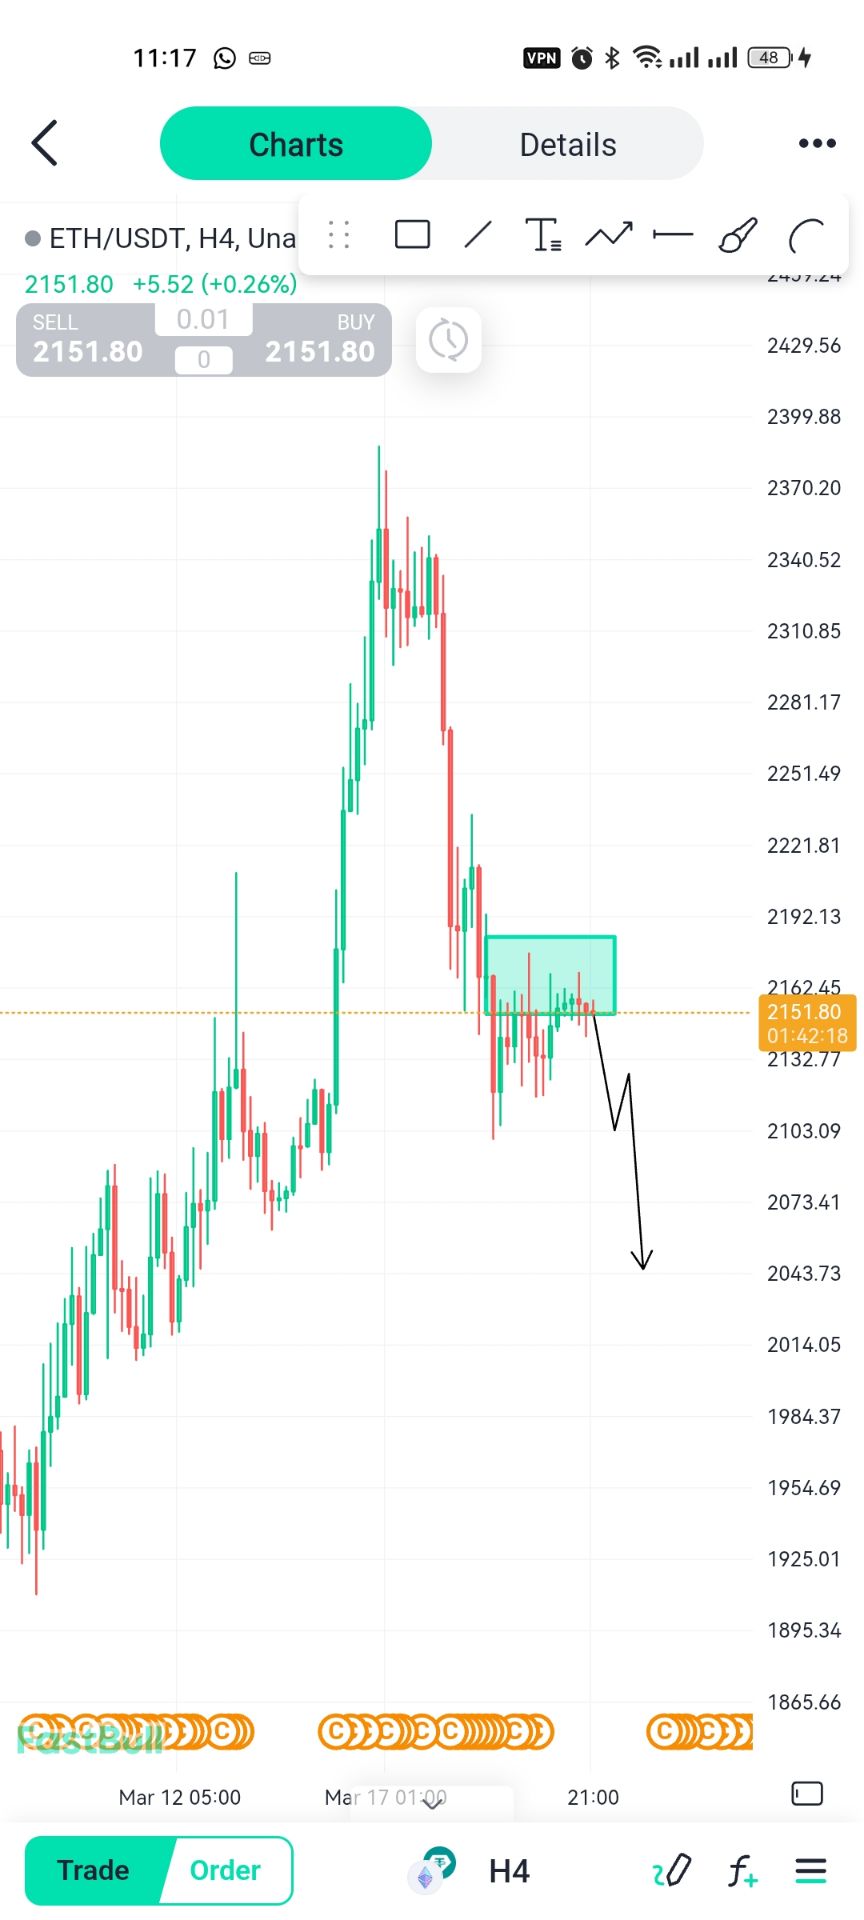
          Ahead of the OPEC+ online meeting scheduled for November 30, the crude oil market may face challenges in rebounding as bearish sentiments strengthen. WTI crude oil futures are currently hovering near $75.00, close to the July lows, due to disputes over production quotas for African member countries by Saudi Arabia and its allies, leading to the postponement of the originally scheduled meeting to this week.

          BUY WTI
          Close Time
          CLOSED

          74.600

          Entry Price

          77.930

          TP

          72.370

          SL

          97.340 +3.262 +3.47%

          302.7

          Pips

          Profit

          72.370

          SL

          77.627

          Exit Price

          74.600

          Entry Price

          77.930

          TP

          Fundamentals

          The current overall stability in the oil market, with prices holding within recent ranges, has everyone's attention focused on the (delayed) OPEC+ meeting set for Thursday. According to recent news over the past two days, there is growing belief that a compromise on production levels for 2024 is achievable. However, the most likely outcome seems to be a continuation of existing production cuts rather than any new drastic changes.
          This outlook is unlikely to change substantially unless there is an unexpected further cut in production, leading to bearish sentiments in the short term. A key factor influencing this perspective is the rise in US inventory levels. Meanwhile, China, a major participant in global crude oil demand, continues to experience lukewarm economic growth. Despite some positive signs in the Chinese economy, they are not significant enough to markedly alter demand dynamics.
          Another crucial factor in this equation is Saudi Arabia's decision to voluntarily cut an additional 1 million barrels per day, with this reduction plan set to expire at the end of December.
          Traders cautiously anticipate further production cuts by OPEC+. The initial optimism that propelled WTI crude oil to around $80.00 has faded, and bearish options have reached record levels. To restore credibility, OPEC+ may need to deliver a significant surprise.
          Additionally, other indicators in the spot market, including price differentials between specific grades, have been issuing warning signals. Against this backdrop, the International Energy Agency (IEA) predicts a return to oversupply in the market next year. Currently, Saudi Arabia and Russia are expected to extend voluntary production cuts, with market observers suggesting the possibility of further collective cuts.
          WTI crude oil will gather clues this week from inventory data from the American Petroleum Institute (API) and the Energy Information Administration (EIA). An increase in inventories may reflect soft demand or rising supply levels, potentially prompting the selling of crude oil.
          On the other hand, a modest increase or substantial decrease in inventories may reflect weak consumption, keeping traders vigilant about potential economic recession or softening demand for energy commodities.
          Risk appetite may also drive volatility in risk assets, with enhanced risk-taking actions potentially stimulating demand for high-yield assets like crude oil. Conversely, a return of safe-haven funds may trigger a decline in crude oil prices.
          WTI crude oil is still in a downtrend initiated from $93.94. From a technical perspective, the short-term outlook remains bearish, with resistance at $79.98 and support in the range of $63.37-$66.94. Strong support could lead to a rebound. Overall, mid-term range trading should continue to be maintained above $63.67 unless there are significant developments.
          Range Trading Strategy by Selling High and Buying Low_1

          Technical Analysis

          WTI crude oil has formed lower highs and higher lows, and the current price is consolidating within a symmetrical triangle pattern. The price has broken below the support level and may potentially rebound to the resistance level.
          The 100 SMA is above the 200 SMA, indicating that the path of least resistance in the short term is to the upside, and support is more likely to hold than be breached. Additionally, upward pressure aligns with the triangle's top near $77.00, adding strength to its role as an upper limit.
          The stochastic oscillator is entering oversold territory, reflecting exhaustion in the bearish momentum; thus, as the oscillating indicator rebounds, a moderate rally could drive prices higher. Similarly, the RSI seems to be approaching its bottom, suggesting that bullish momentum may return.
          Nevertheless, a breakdown below the triangle's bottom could trigger selling equivalent to the chart pattern's height. Similarly, a breakout above the triangle's top could stimulate a rebound of the same magnitude, with the volatility range around $72-$78. In terms of trading strategy, the focus is on selling high and buying low.

          Trading Recommendations

          Trading Direction: Long
          Entry Price: 74.60
          Target Price: 77.93
          Stop Loss: 72.37
          Valid Until: 2023-12-11 23:55:00
          Support: 74.08, 73.33, 72.36
          Resistance: 78.42, 79.64, 80.85
          Risk Warnings and Disclaimers
          You understand and acknowledge that there is a high degree of risk involved in trading. Following any strategies or investment methods may lead to potential losses. The content on the site is provided by our contributors and analysts for information purposes only. You are solely responsible for determining whether any trading assets, securities, strategy, or any other product is suitable for investing based on your own investment objectives and financial situation.
          Add to Favorites
          Share
          FastBull
          Copyright © 2026 FastBull Ltd

          728 RM B 7/F GEE LOK IND BLDG NO 34 HUNG TO RD KWUN TONG KLN HONG KONG

          TelegramInstagramTwitterfacebooklinkedin
          App Store Google Play Google Play
          Products
          Charts

          Chats

          Q&A with Experts
          Screeners
          Economic Calendar
          Data
          Tools
          Membership
          Features
          Function
          Markets
          Copy Trading
          Latest Signals
          Contests
          24/7
          Analysis
          Education
          Company
          Careers
          About Us
          Contact Us
          Advertising
          Help Center
          Feedback
          User Agreement
          Privacy Policy
          Personal Information Protection Statement
          Business

          White Label

          Broker API

          Data API

          Web Plug-ins

          Poster Maker

          Affiliate Program

          Risk Disclosure

          The risk of loss in trading financial instruments such as stocks, FX, commodities, futures, bonds, ETFs and crypto can be substantial. You may sustain a total loss of the funds that you deposit with your broker. Therefore, you should carefully consider whether such trading is suitable for you in light of your circumstances and financial resources.

          No decision to invest should be made without thoroughly conducting due diligence by yourself or consulting with your financial advisors. Our web content might not suit you since we don't know your financial conditions and investment needs. Our financial information might have latency or contain inaccuracy, so you should be fully responsible for any of your trading and investment decisions. The company will not be responsible for your capital loss.

          Without getting permission from the website, you are not allowed to copy the website's graphics, texts, or trademarks. Intellectual property rights in the content or data incorporated into this website belong to its providers and exchange merchants.

          Not Logged In

          Log in to access more features

          Connect Broker
          Become a signal provider
          Help Center
          Customer Service
          Dark Mode
          Price Up/Down Colors

          Log In

          Sign Up

          Position
          Layout
          Fullscreen
          Default to Chart
          The chart page opens by default when you visit fastbull.com