• Trade
  • Markets
  • Copy
  • Contests
  • 24/7
  • Calendar
  • Q&A
  • Chats
Screeners
SYMBOL
LAST
BID
ASK
HIGH
LOW
NET CHG.
%CHG.
SPREAD
SOURCE
SPX
S&P 500 Index
7340.53
7340.53
7340.53
7415.37
7288.34
-76.06
-1.03%
--
--
DJI
Dow Jones Industrial Average
50759.42
50759.42
50759.42
51463.53
50566.98
-848.75
-1.64%
--
--
IXIC
NASDAQ Composite Index
24328.37
24328.37
24328.37
24547.66
23989.09
-181.39
-0.74%
--
--
USDX
US Dollar Index
103.685
103.685
103.765
103.793
103.473
+0.255
+ 0.25%
--
--
EURUSD
Euro / US Dollar
1.09670
1.09670
1.09678
1.09975
1.09528
-0.00295
-0.27%
--
--
GBPUSD
Pound Sterling / US Dollar
1.31610
1.31610
1.31622
1.32078
1.31475
-0.00439
-0.33%
--
--
XAUUSD
Gold / US Dollar
3776.27
3776.27
3776.68
3857.34
3742.69
-72.65
-1.89%
--
--
WTI
Light Sweet Crude Oil
83.856
83.856
83.886
84.702
82.292
-0.484
-0.57%
--
--

Community Accounts

Signal Accounts
--
Profit Accounts
--
Loss Accounts
--
View More

Become a signal provider

Sell trading signals to earn additional income

View More

Guide to Copy Trading

Get started with ease and confidence

View More

Signal Accounts for Members

All Signal Accounts

Best Return
  • Best Return
  • Best P/L
  • Best MDD
Past 1W
  • Past 1W
  • Past 1M
  • Past 1Y

All Contests

  • All
  • Recommend
  • Stocks
  • Cryptocurrencies
  • Central Banks
  • Trump Updates
  • Featured News
Top News Only
Share

India's Chief Economic Advisor: The Growth Outlook Is More Optimistic Compared To The Beginning Of The Year

Share

Fitch: The Reduction Of The European Central Bank's Balance Sheet Is Nearing Its End

Share

India's Chief Economic Advisor Said That Headwinds Facing India, Including Unstable Relations With The United States And High Energy Prices, Will Ease Next Year

Share

Mexican President Sinbaum: We Have Made Significant Progress In The Process Of Reaching An Agreement With The United States

Share

Mexican President Simbaum: Discussed Trade Issues With US President Trump And His Team On The Sidelines Of The APEC Meeting

Share

Federal Reserve Data Shows That The Effective Federal Funds Rate In The United States Was 3.88% On November 17, With A Trading Volume Of $95 Billion That Day; The Rate Was Also 3.88% On November 16, With A Trading Volume Of $96 Billion

Share

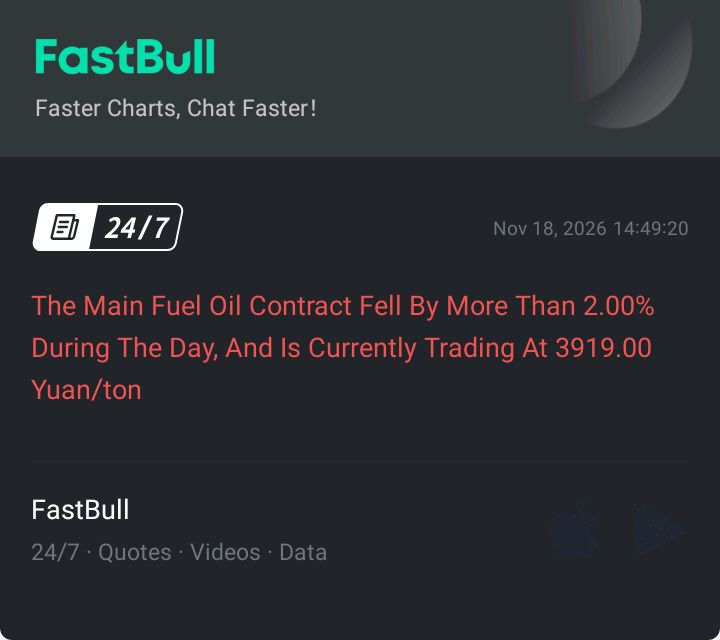
The Main Fuel Oil Contract Fell By More Than 2.00% During The Day, And Is Currently Trading At 3919.00 Yuan/ton

Share

Brazil Accepted An Auction For A $353 Million Foreign Exchange Credit Line

Share

The Mexican Peso Fell 1% Against The Dollar To 18.5960

Share

The Number Of People Claiming Unemployment Insurance In Canada Fell 0.3% Month-over-month In September

Share

The Reserve Bank Of India Will Conduct A 500 Billion Rupee Overnight Floating-rate Reverse Repurchase Auction On November 19

Share

The USD/JPY Pair Rose 0.05% To 159.43

Share

Methanol 2701 Weakened During The Session, With The Decline Widening To 2.05%, And The Latest Price Was 3065 Yuan/ton; The Trading Volume Was Approximately 11.397 Billion Yuan, With An Increase Of 42,200 Lots In Open Interest During The Day, Indicating A Significant Change In Open Interest

Share

LME Copper Prices Fell As Much As 4.2%, Marking The Biggest Drop Since March

Share

European Parliament Member Thierry Mariani Pointed Out That Europe's Attitude Towards Negotiations With Russia Has Changed Rapidly. He Recalled That For The Past Three Years, Europe Had Consistently Claimed That Negotiating With Moscow Was Tantamount To Betrayal. In An Interview, Mariani Stated, "Now, The Same Group Of People In Brussels Are Running Around Trying To Gain A Place At The Negotiating Table, Only To Be Surprised To Find That Nobody Cares About Them At All."

Share

The Most Active Polypropylene Futures Contract Fell 2% Intraday, Currently Trading At 8784.00 Yuan

Share

Both WTI And Brent Crude Oil Prices Fell By About $0.60 In The Short Term, Currently Trading At $85.38 Per Barrel And $92.82 Per Barrel, Respectively

Share

U.S. Energy Secretary Wright Stated That There Is Currently Enough U.S. Liquefied Natural Gas To Meet About One-third Of Poland's Annual Natural Gas Demand

Share

Propylene 2701 Futures Prices Fluctuated More After The Night Session Opened, And The Latest Price Was 8559 Yuan/ton, Down 1.80% On The Day

Share

The Main Shanghai Nickel Futures Contract Fell 2.00% During The Day, Currently Trading At 120,630.00 Yuan/ton

TIME
ACT
FCST
PREV
IMPACT
U.K. CPI MoM (Oct)

A:--

F: --

P: --

GBPUSD
  • GBPUSD
  • XAUUSD
  • XAGUSD
  • WTI
  • USDX
U.K. Retail Prices Index MoM (Oct)

A:--

F: --

P: --

GBPUSD
  • GBPUSD
  • XAUUSD
  • XAGUSD
  • WTI
  • USDX
U.K. CPI YoY (Oct)

A:--

F: --

P: --

GBPUSD
  • GBPUSD
  • XAUUSD
  • XAGUSD
  • WTI
  • USDX
U.K. Input PPI YoY (Not SA) (Oct)

A:--

F: --

P: --

GBPUSD
  • GBPUSD
  • XAUUSD
  • XAGUSD
  • WTI
  • USDX
U.K. Core CPI MoM (Oct)

A:--

F: --

P: --

GBPUSD
  • GBPUSD
  • XAUUSD
  • XAGUSD
  • WTI
  • USDX
U.K. Core CPI YoY (Oct)

A:--

F: --

P: --

GBPUSD
  • GBPUSD
  • XAUUSD
  • XAGUSD
  • WTI
  • USDX
U.K. Core Retail Prices Index YoY (Oct)

A:--

F: --

P: --

GBPUSD
  • GBPUSD
  • XAUUSD
  • XAGUSD
  • WTI
  • USDX
U.K. Retail Prices Index YoY (Oct)

A:--

F: --

P: --

GBPUSD
  • GBPUSD
  • XAUUSD
  • XAGUSD
  • WTI
  • USDX
U.K. Input PPI MoM (Not SA) (Oct)

A:--

F: --

P: --

GBPUSD
  • GBPUSD
  • XAUUSD
  • XAGUSD
  • WTI
  • USDX
U.K. Output PPI YoY (Not SA) (Oct)

A:--

F: --

P: --
GBPUSD
  • GBPUSD
  • XAUUSD
  • XAGUSD
  • WTI
  • USDX
U.K. Output PPI MoM (Not SA) (Oct)

A:--

F: --

P: --

GBPUSD
  • GBPUSD
  • XAUUSD
  • XAGUSD
  • WTI
  • USDX
Indonesia 7-Day Reverse Repo Rate

A:--

F: --

P: --

XAUUSD
  • XAUUSD
  • XAGUSD
  • WTI
  • USDX
Indonesia Deposit Facility Rate (Nov)

A:--

F: --

P: --

XAUUSD
  • XAUUSD
  • XAGUSD
  • WTI
  • USDX
Indonesia Loan Growth YoY (Oct)

A:--

F: --

P: --

XAUUSD
  • XAUUSD
  • XAGUSD
  • WTI
  • USDX
Indonesia Lending Facility Rate (Nov)

A:--

F: --

P: --

XAUUSD
  • XAUUSD
  • XAGUSD
  • WTI
  • USDX
BOE Gov Bailey Speaks
South Africa Core CPI YoY (Oct)

A:--

F: --

P: --

XAUUSD
  • XAUUSD
  • XAGUSD
  • WTI
  • USDX
South Africa CPI YoY (Oct)

A:--

F: --

P: --

XAUUSD
  • XAUUSD
  • XAGUSD
  • WTI
  • USDX
Euro Zone HICP Final YoY (Oct)

A:--

F: --

P: --

EURUSD
  • EURUSD
  • XAUUSD
  • XAGUSD
  • WTI
  • USDX
Euro Zone HICP Final MoM (Oct)

A:--

F: --

P: --

EURUSD
  • EURUSD
  • XAUUSD
  • XAGUSD
  • WTI
  • USDX
Euro Zone Core CPI Final YoY (Oct)

A:--

F: --

P: --

EURUSD
  • EURUSD
  • XAUUSD
  • XAGUSD
  • WTI
  • USDX
Euro Zone CPI YoY (Excl. Tobacco) (Oct)

A:--

F: --

P: --

EURUSD
  • EURUSD
  • XAUUSD
  • XAGUSD
  • WTI
  • USDX
Euro Zone Core CPI Final MoM (Oct)

A:--

F: --

P: --

EURUSD
  • EURUSD
  • XAUUSD
  • XAGUSD
  • WTI
  • USDX
South Africa Retail Sales YoY (Sept)

A:--

F: --

P: --

XAUUSD
  • XAUUSD
  • XAGUSD
  • WTI
  • USDX
U.S. MBA Mortgage Application Activity Index WoW

A:--

F: --

P: --

USDX
  • USDX
  • XAUUSD
  • XAGUSD
  • WTI
Canada New Housing Price Index MoM (Oct)

A:--

F: --

P: --

USDCAD
  • USDCAD
  • XAUUSD
  • XAGUSD
  • WTI
  • USDX
U.S. Annual New Housing Starts (SA) (Oct)

A:--

F: --

P: --
USDX
  • USDX
  • XAUUSD
  • XAGUSD
  • WTI
U.S. Total Building Permits (SA) (Oct)

A:--

F: --

P: --

USDX
  • USDX
  • XAUUSD
  • XAGUSD
  • WTI
U.S. New Housing Starts Annualized MoM (SA) (Oct)

A:--

F: --

P: --
USDX
  • USDX
  • XAUUSD
  • XAGUSD
  • WTI
U.S. Building Permits MoM (SA) (Oct)

A:--

F: --

P: --

USDX
  • USDX
  • XAUUSD
  • XAGUSD
  • WTI
ECB President Lagarde Speaks
U.S. Pending Home Sales Index (Oct)

--

F: --

P: --

U.S. Pending Home Sales Index MoM (SA) (Oct)

--

F: --

P: --

U.S. Pending Home Sales Index YoY (Oct)

--

F: --

P: --

BOE Gov Bailey Speaks
U.S. EIA Weekly Crude Stocks Change

--

F: --

P: --

U.S. EIA Weekly Cushing, Oklahoma Crude Oil Stocks Change

--

F: --

P: --

U.S. EIA Weekly Crude Demand Projected by Production

--

F: --

P: --

U.S. EIA Weekly Gasoline Stocks Change

--

F: --

P: --

U.S. EIA Weekly Crude Oil Imports Changes

--

F: --

P: --

U.S. EIA Weekly Heating Oil Stock Changes

--

F: --

P: --

Russia PPI YoY (Oct)

--

F: --

P: --

Russia PPI MoM (Oct)

--

F: --

P: --

FOMC Meeting Minutes
New York Federal Reserve President Williams delivered a speech.
Japan Core Machinery Orders MoM (Sept)

--

F: --

P: --

Japan Core Machinery Orders YoY (Sept)

--

F: --

P: --

Australia Employment (Oct)

--

F: --

P: --

Australia Labor Force Participation Rate (SA) (Oct)

--

F: --

P: --

Australia Full-time Employment (SA) (Oct)

--

F: --

P: --

Australia Unemployment Rate (SA) (Oct)

--

F: --

P: --

Euro Zone Current Account (SA) (Sept)

--

F: --

P: --

Euro Zone Current Account (Not SA) (Sept)

--

F: --

P: --

Euro Zone Labor Cost YoY (Q3)

--

F: --

P: --

Euro Zone Construction Output YoY (Sept)

--

F: --

P: --

Euro Zone Construction Output MoM (SA) (Sept)

--

F: --

P: --

U.K. CBI Industrial Prices Expectations (Nov)

--

F: --

P: --

U.K. CBI Industrial Trends - Orders (Nov)

--

F: --

P: --

South Africa Repo Rate

--

F: --

P: --

U.S. Philadelphia Fed Business Activity Index (SA) (Nov)

--

F: --

P: --

Canada Industrial Product Price Index MoM (Oct)

--

F: --

P: --

Q&A with Experts
    • All
    • Chatrooms
    • Groups
    • Friends
    Skylark flag
    Selina
    @Skylarkokay
    Simple steps: 1. Find where price moved fast up = Demand 2. Find where price moved fast down = Supply 3. Wait for price to return to that zone 4. Wait for confirmation 5. Enter with small risk and stop @Selina
    Skylark flag
    Selina
    @Skylarkokay
    @SelinaAnd If you understand this, you understand how banks trade.
    Size flag
    Take your time with it and practise marking the zones on demo charts before using them for live trades.@Selina
    Size flag
    EuroTrader flag
    Skylark
    Simple steps: 1. Find where price moved fast up = Demand 2. Find where price moved fast down = Supply 3. Wait for price to return to that zone 4. Wait for confirmation 5. Enter with small risk and stop @Selina
    @Skylarkdoea this really work? Just my thoughts, this is what is being taught the everyday trader out there. Does it actually work
    Skylark flag
    EuroTrader flag
    Skylark flag
    It's just a simple way to explain to a newbie so they can understand more
    46ZYV8YW5Q flag
    Skylark
    @SelinaMost newbies lose because they cannot wait. They open the chart and they feel they must trade. If there is no setup, they force one.
    @Skylark
    Size flag
    Size flag
    Skylark flag
    46ZYV8YW5Q
    @Skylark
    @46ZYV8YW5Q how are you how you doing today hope you're good welcome back what's happening on your end
    EuroTrader flag
    EuroTrader
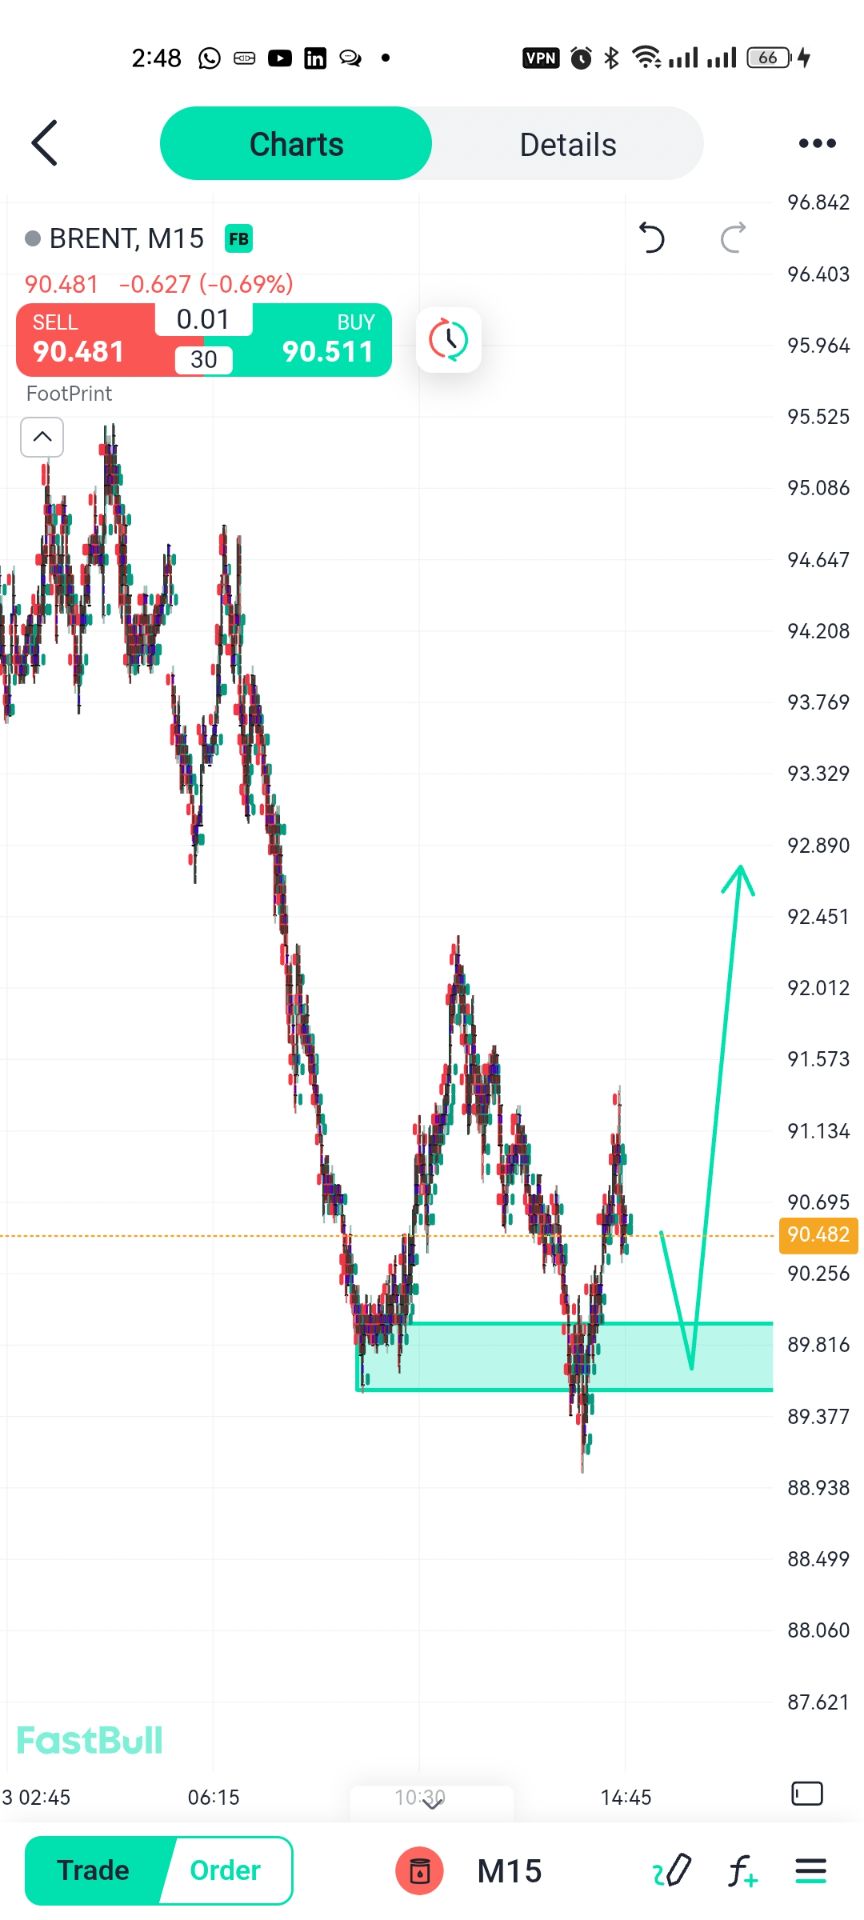
    @46ZYV8YW5Qfree buy signal.for oil markets, let's see if this is gonna give us some good entry for us to engage appropriately
    Skylark flag
    Skylark
    @46ZYV8YW5QFUEL OIL UPDATE 📉 Fuel Oil dropped more than 2% today, now at 3919.00 Yuan/ton. Sellers are in control for now.
    Skylark flag
    Skylark
    @46ZYV8YW5QBut we don't chase. We wait for price to reach our Demand zone for a buy, or pull back to Supply for a sell. Patience is the trade. Let's wait for our setup.
    Nawhdir flag
    Skylark flag
    Nawhdir
    @NawhdirHely neighbour welcome back how are you doing?hope you are good?
    Skylark flag
    Nawhdir flag
    Skylark
    @NawhdirHely neighbour welcome back how are you doing?hope you are good?
    @Skylarkhi
    Nawhdir flag
    Type here...
    Add Symbol or Code

      No matching data

      All
      Recommend
      Stocks
      Cryptocurrencies
      Central Banks
      Trump Updates
      Featured News
      • All
      • Russia-Ukraine Conflict
      • Middle East Flashpoint
      • All
      • Russia-Ukraine Conflict
      • Middle East Flashpoint

      Search
      Products

      Charts Free Forever

      Chats Q&A with Experts
      Screeners Economic Calendar Data Tools
      Membership Features
      Data Warehouse Market Trends Institutional Data Policy Rates Macro

      Market Trends

      Market Sentiment Order Book Forex Correlations

      Top Indicators

      Charts Free Forever
      Markets

      News

      24/7 Analysis Education

      Latest Views

      Latest Update

      Signals

      Copy Rankings Latest Signals Become a signal provider AI Rating
      Contests
      Brokers

      Overview Brokers Assessment Rankings Regulators News Claims
      Broker listing Forex Brokers Comparison Tool Live Spread Comparison Scam
      Q&A Complaint Scam Alert Videos Tips to Detect Scam
      More

      Business
      Events
      Careers About Us Advertising Help Center

      White Label

      Broker API

      Data API

      Web Plug-ins

      Affiliate Program

      Awards Institution Evaluation IB Seminar Salon Event Exhibition
      Vietnam Thailand Singapore Dubai
      Fans Party Investment Sharing Session
      FastBull Summit BrokersView Expo
      Recent Searches
        Top Searches
          Markets
          Analysis
          User
          24/7
          Economic Calendar
          Education
          Data
          • Names
          • Latest
          • Prev

          View All

          No data

          Scan to Download

          Faster Charts, Chat Faster!

          Download
          English
          • English
          • Español
          • العربية
          • Bahasa Indonesia
          • Bahasa Melayu
          • Tiếng Việt
          • ภาษาไทย
          • Français
          • Italiano
          • Türkçe
          • Русский язык
          • 简中
          • 繁中
          Open Account
          Search
          Products
          Charts Free Forever
          Markets
          News
          Signals

          Copy Rankings Latest Signals Become a signal provider AI Rating
          Contests
          Brokers

          Overview Brokers Assessment Rankings Regulators News Claims
          Broker listing Forex Brokers Comparison Tool Live Spread Comparison Scam
          Q&A Complaint Scam Alert Videos Tips to Detect Scam
          More

          Business
          Events
          Careers About Us Advertising Help Center

          White Label

          Broker API

          Data API

          Web Plug-ins

          Affiliate Program

          Awards Institution Evaluation IB Seminar Salon Event Exhibition
          Vietnam Thailand Singapore Dubai
          Fans Party Investment Sharing Session
          FastBull Summit BrokersView Expo

          NZD/USD Extends Seven-Day Decline as Hawkish Fed Signals Support Dollar

          Warren Takunda

          Traders' Opinions

          Summary:

          NZD/USD remains under pressure near 0.5490 as hawkish Fed commentary and resilient US consumer spending contrast with weaker New Zealand producer inflation.

          SELL NZDUSD
          EXP
          TRADING

          0.54900

          Entry Price

          0.53500

          TP

          0.56000

          SL

          0.54947 +0.00047 +0.09%

          0.0

          Pips

          Flat

          0.53500

          TP

          Exit Price

          0.54900

          Entry Price

          0.56000

          SL
          The New Zealand Dollar continues to lose ground against its US counterpart, with NZD/USD extending its decline for a seventh consecutive session on Wednesday. The pair trades around 0.5490, remaining close to the 0.5481 level reached on November 17, its weakest since March 2020.
          The US Dollar is drawing support from increasingly hawkish Federal Reserve commentary, with St. Louis Fed President Alberto Musalem suggesting that several interest rate increases may be necessary to bring inflation under control. He also stressed the importance of acting promptly to prevent price pressures from becoming more entrenched.
          Recent US economic data has reinforced this outlook. October retail sales increased by 0.2%, matching expectations, while sales excluding automobiles advanced 0.6%, exceeding forecasts. The retail sales control group also rose 0.6%, highlighting continued strength in consumer spending.
          Meanwhile, New Zealand's latest producer price figures offered little support for the Kiwi. Output prices increased by 0.8% quarter over quarter in Q3 2026, below the 1.1% forecast and significantly slower than the previous quarter's 1.7% rise. Input prices also disappointed, rising 0.7% against expectations of 1.5%, following a 2.9% increase in Q2.
          Attention now turns to the minutes of the Fed's October meeting, which could provide further insight into policymakers' appetite for additional tightening.
          The balance of risks remains tilted to the downside for NZD/USD. Resilient US consumption and hawkish Fed rhetoric are supporting the Greenback, while softer New Zealand producer inflation provides little reason for a sustained Kiwi recovery. The FOMC minutes could reinforce this divergence and keep the pair under pressure.

          Technical AnalysisNZD/USD Extends Seven-Day Decline as Hawkish Fed Signals Support Dollar_1

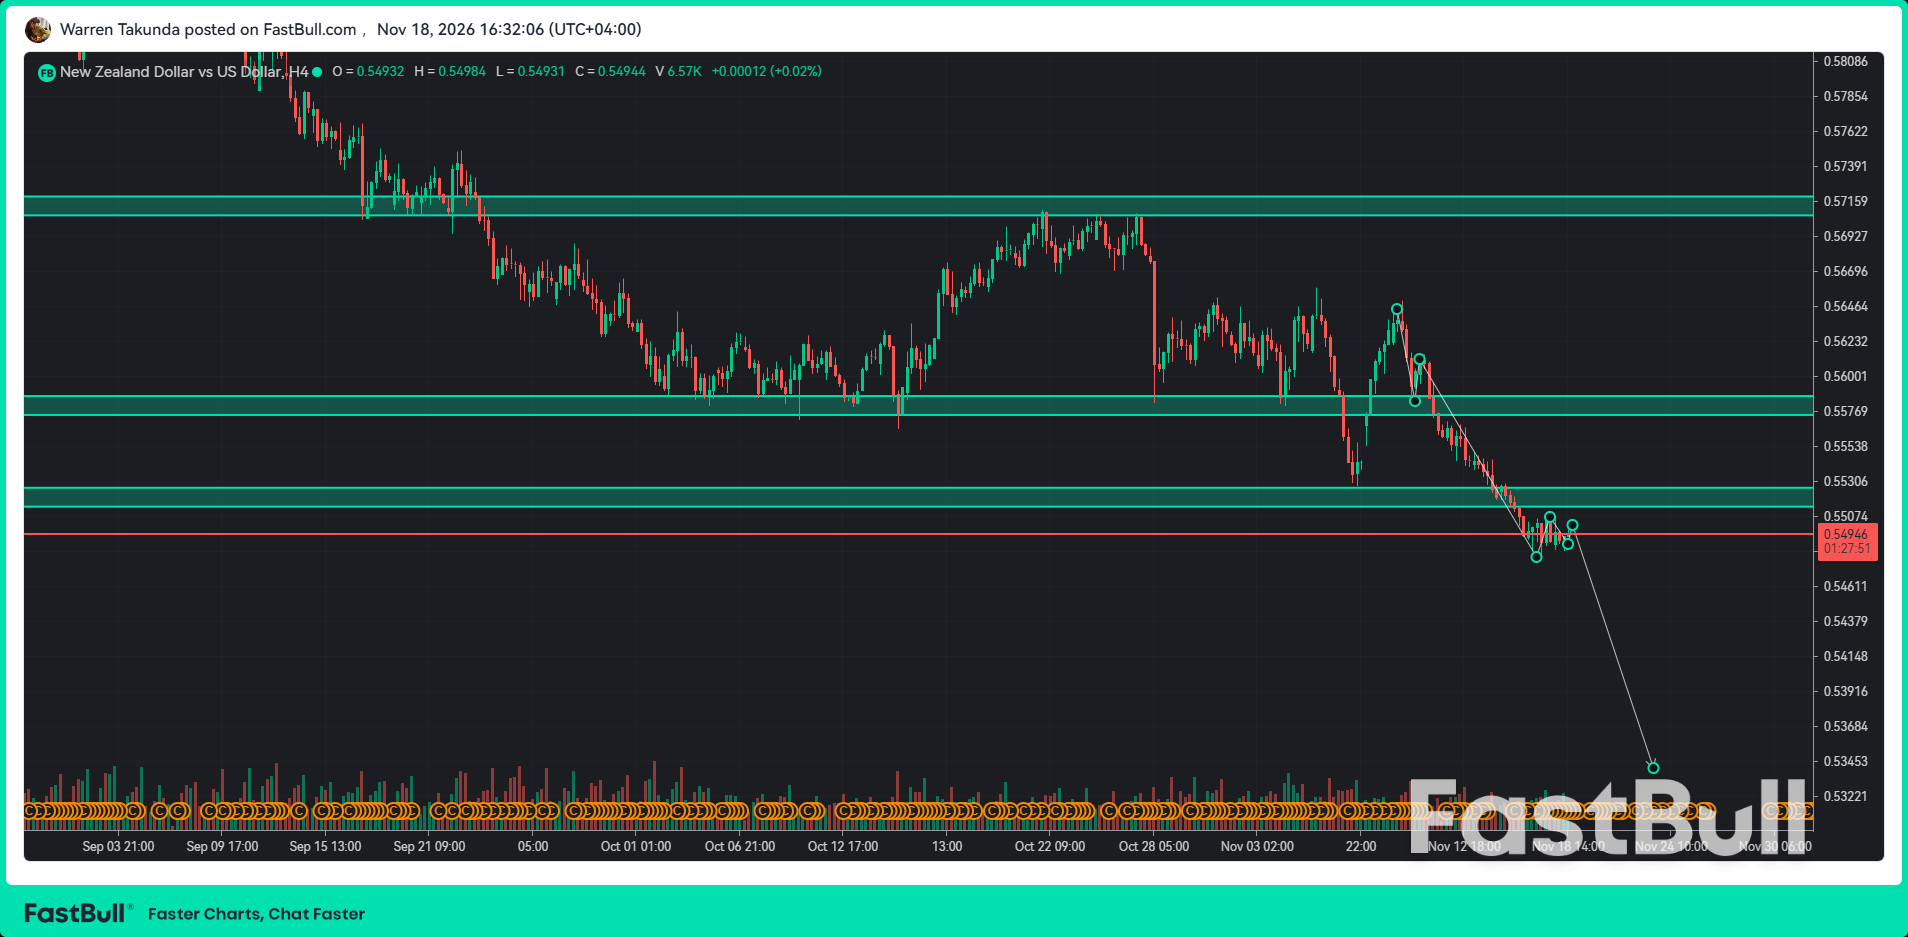
          NZD/USD remains firmly bearish on the H4 chart, trading around 0.5495 after an extended decline from the October highs near 0.5700. The pair continues to form lower highs and lower lows, confirming that sellers remain in control.
          The recent breakdown below the 0.5507–0.5528 support zone is an important development. This area could now act as resistance, and the current consolidation around 0.5495 suggests buyers have struggled to regain upward momentum.
          I expect a possible corrective rebound toward 0.5507–0.5520 before sellers attempt another downward move. A rejection from this region could expose 0.5460, followed by 0.5415. The broader downside projection on the chart points toward 0.5345.
          The bearish outlook remains intact while price stays below 0.5528. A sustained recovery above that level would weaken the immediate selling structure.

          TRADE RECOMMENDATION

          SELL NZD/USD
          ENTRY PRICE: 0.5490
          STOP LOSS: 0.5600
          TAKE PROFIT: 0.5350
          Risk Warnings and Disclaimers
          You understand and acknowledge that there is a high degree of risk involved in trading. Following any strategies or investment methods may lead to potential losses. The content on the site is provided by our contributors and analysts for information purposes only. You are solely responsible for determining whether any trading assets, securities, strategy, or any other product is suitable for investing based on your own investment objectives and financial situation.
          Add to Favorites
          Share
          FastBull
          Copyright © 2026 FastBull Ltd

          728 RM B 7/F GEE LOK IND BLDG NO 34 HUNG TO RD KWUN TONG KLN HONG KONG

          TelegramInstagramTwitterfacebooklinkedin
          App Store Google Play Android Windows
          Products
          Charts

          Chats

          Q&A with Experts
          Screeners
          Economic Calendar
          Data
          Tools
          Membership
          Features
          Function
          Markets
          Copy Trading
          Latest Signals
          Contests
          24/7
          Analysis
          Education
          Company
          Careers
          About Us
          Contact Us
          Advertising
          Download FastBull
          Help Center
          Feedback
          User Agreement
          Privacy Policy
          Personal Information Protection Statement
          Business

          White Label

          Broker API

          Data API

          Web Plug-ins

          Poster Maker

          Affiliate Program

          Risk Disclosure

          The risk of loss in trading financial instruments such as stocks, FX, commodities, futures, bonds, ETFs and crypto can be substantial. You may sustain a total loss of the funds that you deposit with your broker. Therefore, you should carefully consider whether such trading is suitable for you in light of your circumstances and financial resources.

          No decision to invest should be made without thoroughly conducting due diligence by yourself or consulting with your financial advisors. Our web content might not suit you since we don't know your financial conditions and investment needs. Our financial information might have latency or contain inaccuracy, so you should be fully responsible for any of your trading and investment decisions. The company will not be responsible for your capital loss.

          Without getting permission from the website, you are not allowed to copy the website's graphics, texts, or trademarks. Intellectual property rights in the content or data incorporated into this website belong to its providers and exchange merchants.

          Not Logged In

          Log in to access more features

          Connect Broker
          Become a signal provider
          Help Center
          Customer Service
          Dark Mode
          Price Up/Down Colors

          Log In

          Sign Up

          Position
          Layout
          Fullscreen
          Default to Chart
          The chart page opens by default when you visit fastbull.com