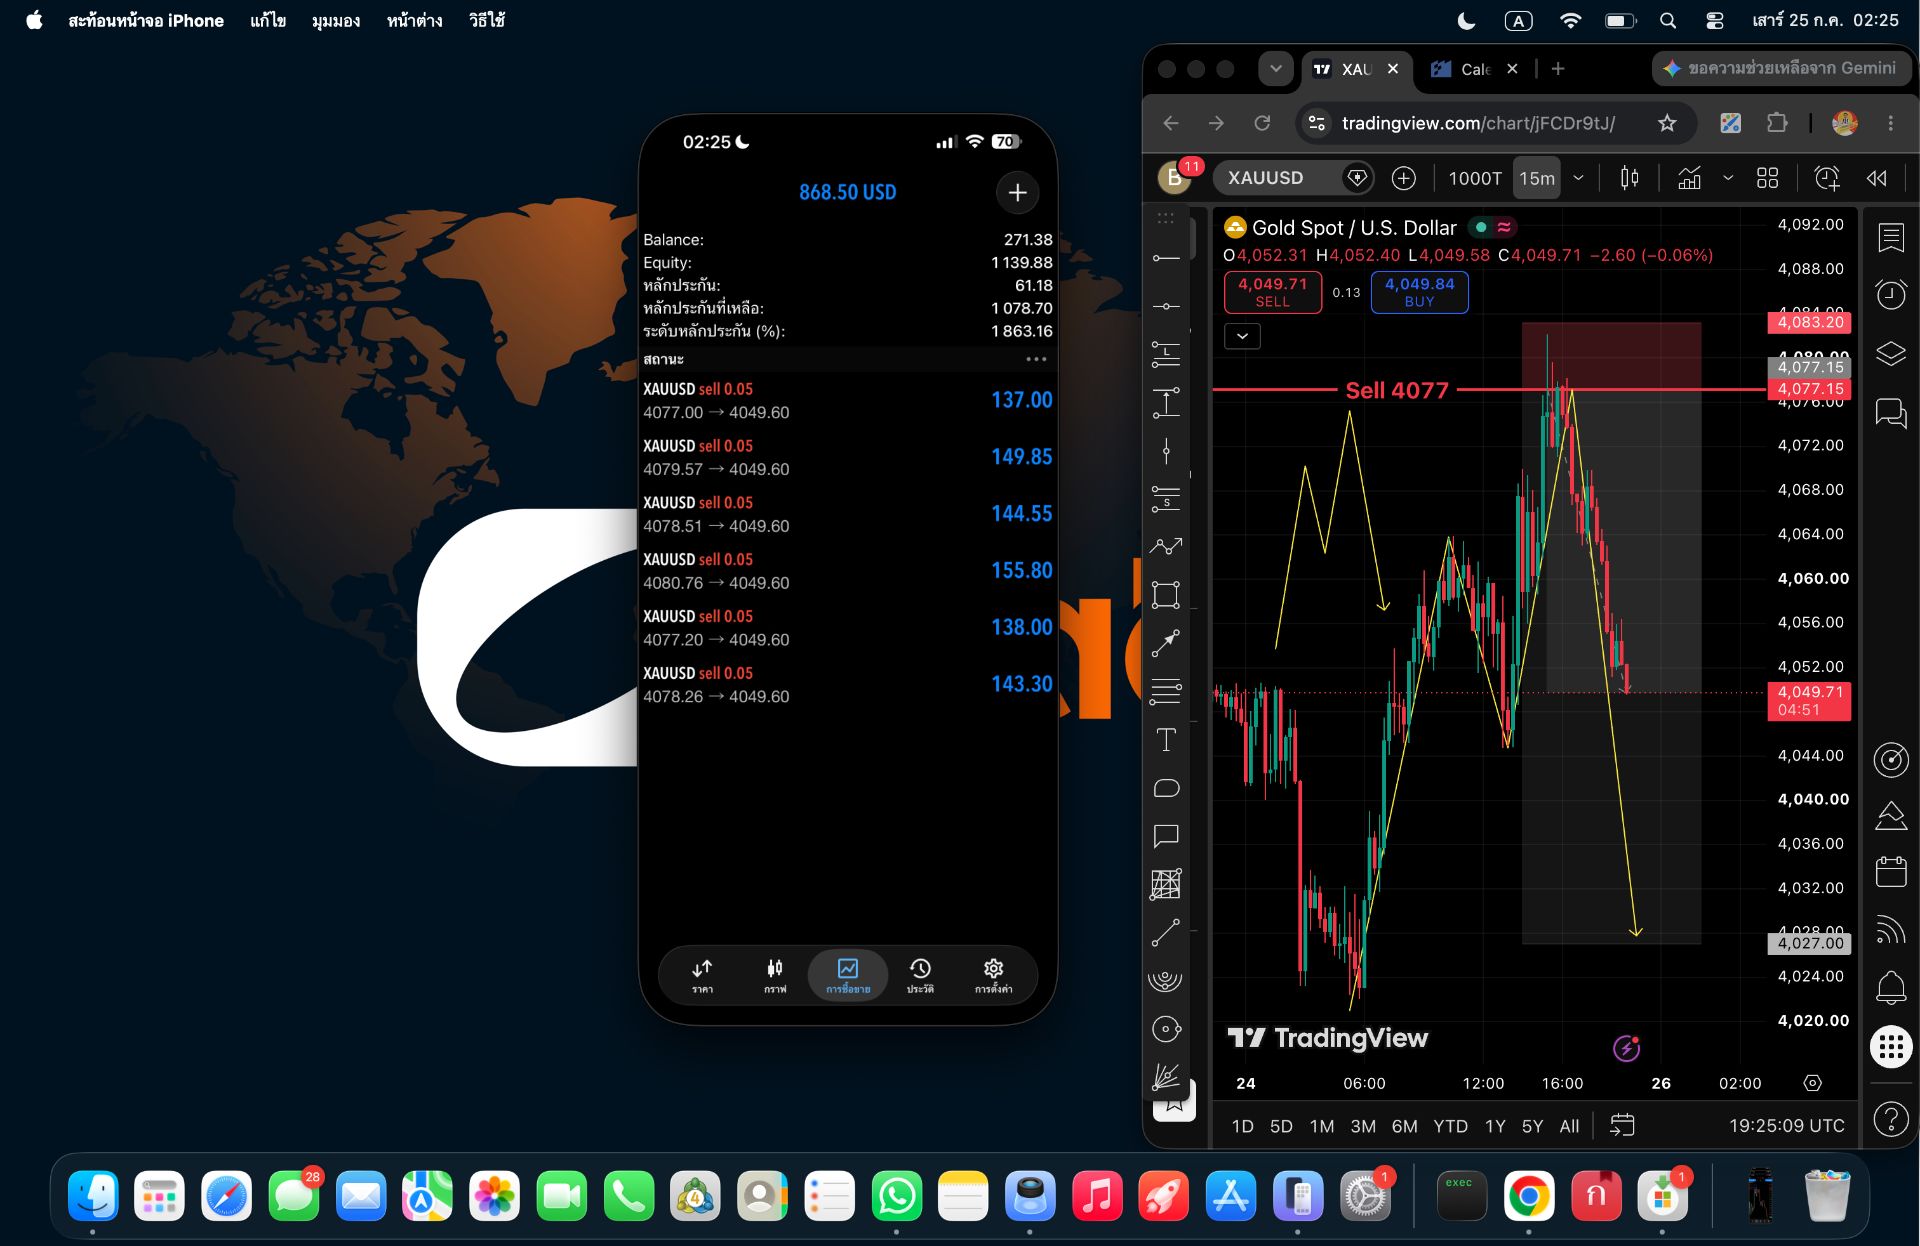
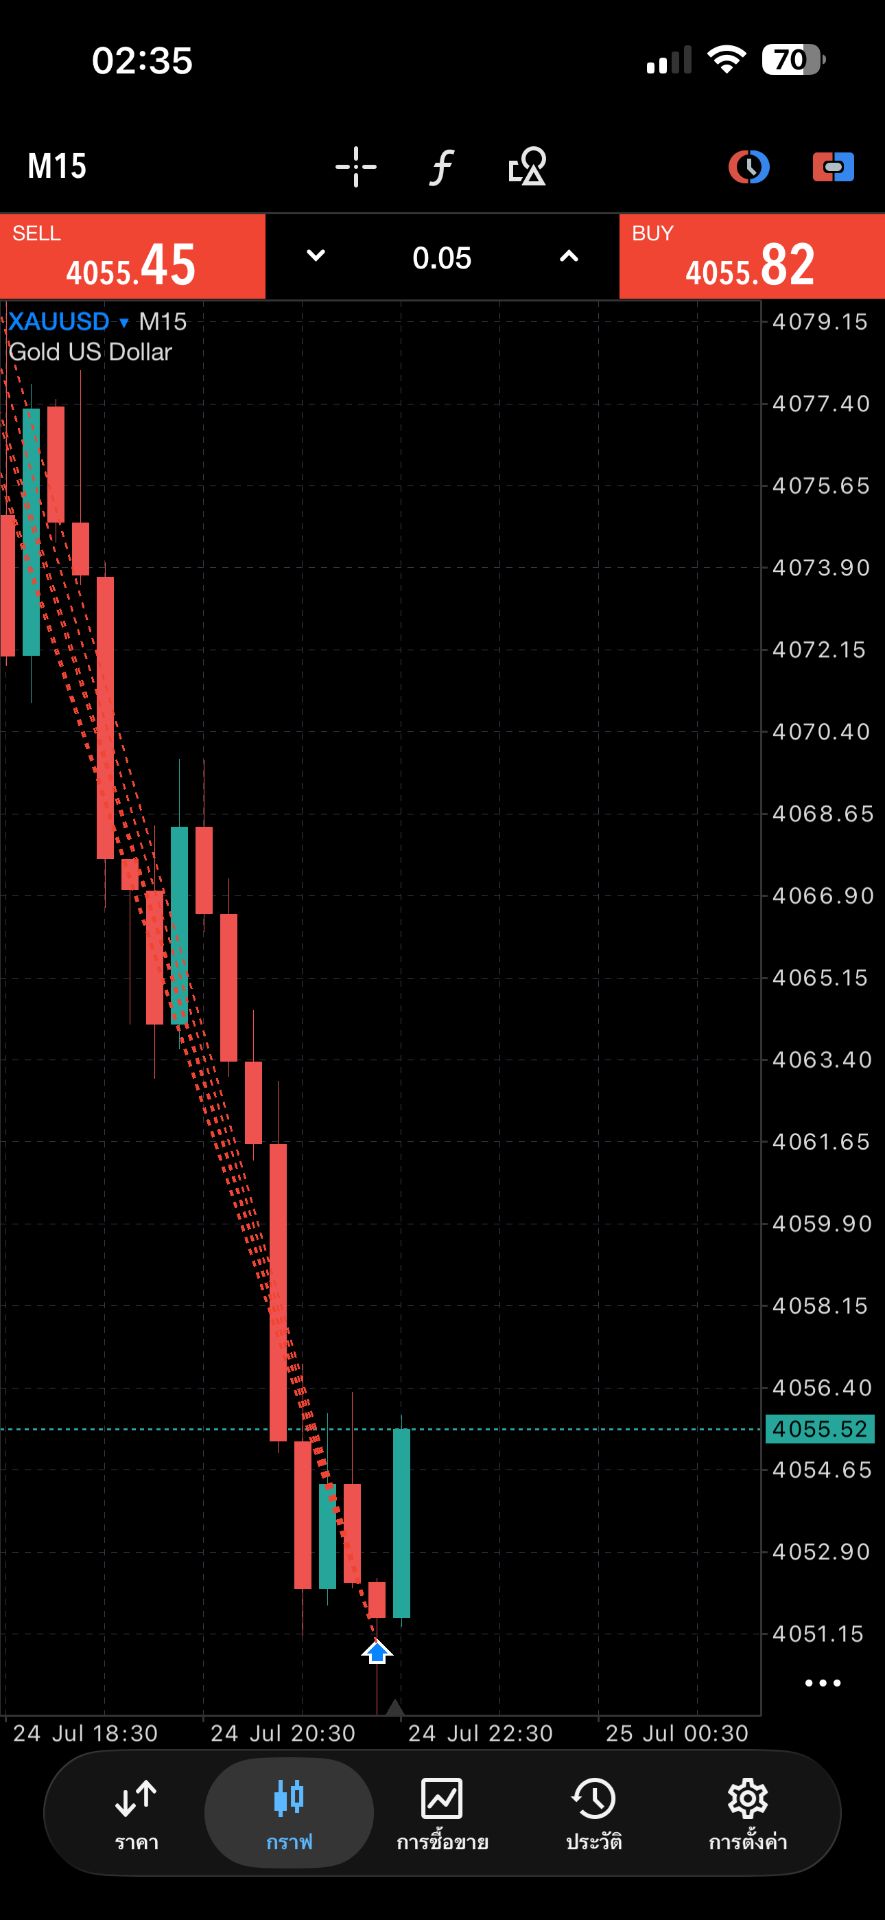
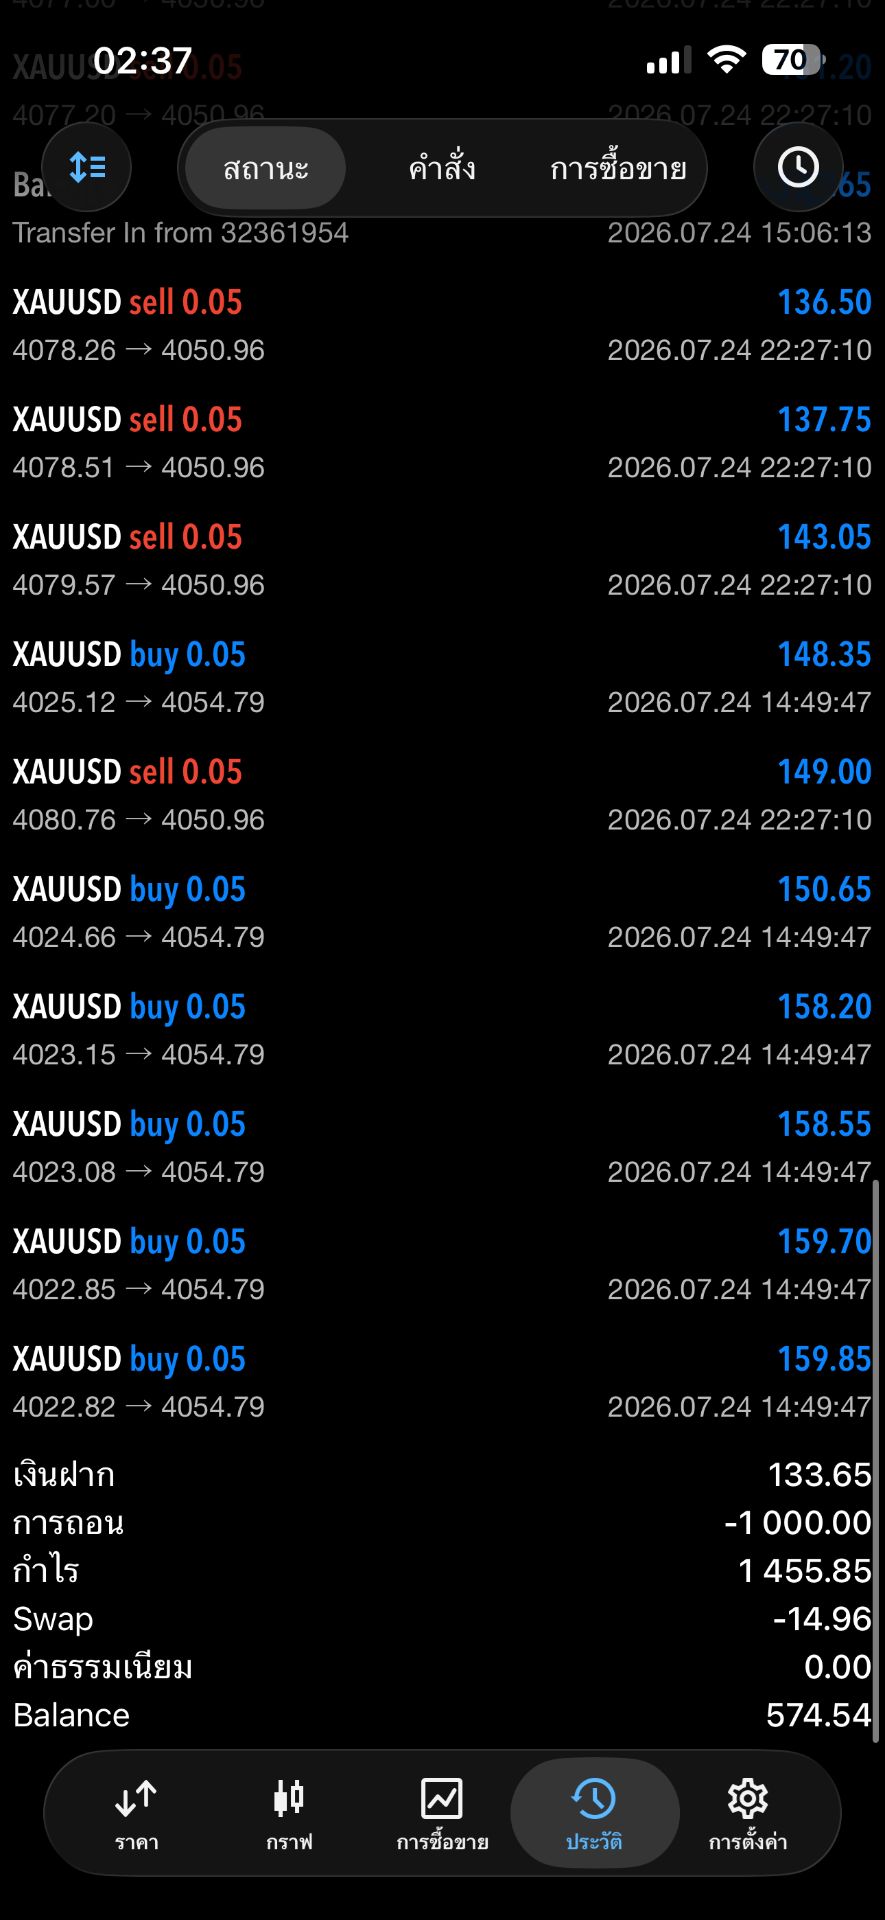
• Trade
  • Markets
  • Copy
  • Contests
  • 24/7
  • Calendar
  • Q&A
  • Chats
Screeners
SYMBOL
LAST
BID
ASK
HIGH
LOW
NET CHG.
%CHG.
SPREAD
SOURCE
SPX
S&P 500 Index
7272.44
7272.44
7272.44
7483.15
7268.88
-133.28
-1.80%
--
--
DJI
Dow Jones Industrial Average
50387.44
50387.44
50387.44
51260.92
50371.99
-398.56
-0.78%
--
--
IXIC
NASDAQ Composite Index
25148.60
25148.60
25148.60
26259.92
25131.70
-781.05
-3.01%
--
--
USDX
US Dollar Index
99.890
99.890
99.970
100.010
99.620
-0.010
-0.01%
--
--
EURUSD
Euro / US Dollar
1.15453
1.15453
1.15460
1.15778
1.15268
+0.00137
+ 0.12%
--
--
GBPUSD
Pound Sterling / US Dollar
1.33758
1.33758
1.33765
1.34107
1.33307
+0.00379
+ 0.28%
--
--
XAUUSD
Gold / US Dollar
4255.39
4255.39
4255.80
4363.43
4252.97
-74.56
-1.72%
--
--
WTI
Light Sweet Crude Oil
85.408
85.408
85.438
89.917
84.770
-4.286
-4.78%
--
--

Community Accounts

Signal Accounts
--
Profit Accounts
--
Loss Accounts
--
View More

Become a signal provider

Sell trading signals to earn additional income

View More

Guide to Copy Trading

Get started with ease and confidence

View More

Signal Accounts for Members

All Signal Accounts

Best Return
  • Best Return
  • Best P/L
  • Best MDD
Past 1W
  • Past 1W
  • Past 1M
  • Past 1Y

All Contests

  • All
  • Recommend
  • Stocks
  • Cryptocurrencies
  • Central Banks
  • Trump Updates
  • Featured News
Top News Only
Share

The U.S. Energy Information Administration (EIA) Predicts That Oil Production Disruptions In Parts Of The Middle East Will Continue Until The End Of 2027, Exceeding The Scope Of The Short-Term Energy Outlook

Share

The U.S. Energy Information Administration (EIA) Now Assumes That Oil Shipments Through The Strait Of Hormuz Will Resume In The Third Quarter Of 2026. Traffic Through The Strait Of Hormuz Is Not Expected To Return To Pre-war Levels Before Early 2027

Share

The U.S. Energy Information Administration (EIA) Projects That U.S. Oil Production Will Average 13.83 Million Barrels Per Day In June, Up From 13.71 Million Barrels Per Day In May; July Production Is Projected To Average 13.82 Million Barrels Per Day

Share

Brent Crude Oil Fell Back Below $89 A Barrel, Down 4.74% On The Day

Share

The U.S. Energy Information Administration Projects Global Oil Demand At 102.9 Million Barrels Per Day In 2026, Down From Its Previous Forecast Of 104.2 Million Barrels Per Day; And Projects Demand At 105.3 Million Barrels Per Day In 2027

Share

[Bitcoin Falls Below $61,000] June 10th, According To HTX Market Data, Bitcoin Fell Below $61,000, Now Trading At $60,958, A 24-hour Decrease Of 4.61%

Share

The U.S. Energy Information Administration Projects U.S. Oil Production At 13.72 Million Barrels Per Day In 2026, Up From Its Previous Forecast Of 13.65 Million Barrels Per Day; And Projects Production At 14.15 Million Barrels Per Day In 2027

Share

The U.S. Energy Information Administration Projects That Brent Crude Oil Prices Will Average $95.39 Per Barrel In 2026, Up From Its Previous Forecast Of $94.85 Per Barrel; The Forecast For 2027 Is $79.39 Per Barrel

Share

Fitch: Our Assumptions For Gold Prices Remain Unchanged

Share

Fitch Ratings Raised Its Near-term Price Forecasts For Metals And Mining

Share

Both WTI And Brent Crude Oil Prices Continued To Fall, With Brent Crude Down 4% And WTI Crude Down 4.6% On The Day

Share

LME Nickel Fell 2.00% Intraday, Currently Trading At $18,009.80 Per Ton

Share

The New Bulgarian Government Has Stated That It Will Not Provide Weapons To Ukraine

Share

Spot Gold Weakened After Rising To An Intraday High Of $4,363.66 Per Ounce, And Has Now Fallen Below $4,270 Per Ounce, Down 1.40% On The Day

Share

U.S. Trade Representative Greer Will Visit Applied Materials' Research And Development Facility In Sunnyvale, California, On Friday

Share

According To US Financial Media Semafor, US Trade Representative Greer Will Visit Tesla's Headquarters In California On Thursday. Greer Will Visit The California Factory To Promote Localized Production

Share

The U.S. Embassy In Jerusalem Stated That The Asylum Order For U.S. Government Employees And Their Families Has Ended

Share

Bank Of America: Investment Banking Business Is In Good Shape

Share

The Main Shanghai Silver Futures Contract Fell 4.00% Intraday, Currently Trading At 15,767.00 Yuan/kg

Share

Spot Gold Touched $4,300 Per Ounce, Down 0.69% On The Day. Spot Silver Fell 3.5%

TIME
ACT
FCST
PREV
IMPACT
China, Mainland Trade Balance (USD) (May)

A:--

F: --

P: --

XAUUSD
  • XAUUSD
  • XAGUSD
  • WTI
  • USDX
China, Mainland Trade Balance (CNH) (May)

A:--

F: --

P: --

XAUUSD
  • XAUUSD
  • XAGUSD
  • WTI
  • USDX
China, Mainland Exports (May)

A:--

F: --

P: --

XAUUSD
  • XAUUSD
  • XAGUSD
  • WTI
  • USDX
China, Mainland Imports (CNH) (May)

A:--

F: --

P: --

XAUUSD
  • XAUUSD
  • XAGUSD
  • WTI
  • USDX
China, Mainland Imports YoY (CNH) (May)

A:--

F: --

P: --

XAUUSD
  • XAUUSD
  • XAGUSD
  • WTI
  • USDX
China, Mainland Imports YoY (USD) (May)

A:--

F: --

P: --

XAUUSD
  • XAUUSD
  • XAGUSD
  • WTI
  • USDX
China, Mainland Exports YoY (USD) (May)

A:--

F: --

P: --

XAUUSD
  • XAUUSD
  • XAGUSD
  • WTI
  • USDX
Indonesia 7-Day Reverse Repo Rate

A:--

F: --

P: --

XAUUSD
  • XAUUSD
  • XAGUSD
  • WTI
  • USDX
Indonesia Lending Facility Rate (Jun)

A:--

F: --

P: --

XAUUSD
  • XAUUSD
  • XAGUSD
  • WTI
  • USDX
Indonesia Deposit Facility Rate (Jun)

A:--

F: --

P: --

XAUUSD
  • XAUUSD
  • XAGUSD
  • WTI
  • USDX
Germany Industrial Output MoM (SA) (Apr)

A:--

F: --

P: --
EURUSD
  • EURUSD
  • XAUUSD
  • XAGUSD
  • WTI
  • USDX
Germany Exports MoM (SA) (Apr)

A:--

F: --

P: --
EURUSD
  • EURUSD
  • XAUUSD
  • XAGUSD
  • WTI
  • USDX
South Africa GDP YoY (Q1)

A:--

F: --

P: --

XAUUSD
  • XAUUSD
  • XAGUSD
  • WTI
  • USDX
U.S. NFIB Small Business Optimism Index (SA) (May)

A:--

F: --

P: --

USDX
  • USDX
  • XAUUSD
  • XAGUSD
  • WTI
Mexico CPI YoY (May)

A:--

F: --

P: --

XAUUSD
  • XAUUSD
  • XAGUSD
  • WTI
  • USDX
U.S. Trade Balance (Apr)

A:--

F: --

P: --
USDX
  • USDX
  • XAUUSD
  • XAGUSD
  • WTI
Canada Trade Balance (SA) (Apr)

A:--

F: --

P: --
WTI
  • WTI
  • XAUUSD
  • XAGUSD
  • USDX
Canada Imports (SA) (Apr)

A:--

F: --

P: --
USDCAD
  • USDCAD
  • XAUUSD
  • XAGUSD
  • WTI
  • USDX
Canada Exports (SA) (Apr)

A:--

F: --

P: --
USDCAD
  • USDCAD
  • XAUUSD
  • XAGUSD
  • WTI
  • USDX
U.S. Exports (Apr)

A:--

F: --

P: --

USDX
  • USDX
  • XAUUSD
  • XAGUSD
  • WTI
U.S. Weekly Redbook Index YoY

A:--

F: --

P: --

XAUUSD
  • XAUUSD
  • XAGUSD
  • WTI
  • USDX
U.S. Existing Home Sales Annualized Total (May)

A:--

F: --

P: --

USDX
  • USDX
  • XAUUSD
  • XAGUSD
  • WTI
U.S. Existing Home Sales Annualized MoM (May)

A:--

F: --

P: --

USDX
  • USDX
  • XAUUSD
  • XAGUSD
  • WTI
U.S. Wholesale Sales MoM (SA) (Apr)

A:--

F: --

P: --

USDX
  • USDX
  • XAUUSD
  • XAGUSD
  • WTI
China, Mainland M1 Money Supply YoY (May)

--

F: --

P: --

China, Mainland M2 Money Supply YoY (May)

--

F: --

P: --

China, Mainland M0 Money Supply YoY (May)

--

F: --

P: --

U.S. EIA Natural Gas Production Forecast For The Next Year (Jun)

A:--

F: --

P: --

WTI
  • WTI
  • XAUUSD
  • XAGUSD
  • USDX
U.S. EIA Short-Term Crude Production Forecast For The Year (Jun)

A:--

F: --

P: --

WTI
  • WTI
  • XAUUSD
  • XAGUSD
  • USDX
U.S. EIA Short-Term Crude Production Forecast For The Next Year (Jun)

A:--

F: --

P: --

WTI
  • WTI
  • XAUUSD
  • XAGUSD
  • USDX
EIA Monthly Short-Term Energy Outlook
U.S. 3-Year Note Auction Yield

--

F: --

P: --

U.S. API Weekly Crude Oil Stocks

--

F: --

P: --

U.S. API Weekly Refined Oil Stocks

--

F: --

P: --

U.S. API Weekly Gasoline Stocks

--

F: --

P: --

U.S. API Weekly Cushing Crude Oil Stocks

--

F: --

P: --

Japan Domestic Enterprise Commodity Price Index MoM (May)

--

F: --

P: --

Japan Domestic Enterprise Commodity Price Index YoY (May)

--

F: --

P: --

Japan PPI MoM (May)

--

F: --

P: --

China, Mainland CPI MoM (May)

--

F: --

P: --

China, Mainland CPI YoY (May)

--

F: --

P: --

China, Mainland PPI YoY (May)

--

F: --

P: --

Japan 30-Year JGB Auction Yield

--

F: --

P: --

Turkey Retail Sales YoY (Apr)

--

F: --

P: --

Italy Industrial Output YoY (SA) (Apr)

--

F: --

P: --

Italy 12-Month BOT Auction Avg. Yield

--

F: --

P: --

Germany 10-Year Bund Auction Avg. Yield

--

F: --

P: --

U.S. MBA Mortgage Application Activity Index WoW

--

F: --

P: --

U.S. Real Income MoM (SA) (May)

--

F: --

P: --

U.S. Core CPI YoY (Not SA) (May)

--

F: --

P: --

U.S. CPI MoM (SA) (May)

--

F: --

P: --

U.S. Core CPI MoM (SA) (May)

--

F: --

P: --

U.S. CPI YoY (Not SA) (May)

--

F: --

P: --

U.S. CPI MoM (Not SA) (May)

--

F: --

P: --

U.S. Core CPI (SA) (May)

--

F: --

P: --

Q&A with Experts
    • All
    • Chatrooms
    • Groups
    • Friends
    Size flag
    Ashok Sen
    @Sizei want to loss today
    What made you feel like ending the day with a loss?
    EuroTrader flag
    DYG0WZ0819
    Hi
    @DYG0WZ0819Hello mate .how are you doing . hope you treated the markets well today and it was not the other way around
    Ashok Sen flag
    Size
    What made you feel like ending the day with a loss?
    @Sizemy rules
    Nawhdir Øt94 flag
    Ashok Sen flag
    until loss trade
    EuroTrader flag
    EuroTrader
    @Nawhdir Øt94Did you notice how oil is falling and Bitcoin is not rising .something fishy is happening in the background
    Nawhdir Øt94 flag
    EuroTrader
    @Nawhdir Øt94Did you notice how oil is falling and Bitcoin is not rising .something fishy is happening in the background
    @EuroTraderAll. No one uprisings
    EuroTrader flag
    Nawhdir Øt94
    @Nawhdir Øt94Small loss big profits my mentor. That's how it's being done. let's geed it
    EuroTrader flag
    Nawhdir Øt94
    @EuroTraderAll. No one uprisings
    @Nawhdir Øt94Yeahh so things are slowing going back to the status quo already
    Ashok Sen flag
    EuroTrader
    @Nawhdir Øt94Small loss big profits my mentor. That's how it's being done. let's geed it
    @EuroTraderdengar grid trading
    EuroTrader flag
    Ashok Sen
    @EuroTraderdengar grid trading
    @Ashok Sen Who trades using grid trading? i understand that style of trading but it has never been my thing
    Size flag
    Ashok Sen
    @Sizemy rules
    @Ashok Sen If that’s part of your rules, then it’s more about your system structure than emotion.
    Nawhdir Øt94 flag
    EuroTrader
    @Ashok Sen Who trades using grid trading? i understand that style of trading but it has never been my thing
    @EuroTradergrid trading amat membuat perbedaan untuk penglihatan mata,
    Ashok Sen flag
    Size
    @Ashok Sen If that’s part of your rules, then it’s more about your system structure than emotion.
    @Sizeyes i know
    Size flag
    What’s the logic behind that rule in your system? @Ashok Sen
    EuroTrader flag
    Nawhdir Øt94
    @EuroTradergrid trading amat membuat perbedaan untuk penglihatan mata,
    @Nawhdir Øt94If someone understand it then it's a very strong trading strategy but if not it's suicidal
    Size flag
    Ashok Sen
    @Sizeyes i know
    @Ashok Sen Just make sure the rule is actually helping your consistency.
    Nawhdir Øt94 flag
    EuroTrader
    @Nawhdir Øt94If someone understand it then it's a very strong trading strategy but if not it's suicidal
    @EuroTraderya, aku tidak bisa.
    @Vroy flag
    Hey guys
    EuroTrader flag
    Nawhdir Øt94
    @EuroTraderya, aku tidak bisa.
    @Nawhdir Øt94But what you do is not grid trading right? or is it grid trading?
    Type here...
    Add Symbol or Code

      No matching data

      All
      Recommend
      Stocks
      Cryptocurrencies
      Central Banks
      Trump Updates
      Featured News
      • All
      • Russia-Ukraine Conflict
      • Middle East Flashpoint
      • All
      • Russia-Ukraine Conflict
      • Middle East Flashpoint

      Search
      Products

      Charts Free Forever

      Chats Q&A with Experts
      Screeners Economic Calendar Data Tools
      Membership Features
      Data Warehouse Market Trends Institutional Data Policy Rates Macro

      Market Trends

      Market Sentiment Order Book Forex Correlations

      Top Indicators

      Charts Free Forever
      Markets

      News

      24/7 Analysis Education

      Latest Views

      Latest Update

      Signals

      Copy Rankings Latest Signals Become a signal provider AI Rating
      Contests
      Brokers

      Overview Brokers Assessment Rankings Regulators News Claims
      Broker listing Forex Brokers Comparison Tool Live Spread Comparison Scam
      Q&A Complaint Scam Alert Videos Tips to Detect Scam
      More

      Business
      Events
      Careers About Us Advertising Help Center

      White Label

      Broker API

      Data API

      Web Plug-ins

      Affiliate Program

      Awards Institution Evaluation IB Seminar Salon Event Exhibition
      Vietnam Thailand Singapore Dubai
      Fans Party Investment Sharing Session
      FastBull Summit BrokersView Expo
      Recent Searches
        Top Searches
          Markets
          Analysis
          User
          24/7
          Economic Calendar
          Education
          Data
          • Names
          • Latest
          • Prev

          View All

          No data

          Scan to Download

          Faster Charts, Chat Faster!

          Download App
          English
          • English
          • Español
          • العربية
          • Bahasa Indonesia
          • Bahasa Melayu
          • Tiếng Việt
          • ภาษาไทย
          • Français
          • Italiano
          • Türkçe
          • Русский язык
          • 简中
          • 繁中
          Open Account
          Search
          Products
          Charts Free Forever
          Markets
          News
          Signals

          Copy Rankings Latest Signals Become a signal provider AI Rating
          Contests
          Brokers

          Overview Brokers Assessment Rankings Regulators News Claims
          Broker listing Forex Brokers Comparison Tool Live Spread Comparison Scam
          Q&A Complaint Scam Alert Videos Tips to Detect Scam
          More

          Business
          Events
          Careers About Us Advertising Help Center

          White Label

          Broker API

          Data API

          Web Plug-ins

          Affiliate Program

          Awards Institution Evaluation IB Seminar Salon Event Exhibition
          Vietnam Thailand Singapore Dubai
          Fans Party Investment Sharing Session
          FastBull Summit BrokersView Expo

          HSI: A-shares Listed on SSE and SZSE Open Higher, SSE Composite Index Up 0.39%

          Samantha Luan
          Summary:

          SZSE Component Index was at 11,274.86 points, up 0.61%; Growth Enterprise Index was at 2,366.79 points, up 0.70%; SZSE SME Composite Index was at 7,766.54 points, up 0.63%. In the stock market, power equipment led the rise, and automotive, petroleum, petrochemicals, coal, non-ferrous metals, basic chemicals, and other sectors were among the top gainers. While social services led the decline, and banks, real estate, food and beverage, pharmaceutical and biological, agriculture, forestry, animal husbandry, and fishery were weak. On the news, Li Keqiang said that China's economy keeps running in a reasonable range and is generally in a recovery trend. China's National Development and Reform Commission said it will accelerate the first batch of 300-billion-yuan policy-oriented development financial instruments to form a physical workload as soon as possible. Many banks have lowered their listed deposit rates and the cap on rate increases.

          BUY HongKong50
          Close Time
          CLOSED

          18710.00

          Entry Price

          18850.00

          TP

          18595.00

          SL

          24302.85 -308.40 -1.25%

          1150.0

          Pips

          Loss

          18595.00

          SL

          18593.20

          Exit Price

          18710.00

          Entry Price

          18850.00

          TP

          I. Fundamentals

          SZSE Component Index was at 11,274.86 points, up 0.61%; Growth Enterprise Index was at 2,366.79 points, up 0.70%; SZSE SME Composite Index was at 7,766.54 points, up 0.63%.
          In the stock market, power equipment led the rise, and automotive, petroleum, petrochemicals, coal, non-ferrous metals, basic chemicals, and other sectors were among the top gainers. While social services led the decline, and banks, real estate, food and beverage, pharmaceutical and biological, agriculture, forestry, animal husbandry, and fishery were weak.
          On the news, Li Keqiang said that China's economy keeps running in a reasonable range and is generally in a recovery trend. China's National Development and Reform Commission (NDRC) said it will accelerate the first batch of 300-billion-yuan policy-oriented development financial instruments to form a physical workload as soon as possible. Many banks have lowered their listed deposit rates and the cap on rate increases. China's Ministry of Agriculture and Rural Affairs deploys a comprehensive promotion of soybean meal reduction and substitution action. The NDRC vigorously release storage, and the single-month pork delivery reached the highest level in history. Fosun International reduced its holdings of H shares of New China Life Insurance to less than 5%. Yuyue Medical subsidiary increased its capital, and Tencent made a rare move under the balance sheet shrinkage.
          Overnight international market dynamics: the Dow rose 197.26 points, up 0.64%, to 31019.68 points; the NASDAQ rose 86.62 points, up 0.76%, to 11535.02 points; the S&P 500 rose 26.56 points, up 0.69%, to 3899.89 points; Gold Dec futures prices fell $5.3 on September 19 from the previous trading day, closing at 1678.2 dollars per ounce, down 0.31%; Silver Dec futures prices fell 2.3 cents and closed at $19.358 per ounce, down 0.12%; prices of light crude oil futures to be delivered in October on the NYMEX rose $0.62 and closed at $85.73 per barrel, up 0.73%; prices of London Brent crude oil futures to be delivered in November rose $ 0.66 and closed at $ 92.01 per barrel, up 0.72%.

          II. Technical Analysis

          2.1 HSI Daily Chart
          HSI: A-shares Listed on SSE and SZSE Open Higher, SSE Composite Index Up 0.39%_1
          The key resistance above is at 18950.
          2.2 HSI 4H Chart
          HSI: A-shares Listed on SSE and SZSE Open Higher, SSE Composite Index Up 0.39%_2
          The key resistance above is at 18865 and 18950.
          2.3 HSI 1H Chart
          HSI: A-shares Listed on SSE and SZSE Open Higher, SSE Composite Index Up 0.39%_3
          The key resistance above is at 18865 and 18890.
          HSI: A-shares Listed on SSE and SZSE Open Higher, SSE Composite Index Up 0.39%_4

          Trading Recommendations

          Go long on HSI at lows.
          Entry price: 18710
          Take profit: 18850
          Stop loss: 18595
          Risk Warnings and Disclaimers
          You understand and acknowledge that there is a high degree of risk involved in trading. Following any strategies or investment methods may lead to potential losses. The content on the site is provided by our contributors and analysts for information purposes only. You are solely responsible for determining whether any trading assets, securities, strategy, or any other product is suitable for investing based on your own investment objectives and financial situation.
          Add to Favorites
          Share
          FastBull
          Copyright © 2026 FastBull Ltd

          728 RM B 7/F GEE LOK IND BLDG NO 34 HUNG TO RD KWUN TONG KLN HONG KONG

          TelegramInstagramTwitterfacebooklinkedin
          App Store Google Play Google Play
          Products
          Charts

          Chats

          Q&A with Experts
          Screeners
          Economic Calendar
          Data
          Tools
          Membership
          Features
          Function
          Markets
          Copy Trading
          Latest Signals
          Contests
          24/7
          Analysis
          Education
          Company
          Careers
          About Us
          Contact Us
          Advertising
          Help Center
          Feedback
          User Agreement
          Privacy Policy
          Personal Information Protection Statement
          Business

          White Label

          Broker API

          Data API

          Web Plug-ins

          Poster Maker

          Affiliate Program

          Risk Disclosure

          The risk of loss in trading financial instruments such as stocks, FX, commodities, futures, bonds, ETFs and crypto can be substantial. You may sustain a total loss of the funds that you deposit with your broker. Therefore, you should carefully consider whether such trading is suitable for you in light of your circumstances and financial resources.

          No decision to invest should be made without thoroughly conducting due diligence by yourself or consulting with your financial advisors. Our web content might not suit you since we don't know your financial conditions and investment needs. Our financial information might have latency or contain inaccuracy, so you should be fully responsible for any of your trading and investment decisions. The company will not be responsible for your capital loss.

          Without getting permission from the website, you are not allowed to copy the website's graphics, texts, or trademarks. Intellectual property rights in the content or data incorporated into this website belong to its providers and exchange merchants.

          Not Logged In

          Log in to access more features

          Connect Broker
          Become a signal provider
          Help Center
          Customer Service
          Dark Mode
          Price Up/Down Colors

          Log In

          Sign Up

          Position
          Layout
          Fullscreen
          Default to Chart
          The chart page opens by default when you visit fastbull.com