• Trade
  • Markets
  • Copy
  • Contests
  • 24/7
  • Calendar
  • Q&A
  • Chats
Screeners
SYMBOL
LAST
BID
ASK
HIGH
LOW
NET CHG.
%CHG.
SPREAD
SOURCE
SPX
S&P 500 Index
7611.86
7611.86
7611.86
7662.23
7592.64
+31.79
+ 0.42%
--
--
DJI
Dow Jones Industrial Average
52292.16
52292.16
52292.16
52424.91
52008.23
+521.85
+ 1.01%
--
--
IXIC
NASDAQ Composite Index
25536.91
25536.91
25536.91
25799.46
25456.59
+99.93
+ 0.39%
--
--
USDX
US Dollar Index
101.518
101.518
101.598
101.833
101.238
-0.289
-0.28%
--
--
EURUSD
Euro / US Dollar
1.12001
1.12001
1.12009
1.12368
1.11496
+0.00440
+ 0.39%
--
--
GBPUSD
Pound Sterling / US Dollar
1.34113
1.34113
1.34123
1.34475
1.33787
+0.00253
+ 0.19%
--
--
XAUUSD
Gold / US Dollar
3962.71
3962.71
3963.05
3970.14
3882.06
+87.46
+ 2.26%
--
--
WTI
Light Sweet Crude Oil
94.789
94.789
94.819
101.810
94.268
-7.283
-7.14%
--
--

Community Accounts

Signal Accounts
--
Profit Accounts
--
Loss Accounts
--
View More

Become a signal provider

Sell trading signals to earn additional income

View More

Guide to Copy Trading

Get started with ease and confidence

View More

Signal Accounts for Members

All Signal Accounts

Best Return
  • Best Return
  • Best P/L
  • Best MDD
Past 1W
  • Past 1W
  • Past 1M
  • Past 1Y

All Contests

  • All
  • Recommend
  • Stocks
  • Cryptocurrencies
  • Central Banks
  • Trump Updates
  • Featured News
Top News Only
Share

On Monday (November 2), The Federal Reserve Used $5.087 Billion In Overnight Reverse Repurchase Agreements (RRPs) (with 6 Counterparties), Compared With $4.375 Billion In The Previous Trading Day

Share

U.S. Treasury Yields Fell To Their Lowest Level Since September 10; The 10-year U.S. Treasury Yield Is Now Down 5.76 Basis Points To 4.871%

Share

The Shanghai Crude Oil Futures Contract Fell 9% Intraday, Currently Trading At 678.10 Yuan

Share

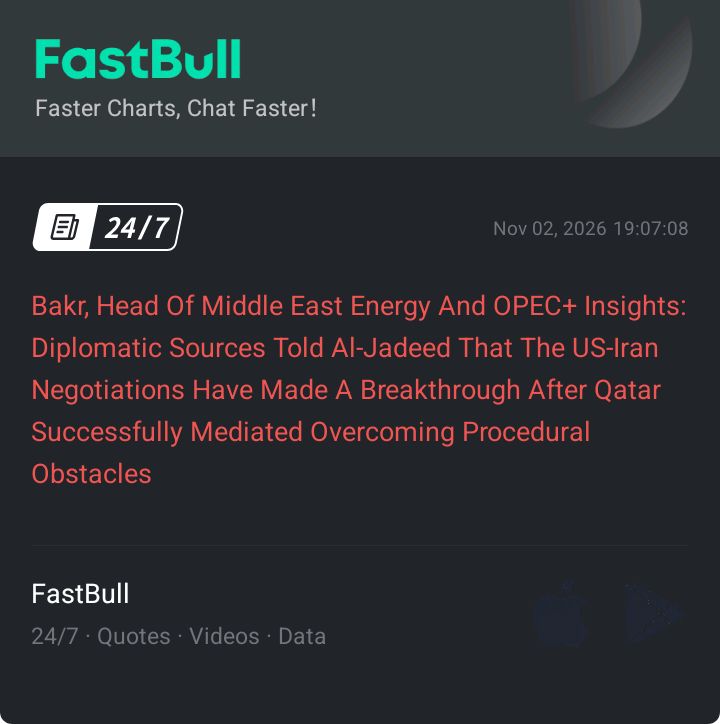
Bakr, Head Of Middle East Energy And OPEC+ Insights: Diplomatic Sources Told Al-Jadeed That The US-Iran Negotiations Have Made A Breakthrough After Qatar Successfully Mediated Overcoming Procedural Obstacles

Share

Ukraine's Emergency Services Say The Russian Attack On The Southeastern Village Of Komishuvakha Has Killed 24 People

Share

The Yield On The 30-year U.S. Treasury Note Fell To Its Lowest Level Since September 9, Dropping 6.57 Basis Points To 5.243%

Share

Brent Crude Oil Fell Below $104 Per Barrel, Down 8.40% On The Day

Share

WTI Crude Oil Fell 8% On The Day, Currently Trading At $95.77 Per Barrel

Share

WTI Crude Oil Fell Below $96 Per Barrel, Down 7.85% On The Day

Share

Ukrainian Prime Minister: In Addition, The Two Sides Also Discussed The Progress Of International Financial Support, IMF Projects And The Ukrainian Aid Mechanism

Share

Ukrainian Prime Minister: Discussions Have Been Held With The EU To Expedite The Accession Negotiations And Open The Remaining Negotiation Cluster

Share

According To Israeli Media: The Chairman Of The Israeli Election Commission Rejected The Demands Of Prime Minister Netanyahu's Camp, And The Election Results Will Be Announced As Scheduled

Share

Italy's Budget Deficit In October Was €20.8 Billion

Share

According To A Filing With The U.S. Securities And Exchange Commission (SEC), Estée Lauder Stated That Tariffs Had A Negative Impact On Its Operating Results In The First Quarter Of Fiscal Year 2027

Share

Ukrainian President Zelensky: Russian Attack On Humanitarian Aid Center In Komeshuvakha, Zaporizhzhia Oblast, Has Killed 18 People

Share

Brent Crude Oil Fell Below $104 Per Barrel, Down 6.89% On The Day

Share

The Shanghai Crude Oil Futures Contract Fell 8% Intraday, Currently Trading At 685.40 Yuan

Share

Spot Gold Broke Through $3,970 Per Ounce, Up 2.40% On The Day

Share

New York Gold Futures Broke Through $3,980 Per Ounce, Up 2.08% On The Day

Share

Brent Crude Oil Fell Below $105 Per Barrel, Down 7.43% On The Day

TIME
ACT
FCST
PREV
IMPACT
China, Mainland NBS Non-manufacturing PMI (Oct)

A:--

F: --

P: --

XAUUSD
  • XAUUSD
  • XAGUSD
  • WTI
  • USDX
South Korea Trade Balance Prelim (Oct)

A:--

F: --

P: --
XAUUSD
  • XAUUSD
  • XAGUSD
  • WTI
  • USDX
Indonesia IHS Markit Manufacturing PMI (Oct)

A:--

F: --

P: --

XAUUSD
  • XAUUSD
  • XAGUSD
  • WTI
  • USDX
Australia Building Permits YoY (SA) (Sept)

A:--

F: --

P: --

AUDUSD
  • AUDUSD
  • XAUUSD
  • XAGUSD
  • WTI
  • USDX
Australia Building Permits MoM (SA) (Sept)

A:--

F: --

P: --
AUDUSD
  • AUDUSD
  • XAUUSD
  • XAGUSD
  • WTI
  • USDX
Australia Private Building Permits MoM (SA) (Sept)

A:--

F: --

P: --

AUDUSD
  • AUDUSD
  • XAUUSD
  • XAGUSD
  • WTI
  • USDX
Japan Manufacturing PMI Final (Oct)

A:--

F: --

P: --

USDJPY
  • USDJPY
  • XAUUSD
  • XAGUSD
  • WTI
  • USDX
South Korea IHS Markit Manufacturing PMI (SA) (Oct)

A:--

F: --

P: --

XAUUSD
  • XAUUSD
  • XAGUSD
  • WTI
  • USDX
China, Mainland Caixin Manufacturing PMI (SA) (Oct)

A:--

F: --

P: --

XAUUSD
  • XAUUSD
  • XAGUSD
  • WTI
  • USDX
Indonesia Inflation Rate YoY (Oct)

A:--

F: --

P: --

XAUUSD
  • XAUUSD
  • XAGUSD
  • WTI
  • USDX
Indonesia Trade Balance (Sept)

A:--

F: --

P: --

XAUUSD
  • XAUUSD
  • XAGUSD
  • WTI
  • USDX
Indonesia Core Inflation YoY (Oct)

A:--

F: --

P: --

XAUUSD
  • XAUUSD
  • XAGUSD
  • WTI
  • USDX
India HSBC Manufacturing PMI Final (Oct)

A:--

F: --

P: --

XAUUSD
  • XAUUSD
  • XAGUSD
  • WTI
  • USDX
Australia Commodity Price YoY (Oct)

A:--

F: --

P: --

AUDUSD
  • AUDUSD
  • XAUUSD
  • XAGUSD
  • WTI
  • USDX
Russia IHS Markit Manufacturing PMI (Oct)

A:--

F: --

P: --

WTI
  • WTI
  • XAUUSD
  • XAGUSD
  • USDX
Germany Actual Retail Sales MoM (Sept)

A:--

F: --

P: --
EURUSD
  • EURUSD
  • XAUUSD
  • XAGUSD
  • WTI
  • USDX
Turkey Manufacturing PMI (Oct)

A:--

F: --

P: --

XAUUSD
  • XAUUSD
  • XAGUSD
  • WTI
  • USDX
Italy Manufacturing PMI (SA) (Oct)

A:--

F: --

P: --

EURUSD
  • EURUSD
  • XAUUSD
  • XAGUSD
  • WTI
  • USDX
South Africa Manufacturing PMI (Oct)

A:--

F: --

P: --

XAUUSD
  • XAUUSD
  • XAGUSD
  • WTI
  • USDX
Euro Zone Manufacturing PMI Final (Oct)

A:--

F: --

P: --

EURUSD
  • EURUSD
  • XAUUSD
  • XAGUSD
  • WTI
  • USDX
U.K. Manufacturing PMI Prelim (Oct)

A:--

F: --

P: --

GBPUSD
  • GBPUSD
  • XAUUSD
  • XAGUSD
  • WTI
  • USDX
Canada National Economic Confidence Index

A:--

F: --

P: --

USDCAD
  • USDCAD
  • XAUUSD
  • XAGUSD
  • WTI
  • USDX
Canada Manufacturing PMI (SA) (Oct)

A:--

F: --

P: --

USDCAD
  • USDCAD
  • XAUUSD
  • XAGUSD
  • WTI
  • USDX
U.S. IHS Markit Manufacturing PMI Final (Oct)

A:--

F: --

P: --

USDX
  • USDX
  • XAUUSD
  • XAGUSD
  • WTI
U.S. ISM Inventories Index (Oct)

A:--

F: --

P: --

USDX
  • USDX
  • XAUUSD
  • XAGUSD
  • WTI
U.S. Construction Spending MoM (Sept)

A:--

F: --

P: --
USDX
  • USDX
  • XAUUSD
  • XAGUSD
  • WTI
U.S. ISM Output Index (Oct)

A:--

F: --

P: --

USDX
  • USDX
  • XAUUSD
  • XAGUSD
  • WTI
U.S. ISM Manufacturing Employment Index (Oct)

A:--

F: --

P: --

USDX
  • USDX
  • XAUUSD
  • XAGUSD
  • WTI
U.S. ISM Manufacturing PMI (Oct)

A:--

F: --

P: --

USDX
  • USDX
  • XAUUSD
  • XAGUSD
  • WTI
U.S. ISM Manufacturing New Orders Index (Oct)

A:--

F: --

P: --

USDX
  • USDX
  • XAUUSD
  • XAGUSD
  • WTI
U.S. Dallas Fed PCE Price Index YoY (Sept)

--

F: --

P: --

South Korea CPI YoY (Oct)

--

F: --

P: --

Australia Overnight (Borrowing) Key Rate

--

F: --

P: --

RBA Rate Statement
Saudi Arabia IHS Markit Composite PMI (Oct)

--

F: --

P: --

RBA Press Conference
Turkey CPI YoY (Oct)

--

F: --

P: --

Turkey PPI YoY (Oct)

--

F: --

P: --

Brazil IHS Markit Manufacturing PMI (Oct)

--

F: --

P: --

U.S. Weekly Redbook Index YoY

--

F: --

P: --

U.S. JOLTS Job Openings (SA) (Sept)

--

F: --

P: --

U.S. Factory Orders MoM (Sept)

--

F: --

P: --

U.S. Factory Orders MoM (Excl. Transport) (Sept)

--

F: --

P: --

U.S. Factory Orders MoM (Excl. Defense) (Sept)

--

F: --

P: --

Mexico Manufacturing PMI (Oct)

--

F: --

P: --

U.S. API Weekly Crude Oil Stocks

--

F: --

P: --

U.S. API Weekly Cushing Crude Oil Stocks

--

F: --

P: --

U.S. API Weekly Gasoline Stocks

--

F: --

P: --

U.S. API Weekly Refined Oil Stocks

--

F: --

P: --

Australia Services PMI Prelim (Oct)

--

F: --

P: --

Japan Monetary Base YoY (SA) (Oct)

--

F: --

P: --

China, Mainland Caixin Composite PMI (Oct)

--

F: --

P: --

China, Mainland Caixin Services PMI (Oct)

--

F: --

P: --

India HSBC Services PMI Final (Oct)

--

F: --

P: --

India IHS Markit Composite PMI (Oct)

--

F: --

P: --

Q&A with Experts
    • All
    • Chatrooms
    • Groups
    • Friends
    EuroTrader flag
    Eon
    @EuroTrader also price has FVGs so unable to sustain uptrend maybe
    @Eonexactly, the fvg are more like a magnet thats pulling price to itself agressively, real time
    RPGFX flag
    Eon
    @EuroTrader also price has FVGs so unable to sustain uptrend maybe
    @Eonon 15 min, price has already rebalanced all the nearest fair value gap
    EuroTrader flag
    Eon
    @EuroTrader also price has FVGs so unable to sustain uptrend maybe
    @Eonfvgs are like magent that attracts price to itself, really attractive to fair value gaps
    RPGFX flag
    Eon
    @EuroTrader also price has FVGs so unable to sustain uptrend maybe
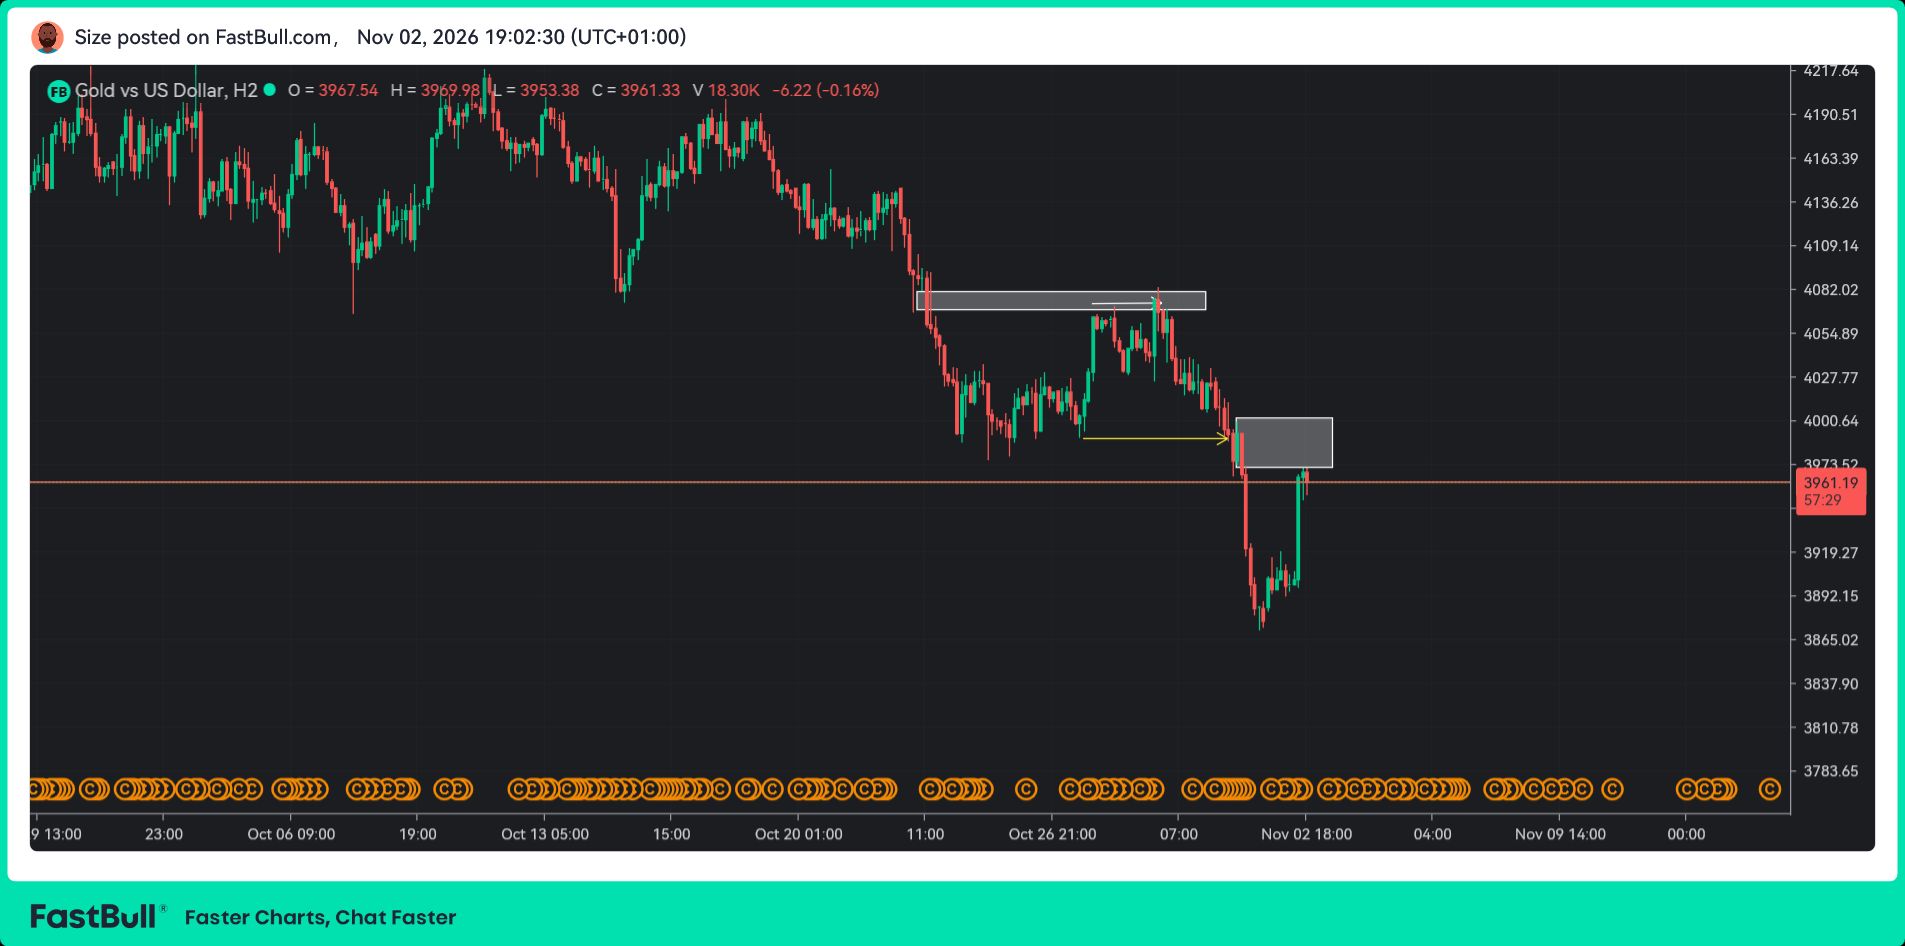
    @Eon The next fair value gap both on 15 minutes and 1 hour is below 3934
    RPGFX flag
    RPGFX
    @Eon The next fair value gap both on 15 minutes and 1 hour is below 3934
    @EonI don't think I see price dropping down to this level anytime soon
    Size flag
    Eon flag
    RPGFX
    @EonI don't think I see price dropping down to this level anytime soon
    @RPGFX hmmm mate, I see myself holding overnight shorts here
    Size flag
    "Eon" recalled a message
    Eon flag
    RPGFX
    @EonI don't think I see price dropping down to this level anytime soon
    @RPGFX only problem I have is that I will have to make my SL wider - risking more capital
    Matthew flag
    EuroTrader
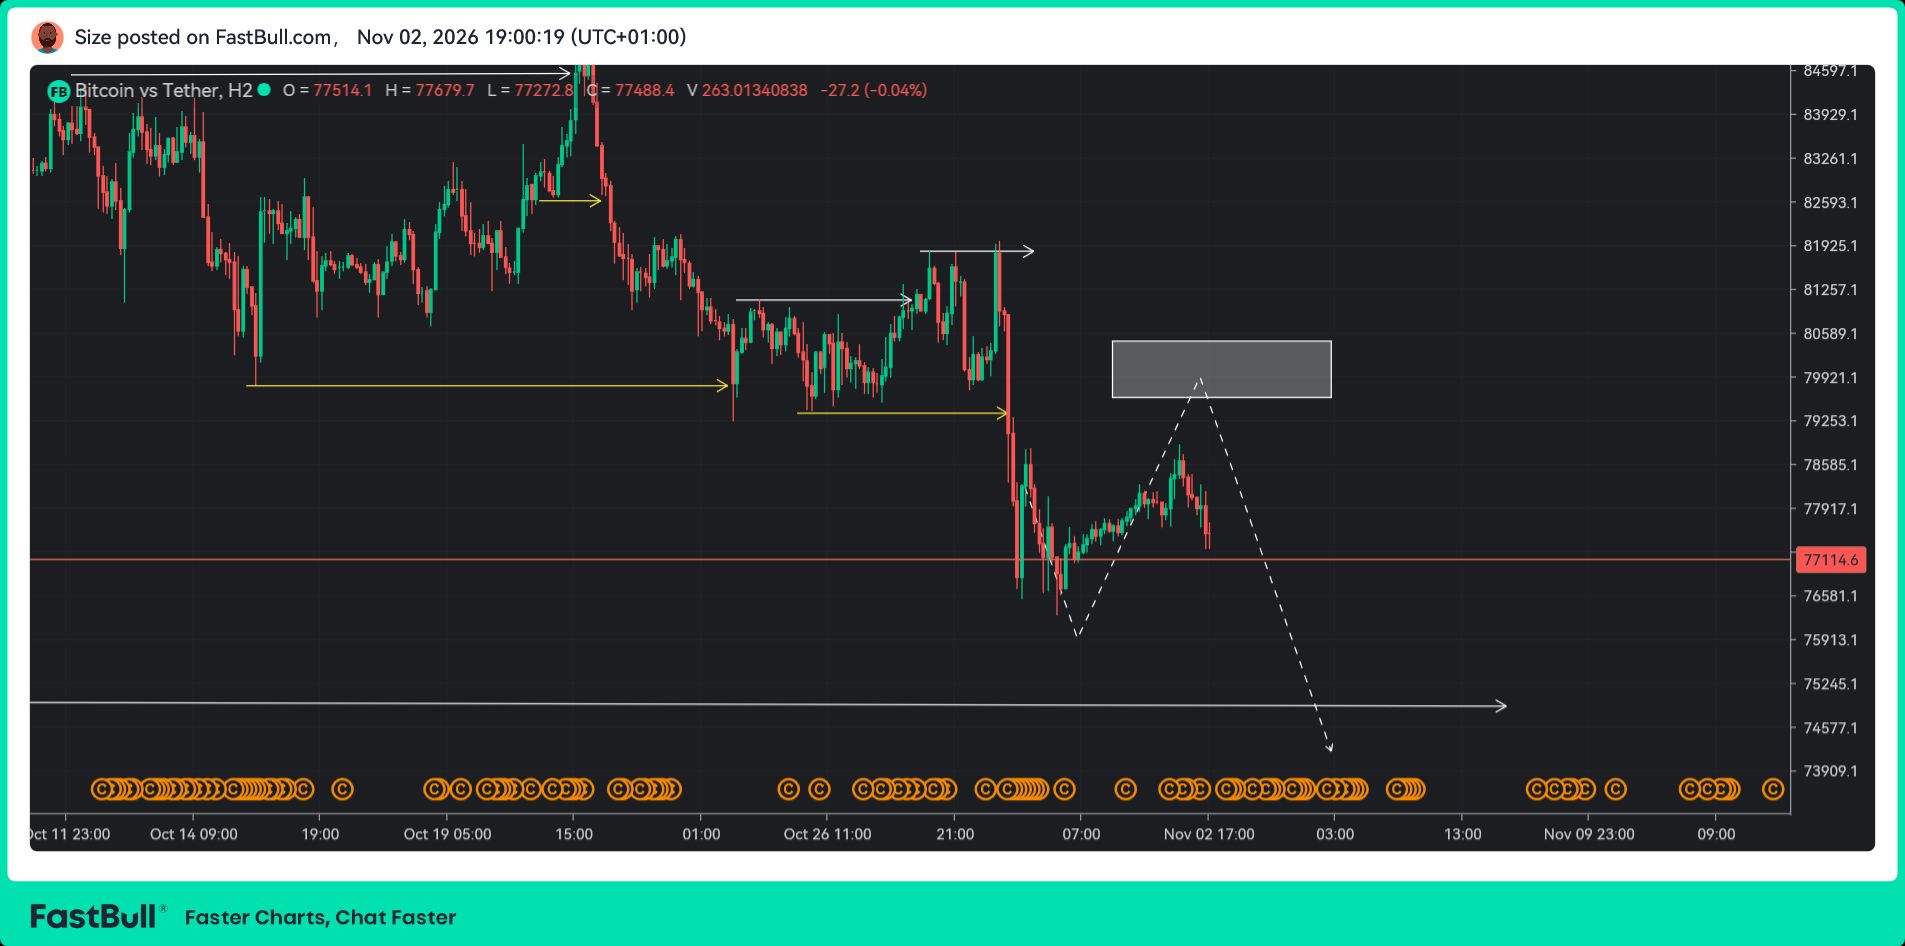
    @EuroTraderbitcoin even going down lower, am happy i didnt go in lomng
    Matthew flag
    EuroTrader
    @EuroTraderi am out at breakeven
    EuroTrader flag
    Matthew
    @EuroTraderi am out at breakeven
    @Matthewits all good buddy, at least you didnt lose money, thats the most important thing about everything
    EuroTrader flag
    Matthew
    @EuroTraderbitcoin even going down lower, am happy i didnt go in lomng
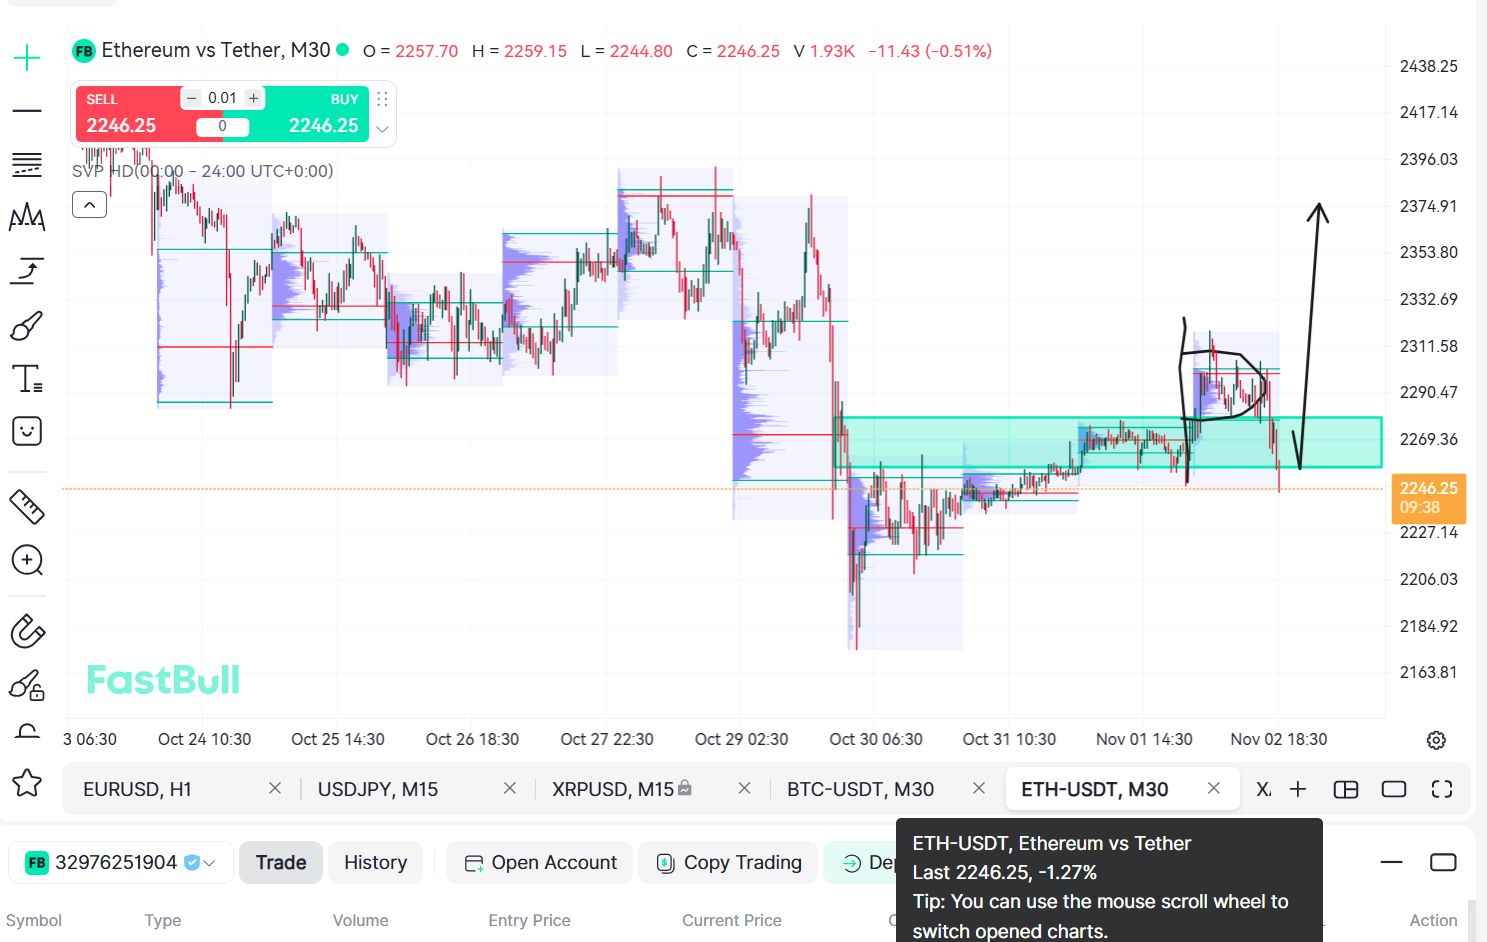
    @Matthewi took the loss and now in a small drawdown on eth but i guess this is just a liquidity sweep
    Size flag
    Eon
    @RPGFX hmmm mate, I see myself holding overnight shorts here
    @EonInteresting take, mate. Are you referring to gold, or another pair?
    Matthew flag
    Matthew
    @EuroTraderi am out at breakeven
    this trade i took is just a testament of folow the pla and accept the result of the trade regardless
    Eon flag
    Size
    @EonInteresting take, mate. Are you referring to gold, or another pair?
    @Size on Gold mate
    EuroTrader flag
    @Matthewthats the way it should be, follow your set plan and accept the outcome of the particular trade
    Size flag
    Size flag
    Size
    This could be an interesting development for the markets, especially oil and gold@Eon
    Type here...
    Add Symbol or Code

      No matching data

      All
      Recommend
      Stocks
      Cryptocurrencies
      Central Banks
      Trump Updates
      Featured News
      • All
      • Russia-Ukraine Conflict
      • Middle East Flashpoint
      • All
      • Russia-Ukraine Conflict
      • Middle East Flashpoint
      Search
      Products

      Charts Free Forever

      Chats Q&A with Experts
      Screeners Economic Calendar Data Tools
      Membership Features
      Data Warehouse Market Trends Institutional Data Policy Rates Macro

      Market Trends

      Market Sentiment Order Book Forex Correlations

      Top Indicators

      Charts Free Forever
      Markets

      News

      24/7 Analysis Education

      Latest Views

      Latest Update

      Signals

      Copy Rankings Latest Signals Become a signal provider AI Rating
      Contests
      Brokers

      Overview Brokers Assessment Rankings Regulators News Claims
      Broker listing Forex Brokers Comparison Tool Live Spread Comparison Scam
      Q&A Complaint Scam Alert Videos Tips to Detect Scam
      More

      Business
      Events
      Careers About Us Advertising Help Center

      White Label

      Broker API

      Data API

      Web Plug-ins

      Affiliate Program

      Awards Institution Evaluation IB Seminar Salon Event Exhibition
      Vietnam Thailand Singapore Dubai
      Fans Party Investment Sharing Session
      FastBull Summit BrokersView Expo
      Recent Searches
        Top Searches
          Markets
          Analysis
          User
          24/7
          Economic Calendar
          Education
          Data
          • Names
          • Latest
          • Prev

          View All

          No data

          Scan to Download

          Faster Charts, Chat Faster!

          Download
          English
          • English
          • Español
          • العربية
          • Bahasa Indonesia
          • Bahasa Melayu
          • Tiếng Việt
          • ภาษาไทย
          • Français
          • Italiano
          • Türkçe
          • Русский язык
          • 简中
          • 繁中
          Open Account
          Search
          Products
          Charts Free Forever
          Markets
          News
          Signals

          Copy Rankings Latest Signals Become a signal provider AI Rating
          Contests
          Brokers

          Overview Brokers Assessment Rankings Regulators News Claims
          Broker listing Forex Brokers Comparison Tool Live Spread Comparison Scam
          Q&A Complaint Scam Alert Videos Tips to Detect Scam
          More

          Business
          Events
          Careers About Us Advertising Help Center

          White Label

          Broker API

          Data API

          Web Plug-ins

          Affiliate Program

          Awards Institution Evaluation IB Seminar Salon Event Exhibition
          Vietnam Thailand Singapore Dubai
          Fans Party Investment Sharing Session
          FastBull Summit BrokersView Expo
          NNE (NANO Nuclear Energy) -- USD-- --
          View on social charts
          Markets / US / NANO Nuclear Energy

          NNE (NANO Nuclear Energy)

          FastBull US
          -- USD-- --
          NASDAQ
          -- -- Suspended
          -- USD -- --
          -- --
          View on social charts
          Overview
          News
          Technicals
          Finance
          Analysis
          Company
          1 Day
          -3.57%
          5 Days
          +212.33%
          1 Month
          -29.06%
          6 Months
          -51.91%
          YTD
          -54.83%
          1 Year
          -76.35%
          5 Years
          +116.65%
          All Time
          +181.10%
          Share
          Download image
          Copy image
          Copy Link
          Open in new tab
          --
          Open
          --
          Prev. Close
          --
          52wk High
          --
          52wk Low
          --
          Turnover
          --
          Volume
          --
          P/E TTM
          --
          P/B Ratio
          --
          Dividend (TTM)
          --
          Div Yield (TTM)
          --
          Mkt Cap
          --
          Share Capital
          --
          Float Mkt Cap
          --
          Free Float
          --
          High
          --
          Low
          --
          All-time High
          --
          All-time Low
          --
          Turnover Ratio
          --
          Amplitude
          Expand
          Financial Indicators
          Revenue Performance
          Annual Quarterly

          No data

          Currency Unit: USD
          Income and Expenditure

          No data

          Currency Unit: USD
          COGS
          Gross Profit
          Operating Expenses
          Operating Profit
          Taxes and Others
          Non-operating Income/Expenses
          Net Income
          Debt Level
          Annual Quarterly

          No data

          Currency Unit: USD
          EPS

          No data

          Currency Unit: USD
          Technicals
          15m
          30m
          1H
          4H
          1D
          1W
          1M
          Candlestick Patterns
          PATTERNS TIMEFRAME TIME ACTION
          Technicals

          Oscillators

          Neutral
          Sell Buy
          Strong Sell Strong Buy
          --
          Sell: --
          Neutral: --
          Buy: --

          Summary

          Neutral
          Sell Buy
          Strong Sell Strong Buy
          --
          Sell: --
          Neutral: --
          Buy: --

          Moving Averages

          Neutral
          Sell Buy
          Strong Sell Strong Buy
          --
          Sell: --
          Neutral: --
          Buy: --
          Credit Rating

          Analyst Ratings

          Target Price

          Company Info

          Overview
          Key Indicators
          Revenue Breakdown
          Dividend
          Income Statement
          Balance Sheet
          Cash Flow Statement
          Earnings Report
          • Period

            --

            --

          • Revenue (YoY)

            --

            --

          • EPS (YoY)

            --

            --

          • Analyst Ratings

            --

            --

          Revenue Breakdown
          • By Source/Business
            Stage: --

            No data

          • By Country
            Stage: --

            No data

          Financial Prediction
          • Revenue
          • EPS
          • Operating Profit
          Income Statement

          No data

          Financial Condition

          No data

          EPS
          Quarterly
          • Annual
          • Quarterly
          • Cumulative Quarterly

          No data

          Free Cash Flow
          Quarterly
          • Annual
          • Quarterly
          • Cumulative Quarterly

          No data

          Current Ratio
          Quarterly
          • Annual
          • Quarterly
          • Cumulative Quarterly

          No data

          Quick Ratio
          Quarterly
          • Annual
          • Quarterly
          • Cumulative Quarterly

          No data

          Return on Net Assets
          Quarterly
          • Annual
          • Quarterly
          • Cumulative Quarterly

          No data

          Return on Total Assets
          Quarterly
          • Annual
          • Quarterly
          • Cumulative Quarterly

          No data

          Gross Margin
          Quarterly
          • Annual
          • Quarterly
          • Cumulative Quarterly

          No data

          Net Profit Margin
          Quarterly
          • Annual
          • Quarterly
          • Cumulative Quarterly

          No data

          By Source/Business

          No data

          By Country

          No data

          Dividend Overview

          No data

          Dividend Payment History
          ANNOUNCEMENT DATE DISTRIBUTION PLAN RECORD DATE EX-DIVIDEND DATE PAYMENT DATE FREQUENCY

          No data

            YoY
            Hide Blank Lines

            No data

            No data

              YoY
              Hide Blank Lines

              No data

              No data

                YoY
                Hide Blank Lines

                No data

                • Announcements
                • Ratings

                No data

                Technical Analysis
                Candlestick Patterns
                Pivot Points
                15m
                30m
                1H
                4H
                1D
                1W
                1M

                Oscillators

                Neutral
                Sell Buy
                Strong Sell Strong Buy
                --
                Sell: --
                Neutral: --
                Buy: --

                Summary

                Neutral
                Sell Buy
                Strong Sell Strong Buy
                --
                Sell: --
                Neutral: --
                Buy: --

                Moving Averages

                Neutral
                Sell Buy
                Strong Sell Strong Buy
                --
                Sell: --
                Neutral: --
                Buy: --
                Oscillators
                Names Value Action
                Moving Averages
                Names Value Action
                All Timeframes
                • All Timeframes
                • 15m
                • 30m
                • 1H
                • 4H
                • 1D
                • 1W
                • 1M
                All Trends
                • All Trends
                • Bullish
                • Bearish
                All Patterns
                  PATTERNS NAME TRENDS TIMEFRAME TIME ACTION
                  4H
                  1D
                  1W
                  1M
                  Standard
                  • Standard
                  • Fibonacci
                  • Demark’s
                  • Camarilla
                  • Woodie’s
                  Pivot Points
                  Pivot Points Standard Fibonacci Demark’s Camarilla Woodie’s
                  S3
                  --
                  --
                  --
                  --
                  --
                  S2
                  --
                  --
                  --
                  --
                  --
                  S1
                  --
                  --
                  --
                  --
                  --
                  P
                  --
                  --
                  --
                  --
                  --
                  R1
                  --
                  --
                  --
                  --
                  --
                  R2
                  --
                  --
                  --
                  --
                  --
                  R3
                  --
                  --
                  --
                  --
                  --

                  Short Interest

                  No data

                  RELEASE TIME Short Interest Daily Short Sales Days to Cover

                  Analyst Ratings

                  Based on analysts stock ratings to {0} over the past 3 months

                  Price Forecast

                  Agency Rating

                  TIME RATING AGENCY RATING CHANGETARGET CHANGE PREV./CURR. RATING

                  No data

                  View More

                  Company Info

                  Company Executives

                  NAME POSITION ANNUAL SALARY AGE

                  Executives Details

                  INDIVIDUAL/ORGANIZATION TRADING TYPES HOLDING TYPES TRADED HOLDINGS TRADING PRICE REMAINING HOLDINGS DATE

                  Top Institutional Holders

                  HOLDER SHARES REPORTING DATE RATIO VALUE

                  Biggest Mutual Fund Holder

                  HOLDER SHARES REPORTING DATE RATIO VALUE
                  Dividends
                  ANNOUNCEMENT DATE DISTRIBUTION PLAN RECORD DATE EX-DIVIDEND DATE PAYMENT DATE

                  Stock Splits

                  EX-RIGHTS DATE RATIO
                  Create Alert

                  FastBull

                  Send alert only once
                  Send alert once a day
                  Rise above
                  Drop below
                  Rise by %
                  Drop by %
                  Create
                  FastBull
                  Copyright © 2026 FastBull Ltd

                  728 RM B 7/F GEE LOK IND BLDG NO 34 HUNG TO RD KWUN TONG KLN HONG KONG

                  TelegramInstagramTwitterfacebooklinkedin
                  App Store Google Play Android Windows
                  Products
                  Charts

                  Chats

                  Q&A with Experts
                  Screeners
                  Economic Calendar
                  Data
                  Tools
                  Membership
                  Features
                  Function
                  Markets
                  Copy Trading
                  Latest Signals
                  Contests
                  24/7
                  Analysis
                  Education
                  Company
                  Careers
                  About Us
                  Contact Us
                  Advertising
                  Download FastBull
                  Help Center
                  Feedback
                  User Agreement
                  Privacy Policy
                  Personal Information Protection Statement
                  Business

                  White Label

                  Broker API

                  Data API

                  Web Plug-ins

                  Poster Maker

                  Affiliate Program

                  Risk Disclosure

                  The risk of loss in trading financial instruments such as stocks, FX, commodities, futures, bonds, ETFs and crypto can be substantial. You may sustain a total loss of the funds that you deposit with your broker. Therefore, you should carefully consider whether such trading is suitable for you in light of your circumstances and financial resources.

                  No decision to invest should be made without thoroughly conducting due diligence by yourself or consulting with your financial advisors. Our web content might not suit you since we don't know your financial conditions and investment needs. Our financial information might have latency or contain inaccuracy, so you should be fully responsible for any of your trading and investment decisions. The company will not be responsible for your capital loss.

                  Without getting permission from the website, you are not allowed to copy the website's graphics, texts, or trademarks. Intellectual property rights in the content or data incorporated into this website belong to its providers and exchange merchants.

                  Not Logged In

                  Log in to access more features

                  Connect Broker
                  Become a signal provider
                  Help Center
                  Customer Service
                  Dark Mode
                  Price Up/Down Colors

                  Log In

                  Sign Up

                  Position
                  Layout
                  Fullscreen
                  Default to Chart
                  The chart page opens by default when you visit fastbull.com