• Trade
  • Markets
  • Copy
  • Contests
  • 24/7
  • Calendar
  • Q&A
  • Chats
Screeners
SYMBOL
LAST
BID
ASK
HIGH
LOW
NET CHG.
%CHG.
SPREAD
SOURCE
SPX
S&P 500 Index
7690.73
7690.73
7690.73
7731.18
7684.79
+31.29
+ 0.41%
--
--
DJI
Dow Jones Industrial Average
51966.03
51966.03
51966.03
52134.58
51863.80
-36.38
-0.07%
--
--
IXIC
NASDAQ Composite Index
26430.88
26430.88
26430.88
26613.15
26344.67
+290.85
+ 1.11%
--
--
USDX
US Dollar Index
101.640
101.640
101.720
101.740
101.640
-0.120
-0.12%
--
--
EURUSD
Euro / US Dollar
1.12247
1.12247
1.12257
1.12249
1.12069
+0.00142
+ 0.13%
--
--
GBPUSD
Pound Sterling / US Dollar
1.33239
1.33239
1.33252
1.33241
1.32950
+0.00215
+ 0.16%
--
--
XAUUSD
Gold / US Dollar
4136.57
4136.57
4137.02
4143.82
4115.55
-4.16
-0.10%
--
--
WTI
Light Sweet Crude Oil
98.274
98.274
98.309
98.736
97.806
+0.228
+ 0.23%
--
--

Community Accounts

Signal Accounts
--
Profit Accounts
--
Loss Accounts
--
View More

Become a signal provider

Sell trading signals to earn additional income

View More

Guide to Copy Trading

Get started with ease and confidence

View More

Signal Accounts for Members

All Signal Accounts

Best Return
  • Best Return
  • Best P/L
  • Best MDD
Past 1W
  • Past 1W
  • Past 1M
  • Past 1Y

All Contests

  • All
  • Recommend
  • Stocks
  • Cryptocurrencies
  • Central Banks
  • Trump Updates
  • Featured News
Top News Only
Share

The National Development And Reform Commission: It Is Currently Studying And Formulating An Implementation Plan For The Strategy Of Expanding Domestic Demand

Share

Lithium Carbonate Futures Contract 2701 Rose During The Session, With Gains Widening To 1.73%, And Last Quoted At 101,100 Yuan/ton; The Trading Volume Was Approximately 18.638 Billion Yuan, With An Increase Of 15,400 Lots In Open Interest During The Day, Indicating A Significant Change In Open Interest

Share

Pan Gongsheng, Governor Of China's Central Bank, Met With Ray Dalio, Founder Of Bridgewater Associates

Share

China Development Bank: During The 14th Five-Year Plan Period, It Has Cumulatively Issued More Than 2 Trillion Yuan In Loans Related To Urban Renewal

Share

The Most Active Rapeseed Meal Futures Contract Fell 3% Intraday, Currently Trading At 2279.00 Yuan

Share

The Winning Bid Rate For China's 1-month Treasury Cash Deposit Was 1.44%, Down From 1.62% Previously; The Winning Bid Rate For The 3-month Treasury Cash Deposit Was 1.50%, Down From 1.47% Previously

Share

The National Development And Reform Commission Stated That It Will Introduce New Incremental Policies As Needed To Ensure That The Economy Operates Within A Reasonable Range

Share

The National Development And Reform Commission Stated That In The First Three Quarters, New Drivers Of Growth, Such As The Smart Economy, Contributed More Than 40% To Economic Growth

Share

According To Data Released By Shanghai Steel Union, The Mid-price Of MMLC Battery-grade Lithium Carbonate (morning Session) Was 102,450 Yuan/ton Today, An Increase Of 700 Yuan/ton Compared To The Price At 16:30 The Previous Day

Share

Chongqing: The City's GDP Reached 2,571.151 Billion Yuan In The First Three Quarters

Share

Sanae Kaohsiung Stated That She Would Not Fund The Food Sales Tax Reduction By Issuing Deficit Bonds

Share

Sichuan Province's GDP Grew By 4.9% In The First Three Quarters

Share

The New Taiwan Dollar Depreciated To 32.60 Against The US Dollar

Share

Indonesia's Benchmark Stock Index Rose 2.6% To 5,125 Points

Share

In The First Three Quarters, The National Railway Transported 1.56 Billion Tons Of Coal, Of Which 1.04 Billion Tons Were For Power Generation. The Coal Reserves Of Railway-powered Power Plants Across The Country Remained At A High Level

Share

The New Taiwan Dollar Depreciated To 32.588 Against The US Dollar, Its Lowest Level Since April 2025

Share

China's National Bureau Of Statistics: The Information Transmission, Software And Information Technology Services Industry Grew By 9.8% Year-on-Year In The Third Quarter

Share

In The Third Quarter, The Number Of Inbound And Outbound Transportation Vehicles Inspected By Immigration Management Agencies Nationwide Increased By 10.6% Year-on-Year

Share

In The Third Quarter, There Were 192 Million Inbound And Outbound Trips, With Over 70% Of Inbound Foreigners Receiving Visa-free Entry

Share

The Indonesian Rupiah Strengthened Against The US Dollar To 18,010

TIME
ACT
FCST
PREV
IMPACT
U.S. Import Price Index MoM (Sept)

A:--

F: --

P: --
USDX
  • USDX
  • XAUUSD
  • XAGUSD
  • WTI
U.S. Export Price Index YoY (Sept)

A:--

F: --

P: --

USDX
  • USDX
  • XAUUSD
  • XAGUSD
  • WTI
Saudi Arabia Crude Oil Production

A:--

F: --

P: --

WTI
  • WTI
  • XAUUSD
  • XAGUSD
  • USDX
U.S. Manufacturing Output MoM (SA) (Sept)

A:--

F: --

P: --
USDX
  • USDX
  • XAUUSD
  • XAGUSD
  • WTI
U.S. Industrial Output MoM (SA) (Sept)

A:--

F: --

P: --
USDX
  • USDX
  • XAUUSD
  • XAGUSD
  • WTI
U.S. Capacity Utilization MoM (SA) (Sept)

A:--

F: --

P: --
WTI
  • WTI
  • XAUUSD
  • XAGUSD
  • USDX
U.S. Manufacturing Capacity Utilization (Sept)

A:--

F: --

P: --

USDX
  • USDX
  • XAUUSD
  • XAGUSD
  • WTI
U.S. Industrial Output YoY (Sept)

A:--

F: --

P: --

USDX
  • USDX
  • XAUUSD
  • XAGUSD
  • WTI
U.S. Weekly Total Oil Rig Count

A:--

F: --

P: --

WTI
  • WTI
  • XAUUSD
  • XAGUSD
  • USDX
U.S. Weekly Total Rig Count

A:--

F: --

P: --

WTI
  • WTI
  • XAUUSD
  • XAGUSD
  • USDX
BOE Gov Bailey Speaks
U.K. Rightmove House Price Index YoY (Oct)

A:--

F: --

P: --

GBPUSD
  • GBPUSD
  • XAUUSD
  • XAGUSD
  • WTI
  • USDX
BOJ Gov Ueda Speaks
China, Mainland Industrial Output YoY (YTD) (Sept)

A:--

F: --

P: --

XAUUSD
  • XAUUSD
  • XAGUSD
  • WTI
  • USDX
China, Mainland GDP YoY (YTD) (Q3)

A:--

F: --

P: --

XAUUSD
  • XAUUSD
  • XAGUSD
  • WTI
  • USDX
China, Mainland GDP YoY (Q3)

A:--

F: --

P: --

XAUUSD
  • XAUUSD
  • XAGUSD
  • WTI
  • USDX
China, Mainland GDP (Q3)

A:--

F: --

P: --

XAUUSD
  • XAUUSD
  • XAGUSD
  • WTI
  • USDX
China, Mainland GDP QoQ (SA) (Q3)

A:--

F: --

P: --

XAUUSD
  • XAUUSD
  • XAGUSD
  • WTI
  • USDX
China, Mainland Urban Area Unemployment Rate (Sept)

A:--

F: --

P: --

XAUUSD
  • XAUUSD
  • XAGUSD
  • WTI
  • USDX
ECB Chief Economist Lane Speaks
Canada National Economic Confidence Index

A:--

F: --

P: --

USDCAD
  • USDCAD
  • XAUUSD
  • XAGUSD
  • WTI
  • USDX
Canada Trimmed CPI YoY (SA) (Sept)

A:--

F: --

P: --

WTI
  • WTI
  • XAUUSD
  • XAGUSD
  • USDX
Canada Core CPI YoY (Sept)

A:--

F: --

P: --

WTI
  • WTI
  • XAUUSD
  • XAGUSD
  • USDX
Canada CPI MoM (Sept)

A:--

F: --

P: --

WTI
  • WTI
  • XAUUSD
  • XAGUSD
  • USDX
Canada Core CPI MoM (Sept)

A:--

F: --

P: --

WTI
  • WTI
  • XAUUSD
  • XAGUSD
  • USDX
Canada CPI YoY (Sept)

A:--

F: --

P: --

WTI
  • WTI
  • XAUUSD
  • XAGUSD
  • USDX
U.S. NAHB Housing Market Index (Oct)

A:--

F: --

P: --

USDX
  • USDX
  • XAUUSD
  • XAGUSD
  • WTI
Argentina Trade Balance (Sept)

A:--

F: --

P: --

XAUUSD
  • XAUUSD
  • XAGUSD
  • WTI
  • USDX
China, Mainland 1-Year Loan Prime Rate (LPR)

A:--

F: --

P: --

XAUUSD
  • XAUUSD
  • XAGUSD
  • WTI
  • USDX
China, Mainland 5-Year Loan Prime Rate

A:--

F: --

P: --

XAUUSD
  • XAUUSD
  • XAGUSD
  • WTI
  • USDX
ECB Chief Economist Lane Speaks
U.K. 3-Month ILO Unemployment Rate (Aug)

--

F: --

P: --

U.K. Unemployment Rate (Sept)

--

F: --

P: --

U.K. Unemployment Claimant Count (Sept)

--

F: --

P: --

U.K. 3-Month ILO Employment Change (Aug)

--

F: --

P: --

U.K. Average Weekly Earnings (3-Month Average, Excluding Bonuses) YoY (Aug)

--

F: --

P: --

U.K. Average Weekly Earnings (3-Month Average, Including Bonuses) YoY (Aug)

--

F: --

P: --

Germany PPI MoM (Sept)

--

F: --

P: --

Germany PPI YoY (Sept)

--

F: --

P: --

Euro Zone Current Account (SA) (Aug)

--

F: --

P: --

Euro Zone Current Account (Not SA) (Aug)

--

F: --

P: --

Germany ZEW Current Conditions Index (Oct)

--

F: --

P: --

Euro Zone ZEW Economic Sentiment Index (Oct)

--

F: --

P: --

Euro Zone ZEW Current Conditions Index (Oct)

--

F: --

P: --

Euro Zone Construction Output YoY (Aug)

--

F: --

P: --

Euro Zone Construction Output MoM (SA) (Aug)

--

F: --

P: --

Germany ZEW Economic Sentiment Index (Oct)

--

F: --

P: --

U.K. 10-Year Note Auction Yield

--

F: --

P: --

U.S. New Housing Starts Annualized MoM (SA) (Sept)

--

F: --

P: --

U.S. Building Permits MoM (SA) (Sept)

--

F: --

P: --

U.S. Annual New Housing Starts (SA) (Sept)

--

F: --

P: --

U.S. Total Building Permits (SA) (Sept)

--

F: --

P: --

U.S. Weekly Redbook Index YoY

--

F: --

P: --

U.S. Pending Home Sales Index (Sept)

--

F: --

P: --

U.S. Pending Home Sales Index YoY (Sept)

--

F: --

P: --

U.S. Pending Home Sales Index MoM (SA) (Sept)

--

F: --

P: --

U.S. API Weekly Gasoline Stocks

--

F: --

P: --

U.S. API Weekly Refined Oil Stocks

--

F: --

P: --

U.S. API Weekly Crude Oil Stocks

--

F: --

P: --

U.S. API Weekly Cushing Crude Oil Stocks

--

F: --

P: --

South Korea PPI MoM (Sept)

--

F: --

P: --

Q&A with Experts
    • All
    • Chatrooms
    • Groups
    • Friends
    5366486 flag
    thank u
    1999kk.king flag
    问题不大 等等就会上涨
    1999kk.king flag
    1999kk.king flag
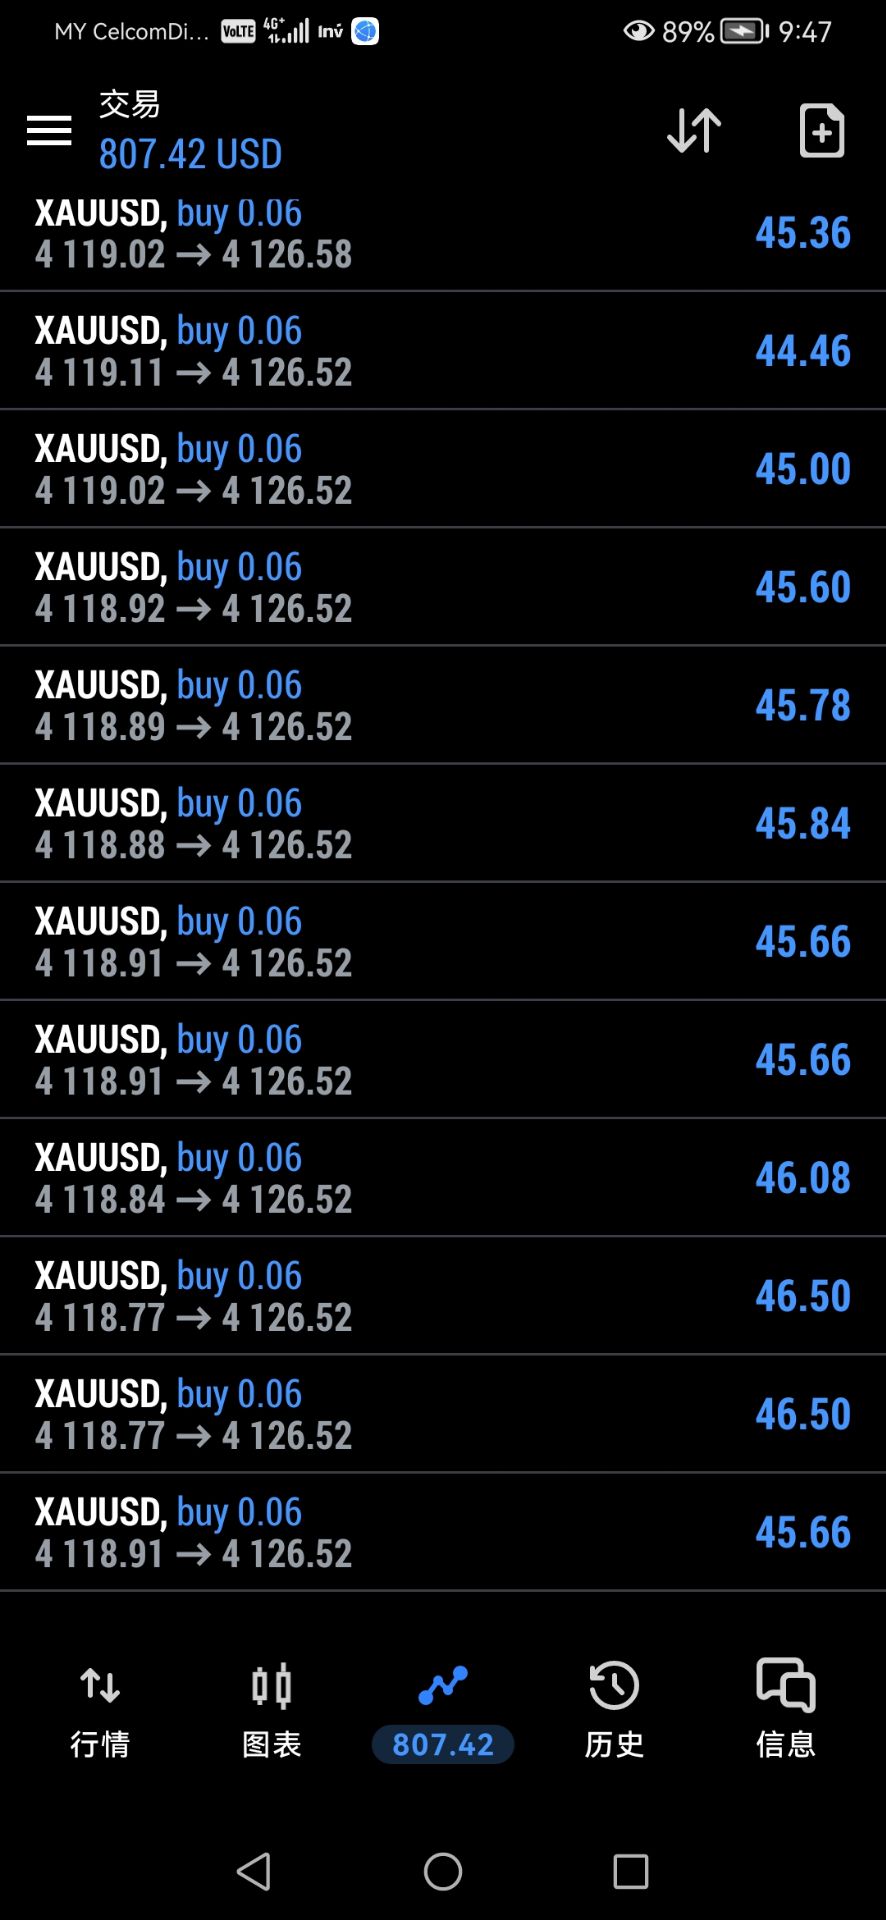
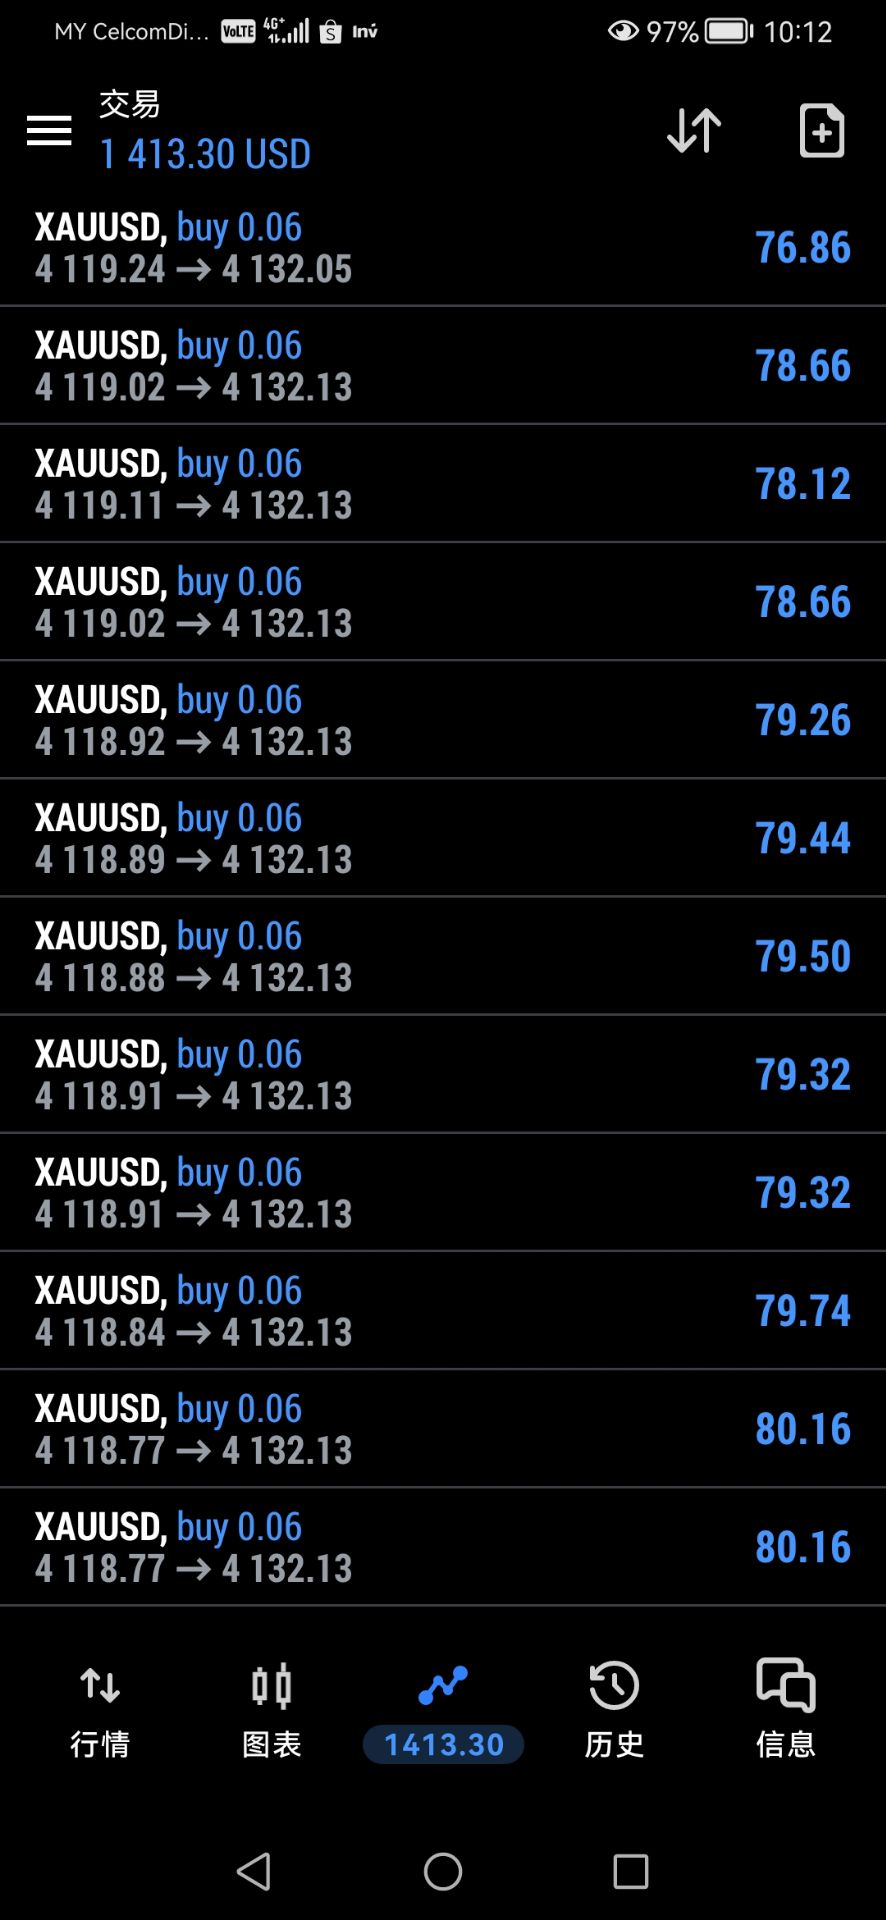
    就看看这个昨天最高点的时候做空已经下来了很快接近我们的目标 所以讲 做多问题不大 现在这个价位问题不大
    1999kk.king flag
    交易风险现在已经赚钱了 4118可以设 保本
    1999kk.king flag
    保本持有
    1999kk.king flag
    风险降为0 现在是0风险
    1999kk.king flag
    1999kk.king flag
    做好保护
    Henry Muri flag
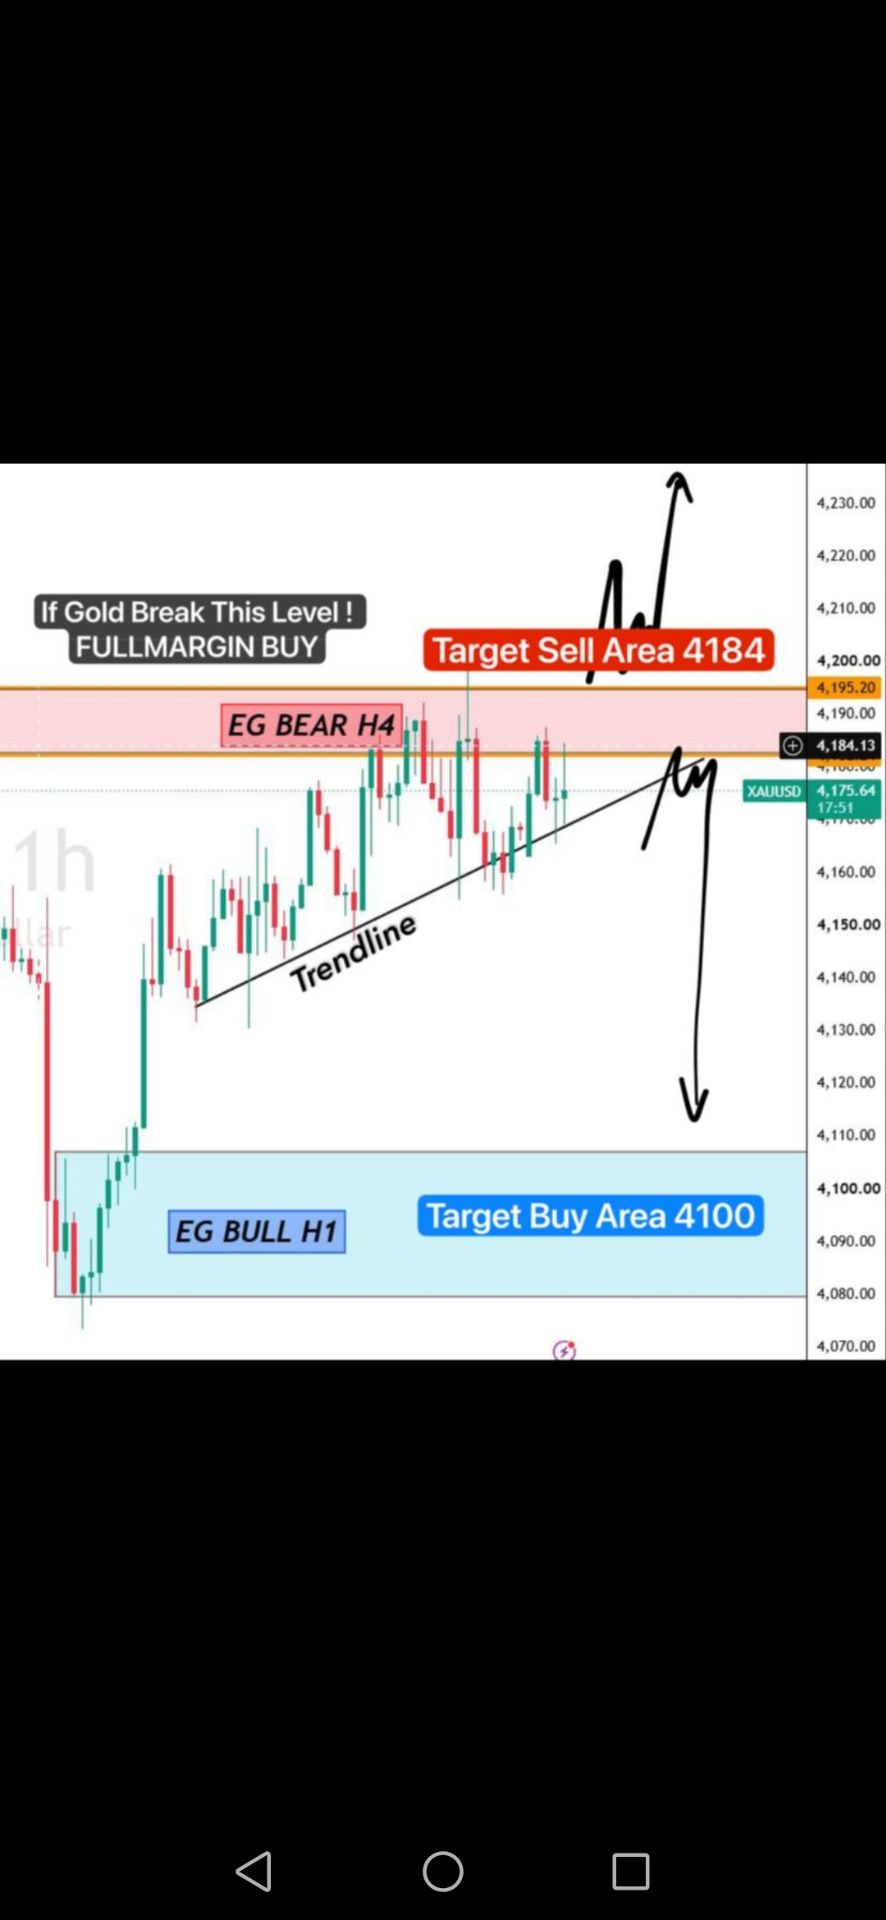
    what of that 15 min demand am seeing on 4105 ?
    Henry Muri flag
    any one with an idea same as mine ??
    Skylark flag
    Henry Muri
    what of that 15 min demand am seeing on 4105 ?
    @Henry Muriit could get to 4100 and if it wants to proceed way down 4073 or 4070 Fridays low is 4073
    Skylark flag
    Skylark flag
    Skylark
    @Henry Murithat's the marked place 4073
    1999kk.king flag
    1999kk.king flag
    Henry Muri flag
    @1999kk.king congratulations mate
    Skylark flag
    1999kk.king
    就看看这个昨天最高点的时候做空已经下来了很快接近我们的目标 所以讲 做多问题不大 现在这个价位问题不大
    @1999kk.kingyou're a scalper I guess, or day trader. do you also hold swing positions
    Skylark flag
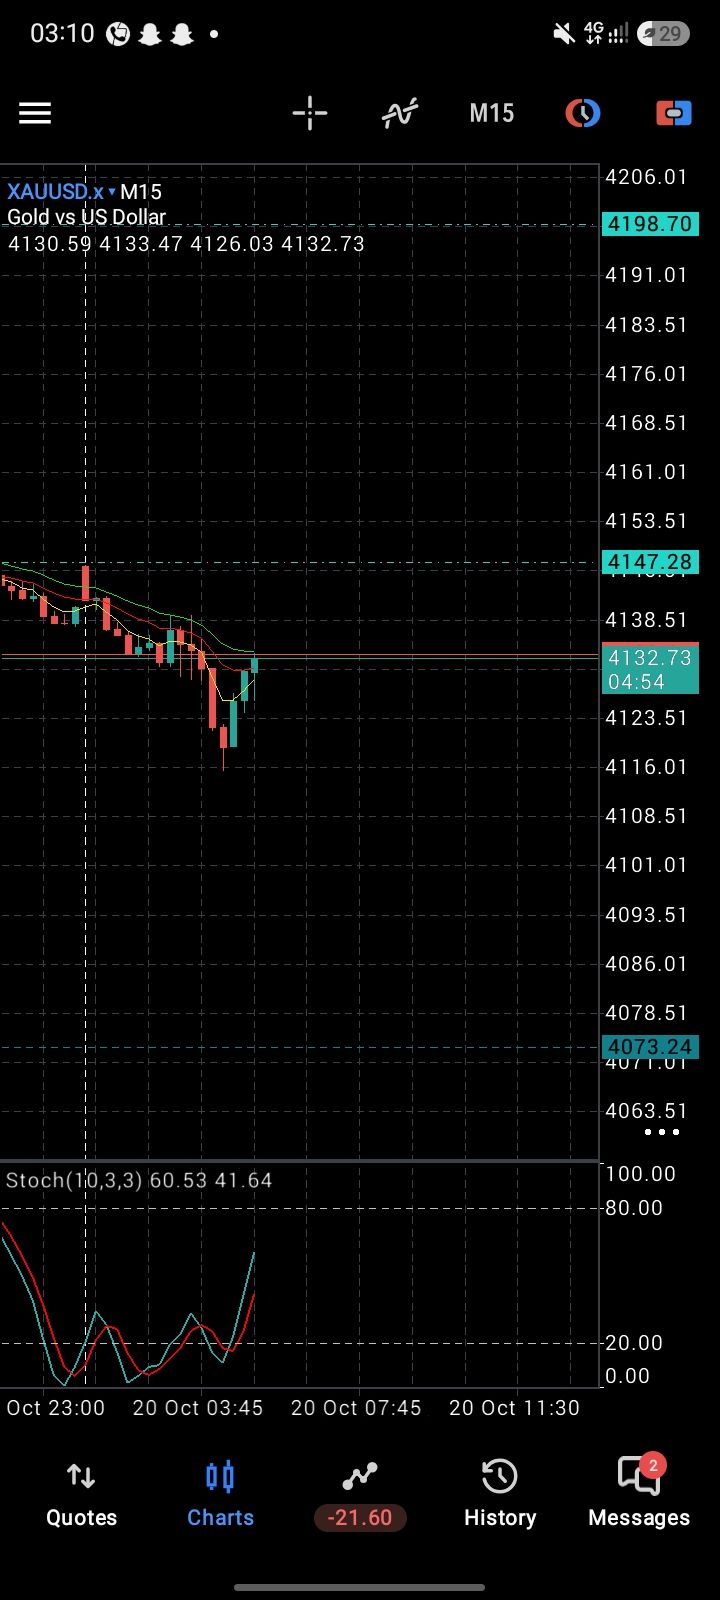
    @1999kk.kingit rose up on the M15 chart looking like a pull back but on the H1 chart there's a Hammer dogi that's indicates a bullish reversal signal
    Skylark flag
    @1999kk.kingit rose up on the M15 chart looking like a pull back but on the H1 chart there's a Hammer dogi that's indicates a bullish reversal signal
    Type here...
    Add Symbol or Code

      No matching data

      All
      Recommend
      Stocks
      Cryptocurrencies
      Central Banks
      Trump Updates
      Featured News
      • All
      • Russia-Ukraine Conflict
      • Middle East Flashpoint
      • All
      • Russia-Ukraine Conflict
      • Middle East Flashpoint
      Search
      Products

      Charts Free Forever

      Chats Q&A with Experts
      Screeners Economic Calendar Data Tools
      Membership Features
      Data Warehouse Market Trends Institutional Data Policy Rates Macro

      Market Trends

      Market Sentiment Order Book Forex Correlations

      Top Indicators

      Charts Free Forever
      Markets

      News

      24/7 Analysis Education

      Latest Views

      Latest Update

      Signals

      Copy Rankings Latest Signals Become a signal provider AI Rating
      Contests
      Brokers

      Overview Brokers Assessment Rankings Regulators News Claims
      Broker listing Forex Brokers Comparison Tool Live Spread Comparison Scam
      Q&A Complaint Scam Alert Videos Tips to Detect Scam
      More

      Business
      Events
      Careers About Us Advertising Help Center

      White Label

      Broker API

      Data API

      Web Plug-ins

      Affiliate Program

      Awards Institution Evaluation IB Seminar Salon Event Exhibition
      Vietnam Thailand Singapore Dubai
      Fans Party Investment Sharing Session
      FastBull Summit BrokersView Expo
      Recent Searches
        Top Searches
          Markets
          Analysis
          User
          24/7
          Economic Calendar
          Education
          Data
          • Names
          • Latest
          • Prev

          View All

          No data

          Scan to Download

          Faster Charts, Chat Faster!

          Download
          English
          • English
          • Español
          • العربية
          • Bahasa Indonesia
          • Bahasa Melayu
          • Tiếng Việt
          • ภาษาไทย
          • Français
          • Italiano
          • Türkçe
          • Русский язык
          • 简中
          • 繁中
          Open Account
          Search
          Products
          Charts Free Forever
          Markets
          News
          Signals

          Copy Rankings Latest Signals Become a signal provider AI Rating
          Contests
          Brokers

          Overview Brokers Assessment Rankings Regulators News Claims
          Broker listing Forex Brokers Comparison Tool Live Spread Comparison Scam
          Q&A Complaint Scam Alert Videos Tips to Detect Scam
          More

          Business
          Events
          Careers About Us Advertising Help Center

          White Label

          Broker API

          Data API

          Web Plug-ins

          Affiliate Program

          Awards Institution Evaluation IB Seminar Salon Event Exhibition
          Vietnam Thailand Singapore Dubai
          Fans Party Investment Sharing Session
          FastBull Summit BrokersView Expo
          AEVO/USDT (Aevo / Tether) -- USD-- --
          View on social charts
          Markets / Crypto / Aevo / Tether

          AEVO/USDT (Aevo / Tether)

          FastBull Crypto
          -- USD-- --
          -- -- Suspended
          View on social charts
          Overview
          Trading Data
          Technicals
          About
          1 Day
          +0.18%
          1 week
          -7.89%
          1 Month
          -10.00%
          6 Months
          -8.90%
          YTD
          -42.19%
          1 Year
          -66.05%
          5 Years
          -99.33%
          All Time
          -98.88%
          Share
          Download image
          Copy image
          Copy Link
          Open in new tab
          --
          Open
          --
          Prev. Close
          --
          High
          --
          Low
          --
          Turnover
          --
          Volume
          --
          Float Mkt Cap
          --
          Circulating Supply
          --
          Max. Market Cap
          --
          Max. Supply
          --
          Circulating Ratio
          --
          ICO Price
          Expand
          Trading Data
          5m
          1H
          1D
          Spot Margin Lending Ratio

          No data

          Futures Open Interest
          All
          • All
          USD
          • USD
          • AEVO

          No data

          Top Trader Long/Short (Positions)
          Binance
          • Binance
          • OKX
          • HTX

          No data

          Liquidation History
          All
          • All
          • No data
          • AEVO

          No data

          Technicals
          15m
          30m
          1H
          4H
          1D
          1W
          1M
          Candlestick Patterns
          PATTERNS TIMEFRAME TIME ACTION
          Technicals

          Oscillators

          Neutral
          Sell Buy
          Strong Sell Strong Buy
          --
          Sell: --
          Neutral: --
          Buy: --

          Summary

          Neutral
          Sell Buy
          Strong Sell Strong Buy
          --
          Sell: --
          Neutral: --
          Buy: --

          Moving Averages

          Neutral
          Sell Buy
          Strong Sell Strong Buy
          --
          Sell: --
          Neutral: --
          Buy: --
          About Aevo
          AEVO Spot
          AEVO Contracts
          Liquidation Data
          AEVO Margin Lending Ratio
          OKX
          • OKX
          1H
          • 5m
          • 1H
          • 1D
          The ratio of cumulative borrowed amount of quote currency (USDT) to base currency (AEVO) in the AEVO/USDT pair as of a specific point in time.

          No data

          AEVO Taker Buy/Sell Volume
          OKX
          • OKX
          1H
          • 5m
          • 1H
          • 1D
          The total volume of buy orders filled by takers (Taker Buy Volume) and the total volume of sell orders filled by takers (Taker Sell Volume) within a period.

          No data

          AEVO Open Interest
          All
          • All
          USD
          • USD
          • AEVO
          1H
          • 1m
          • 5m
          • 15m
          • 1H
          • 4H
          • 12H
          • 1D
          Open interest refers to the total number of outstanding futures or options contracts in the market. It decreases when contracts are closed or expire.

          No data

          AEVO Top Trader Long/Short (Accounts)
          Binance
          • Binance
          • OKX
          • HTX
          1H
          • 5m
          • 1H
          • 4H
          • 12H
          • 1D
          Net long and net short accounts of the top 20% users with the highest margin balance.

          No data

          AEVO Top Trader Long/Short (Positions)
          Binance
          • Binance
          • OKX
          • HTX
          1H
          • 5m
          • 1H
          • 4H
          • 12H
          • 1D
          Net long and net short positions of the top 20% users with the highest margin balance.

          No data

          AEVO Taker Buy/Sell Volume
          The total volume of buy orders filled by takers (Taker Buy Volume) and the total volume of sell orders filled by takers (Taker Sell Volume) within a period.
          Latest
          1H
          • 5m
          • 1H
          • 1D

          No data

          History
          1H
          • 5m
          • 1H
          • 1D

          No data

          AEVO Basis
          --
            --
              --
                1H
                • 1m
                • 5m
                • 1H
                • 1D
                Basis = Futures Price - Spot Index Price; Basis Rate = Basis / Spot Index Price

                No data

                AEVO Real-Time Funding Rate
                Exchange
                  USDⓈ-M Futures
                  • USDⓈ-M Futures
                  • COIN-M Futures
                  The funding rate is a fee set by cryptocurrency exchanges to maintain the balance between the futures prices and the underlying asset prices.
                  EXCHANGE CURRENT 1 DAY 7 DAYS 30 DAYS 1 YEAR
                  AEVO Funding Rate History
                  USDⓈ-M Futures
                  • USDⓈ-M Futures
                  • COIN-M Futures
                  8H
                  • 1m
                  • 5m
                  • 8H
                  The funding rate is typically settled at fixed intervals, such as every 8 hours.

                  No data

                  Liquidation Overview
                  24H
                  • 1H
                  • 4H
                  • 12H
                  • 24H
                  Total liquidation amount in the last 24H
                  --
                  Most Liquidations (Exchange)
                  --
                  --
                  Most Liquidations (Crypto)
                  --
                  --
                  Exchange Liquidations
                  • No data
                  • AEVO
                  24H
                  • 1H
                  • 4H
                  • 12H
                  • 24H
                  EXCHANGE LIQUIDATION LONG SHORT RATIO

                  No data

                  Liquidation History
                  All
                  • No data
                  • All
                  • AEVO
                  1D
                  • 1m
                  • 5m
                  • 15m
                  • 30m
                  • 1H
                  • 4H
                  • 12H
                  • 1D

                  No data

                  Real-Time Liquidations
                  All
                  • All
                  • No data
                  • AEVO
                  All
                  • All
                  • Over $10,000
                  • Over $100,000
                  • Over $1 million
                  EXCHANGE SYMBOL DIRECTION PRICE LIQUIDATION TIME
                  View More
                  Technical Analysis
                  Candlestick Patterns
                  Pivot Points
                  15m
                  30m
                  1H
                  4H
                  1D
                  1W
                  1M

                  Oscillators

                  Neutral
                  Sell Buy
                  Strong Sell Strong Buy
                  --
                  Sell: --
                  Neutral: --
                  Buy: --

                  Summary

                  Neutral
                  Sell Buy
                  Strong Sell Strong Buy
                  --
                  Sell: --
                  Neutral: --
                  Buy: --

                  Moving Averages

                  Neutral
                  Sell Buy
                  Strong Sell Strong Buy
                  --
                  Sell: --
                  Neutral: --
                  Buy: --
                  Oscillators
                  Names Value Action
                  Moving Averages
                  Names Value Action
                  All Timeframes
                  • All Timeframes
                  • 15m
                  • 30m
                  • 1H
                  • 4H
                  • 1D
                  • 1W
                  • 1M
                  All Trends
                  • All Trends
                  • Bullish
                  • Bearish
                  All Patterns
                    PATTERNS NAME TRENDS TIMEFRAME TIME ACTION
                    4H
                    1D
                    1W
                    1M
                    Standard
                    • Standard
                    • Fibonacci
                    • Demark’s
                    • Camarilla
                    • Woodie’s
                    Pivot Points
                    Pivot Points Standard Fibonacci Demark’s Camarilla Woodie’s
                    S3
                    --
                    --
                    --
                    --
                    --
                    S2
                    --
                    --
                    --
                    --
                    --
                    S1
                    --
                    --
                    --
                    --
                    --
                    P
                    --
                    --
                    --
                    --
                    --
                    R1
                    --
                    --
                    --
                    --
                    --
                    R2
                    --
                    --
                    --
                    --
                    --
                    R3
                    --
                    --
                    --
                    --
                    --

                    Aevo

                    Create Alert

                    FastBull

                    Send alert only once
                    Send alert once a day
                    Rise above
                    Drop below
                    Rise by %
                    Drop by %
                    Create
                    FastBull
                    Copyright © 2026 FastBull Ltd

                    728 RM B 7/F GEE LOK IND BLDG NO 34 HUNG TO RD KWUN TONG KLN HONG KONG

                    TelegramInstagramTwitterfacebooklinkedin
                    App Store Google Play Android Windows
                    Products
                    Charts

                    Chats

                    Q&A with Experts
                    Screeners
                    Economic Calendar
                    Data
                    Tools
                    Membership
                    Features
                    Function
                    Markets
                    Copy Trading
                    Latest Signals
                    Contests
                    24/7
                    Analysis
                    Education
                    Company
                    Careers
                    About Us
                    Contact Us
                    Advertising
                    Download FastBull
                    Help Center
                    Feedback
                    User Agreement
                    Privacy Policy
                    Personal Information Protection Statement
                    Business

                    White Label

                    Broker API

                    Data API

                    Web Plug-ins

                    Poster Maker

                    Affiliate Program

                    Risk Disclosure

                    The risk of loss in trading financial instruments such as stocks, FX, commodities, futures, bonds, ETFs and crypto can be substantial. You may sustain a total loss of the funds that you deposit with your broker. Therefore, you should carefully consider whether such trading is suitable for you in light of your circumstances and financial resources.

                    No decision to invest should be made without thoroughly conducting due diligence by yourself or consulting with your financial advisors. Our web content might not suit you since we don't know your financial conditions and investment needs. Our financial information might have latency or contain inaccuracy, so you should be fully responsible for any of your trading and investment decisions. The company will not be responsible for your capital loss.

                    Without getting permission from the website, you are not allowed to copy the website's graphics, texts, or trademarks. Intellectual property rights in the content or data incorporated into this website belong to its providers and exchange merchants.

                    Not Logged In

                    Log in to access more features

                    Connect Broker
                    Become a signal provider
                    Help Center
                    Customer Service
                    Dark Mode
                    Price Up/Down Colors

                    Log In

                    Sign Up

                    Position
                    Layout
                    Fullscreen
                    Default to Chart
                    The chart page opens by default when you visit fastbull.com