• Trade
  • Markets
  • Copy
  • Contests
  • 24/7
  • Calendar
  • Q&A
  • Chats
Screeners
SYMBOL
LAST
BID
ASK
HIGH
LOW
NET CHG.
%CHG.
SPREAD
SOURCE
SPX
S&P 500 Index
7743.40
7743.40
7743.40
7752.08
7693.07
+39.27
+ 0.51%
--
--
DJI
Dow Jones Industrial Average
51828.61
51828.61
51828.61
51874.95
51339.25
+478.63
+ 0.93%
--
--
IXIC
NASDAQ Composite Index
27068.71
27068.71
27068.71
27122.76
26876.27
+129.34
+ 0.48%
--
--
USDX
US Dollar Index
100.820
100.820
100.900
100.890
100.770
+0.080
+ 0.08%
--
--
EURUSD
Euro / US Dollar
1.13805
1.13805
1.13814
1.13908
1.13733
-0.00086
-0.08%
--
--
GBPUSD
Pound Sterling / US Dollar
1.32409
1.32409
1.32422
1.32469
1.32202
-0.00010
-0.01%
--
--
XAUUSD
Gold / US Dollar
4174.95
4174.95
4175.38
4276.07
4168.38
-109.90
-2.56%
--
--
WTI
Light Sweet Crude Oil
92.380
92.380
92.410
93.265
91.379
+1.061
+ 1.16%
--
--

Community Accounts

Signal Accounts
--
Profit Accounts
--
Loss Accounts
--
View More

Become a signal provider

Sell trading signals to earn additional income

View More

Guide to Copy Trading

Get started with ease and confidence

View More

Signal Accounts for Members

All Signal Accounts

Best Return
  • Best Return
  • Best P/L
  • Best MDD
Past 1W
  • Past 1W
  • Past 1M
  • Past 1Y

All Contests

  • All
  • Recommend
  • Stocks
  • Cryptocurrencies
  • Central Banks
  • Trump Updates
  • Featured News
Top News Only
Share

Indonesian Central Bank Governor: Foreign Exchange Intervention In The Spot Market Accounts For 30% Of The Total

Share

The Governor Of The Central Bank Of Indonesia Said: "We Have Reduced Our Foreign Exchange Intervention In The Spot Market And Focused On The Non-deliverable Forward (NDF) Market."

Share

Market News: Qatar Has Extended Its Force Majeure Declaration Against Pakistan's Liquefied Natural Gas Until November

Share

US Soybean Meal Futures Fell 2.00% On The Day, Currently Trading At $363.50 Per Short Ton

Share

British Defense Secretary: To Me, It Would Be Very Unwise To Speculate On The Motives Of Those Arrested

Share

According To Interfax News Agency, An Oil Refinery In Russia's Krasnodar Region Was Attacked

Share

British Defence Secretary: (Regarding The Fairford Military Base Incident) We Are Aware Of The Existence Of State-sponsored Actors Who Could Pose A Threat To The UK, Which Is Why We Remain Vigilant

Share

The Saudi Foreign Minister Is Set To Meet With Rubio On Monday

Share

Indian Oil Corporation Purchased Iraqi Crude Oil For October Loading At A Discount Of Approximately $28 Per Barrel To The Dubai Benchmark

Share

EU High Representative For Foreign Affairs And Security Policy Karas: We Have Seen In Intelligence Reports That Russia Is Planning More Sabotage Activities

Share

Rising Oil Prices Weighed On India's Stock Market, Pushing It To A Nearly Six-month Low

Share

EU High Representative For Foreign Affairs And Security Policy Karas: The EU's Aspides Naval Mission Requires More Naval Assets To Be Operational, A Need Greater Than Ever Before

Share

EU High Representative For Foreign Affairs And Security Policy Karas: We Have Significant Gaps In Our Defense Capabilities And Should Focus On How To Fill Those Gaps

Share

Jefferies: Inflation And Budget Deficits May Keep Long-End Bonds Under Pressure

Share

Sweden's Net Imports In August Were 171.8 Billion Swedish Kronor, Net Exports Were 159.9 Billion Swedish Kronor, And The Trade Deficit Was 11.9 Billion Swedish Kronor

Share

Local Authorities: Three Civilian Infrastructure Sites Caught Fire Following A Drone Strike In Russia’s Krasnodar Region

Share

U.S.-Iran Negotiations Have Stalled, While U.S. Treasury Yields Have Risen

Share

Both WTI And Brent Crude Oil Prices Rose By More Than 2.00% Intraday. WTI Crude Oil Is Currently Trading At $93.18 Per Barrel, And Brent Crude Oil Is Currently Trading At $993.8 Per Barrel

Share

US Soybeans Fell 1.00% On The Day, Currently Trading At 1305.75 Cents Per Bushel

Share

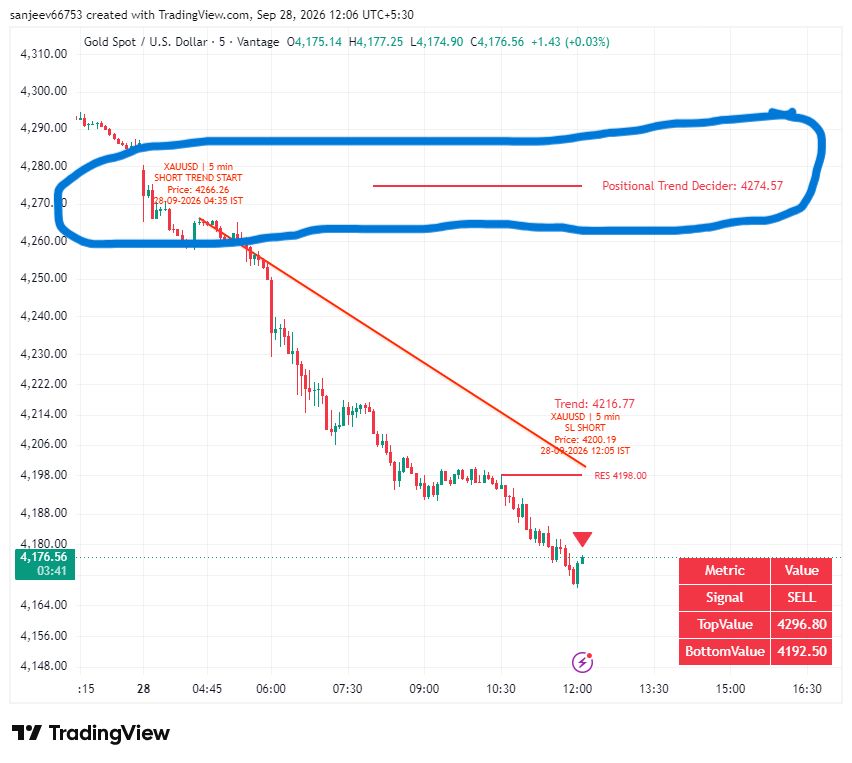
Spot Gold Fell More Than $100 During The Day, Currently Trading At $4,185.12 Per Ounce, A Drop Of 2.33%

TIME
ACT
FCST
PREV
IMPACT
FOMC Member Hammack Speaks
U.S. Annual Total New Home Sales (Aug)

A:--

F: --

P: --
USDX
  • USDX
  • XAUUSD
  • XAGUSD
  • WTI
U.S. New Home Sales Annualized MoM (Aug)

A:--

F: --

P: --
USDX
  • USDX
  • XAUUSD
  • XAGUSD
  • WTI
Philadelphia Fed President Henry Paulson delivers a speech
U.S. EIA Weekly Natural Gas Stocks Change

A:--

F: --

P: --

WTI
  • WTI
  • XAUUSD
  • XAGUSD
  • USDX
U.S. Kansas Fed Manufacturing Production Index (Sept)

A:--

F: --

P: --

USDX
  • USDX
  • XAUUSD
  • XAGUSD
  • WTI
U.S. Kansas Fed Manufacturing Composite Index (Sept)

A:--

F: --

P: --

USDX
  • USDX
  • XAUUSD
  • XAGUSD
  • WTI
Mexico Policy Interest Rate

A:--

F: --

P: --

XAUUSD
  • XAUUSD
  • XAGUSD
  • WTI
  • USDX
U.S. Weekly Treasuries Held by Foreign Central Banks

A:--

F: --

P: --

USDX
  • USDX
  • XAUUSD
  • XAGUSD
  • WTI
U.K. GfK Consumer Confidence Index (Sept)

A:--

F: --

P: --

GBPUSD
  • GBPUSD
  • XAUUSD
  • XAGUSD
  • WTI
Germany GfK Consumer Confidence Index (SA) (Oct)

A:--

F: --

P: --
EURUSD
  • EURUSD
  • XAUUSD
  • XAGUSD
  • WTI
  • USDX
Euro Zone 3-Month M3 Money Supply YoY (Aug)

A:--

F: --

P: --

EURUSD
  • EURUSD
  • XAUUSD
  • XAGUSD
  • WTI
  • USDX
Euro Zone M3 Money Supply YoY (Aug)

A:--

F: --

P: --

EURUSD
  • EURUSD
  • XAUUSD
  • XAGUSD
  • WTI
  • USDX
Euro Zone Private Sector Credit YoY (Aug)

A:--

F: --

P: --

EURUSD
  • EURUSD
  • XAUUSD
  • XAGUSD
  • WTI
  • USDX
New York Federal Reserve President Williams delivered a speech.
India Deposit Gowth YoY

A:--

F: --

P: --

XAUUSD
  • XAUUSD
  • XAGUSD
  • WTI
  • USDX
Mexico Unemployment Rate (Not SA) (Aug)

A:--

F: --

P: --

XAUUSD
  • XAUUSD
  • XAGUSD
  • WTI
  • USDX
U.S. Durable Goods Orders MoM (Aug)

A:--

F: --

P: --
USDX
  • USDX
  • XAUUSD
  • XAGUSD
  • WTI
U.S. Durable Goods Orders MoM (Excl.Transport) (Aug)

A:--

F: --

P: --
USDX
  • USDX
  • XAUUSD
  • XAGUSD
  • WTI
U.S. Non-Defense Capital Durable Goods Orders MoM (Excl. Aircraft) (Aug)

A:--

F: --

P: --
USDX
  • USDX
  • XAUUSD
  • XAGUSD
  • WTI
U.S. Durable Goods Orders MoM (Excl. Defense) (SA) (Aug)

A:--

F: --

P: --
USDX
  • USDX
  • XAUUSD
  • XAGUSD
  • WTI
U.S. UMich Current Economic Conditions Index Final (Sept)

A:--

F: --

P: --

USDX
  • USDX
  • XAUUSD
  • XAGUSD
  • WTI
U.S. UMich Consumer Expectations Index Final (Sept)

A:--

F: --

P: --

USDX
  • USDX
  • XAUUSD
  • XAGUSD
  • WTI
U.S. UMich Consumer Sentiment Index Final (Sept)

A:--

F: --

P: --

USDX
  • USDX
  • XAUUSD
  • XAGUSD
  • WTI
U.S. UMich 1-Year-Ahead Inflation Expectations Final (Sept)

A:--

F: --

P: --

USDX
  • USDX
  • XAUUSD
  • XAGUSD
  • WTI
Canada Federal Government Budget Balance (Jul)

A:--

F: --

P: --

USDCAD
  • USDCAD
  • XAUUSD
  • XAGUSD
  • WTI
  • USDX
U.S. Weekly Total Oil Rig Count

A:--

F: --

P: --

WTI
  • WTI
  • XAUUSD
  • XAGUSD
  • USDX
U.S. Weekly Total Rig Count

A:--

F: --

P: --

WTI
  • WTI
  • XAUUSD
  • XAGUSD
  • USDX
FOMC Member Hammack Speaks
China, Mainland Industrial Profit YoY (YTD) (Aug)

A:--

F: --

P: --

XAUUSD
  • XAUUSD
  • XAGUSD
  • WTI
  • USDX
India Manufacturing Output MoM (Aug)

--

F: --

P: --

India Industrial Production Index YoY (Aug)

--

F: --

P: --

Brazil Current Account (Aug)

--

F: --

P: --

Mexico Trade Balance (Aug)

--

F: --

P: --

Canada National Economic Confidence Index

--

F: --

P: --

U.S. Dallas Fed General Business Activity Index (Sept)

--

F: --

P: --

U.S. Dallas Fed New Orders Index (Sept)

--

F: --

P: --

U.K. BRC Shop Price Index YoY (Sept)

--

F: --

P: --

Australia Overnight (Borrowing) Key Rate

--

F: --

P: --

RBA Rate Statement
RBA Press Conference
Turkey Economic Sentiment Indicator (Sept)

--

F: --

P: --

U.K. M4 Money Supply YoY (Aug)

--

F: --

P: --

U.K. Mortgage Lending (Aug)

--

F: --

P: --

U.K. M4 Money Supply MoM (Aug)

--

F: --

P: --

U.K. Mortgage Approvals (Aug)

--

F: --

P: --

Euro Zone Consumer Confidence Index Final (Sept)

--

F: --

P: --

Euro Zone Services Sentiment Index (Sept)

--

F: --

P: --

Euro Zone Economic Sentiment Indicator (Sept)

--

F: --

P: --

Euro Zone Industrial Climate Index (Sept)

--

F: --

P: --

Italy PPI YoY (Aug)

--

F: --

P: --

Euro Zone Consumer Inflation Expectations (Sept)

--

F: --

P: --

Euro Zone Selling Price Expectations (Sept)

--

F: --

P: --

France Unemployment Class-A (Aug)

--

F: --

P: --

Brazil Unemployment Rate (Aug)

--

F: --

P: --

Canada GDP YoY (Jul)

--

F: --

P: --

Canada GDP MoM (SA) (Jul)

--

F: --

P: --

U.S. Weekly Redbook Index YoY

--

F: --

P: --

U.S. FHFA House Price Index YoY (Jul)

--

F: --

P: --

U.S. FHFA House Price Index (Jul)

--

F: --

P: --

U.S. S&P/CS 20-City Home Price Index YoY (Not SA) (Jul)

--

F: --

P: --

Q&A with Experts
    • All
    • Chatrooms
    • Groups
    • Friends
    fulltimetrader flag
    多
    EuroTrader flag
    fulltimetrader
    黄金
    @fulltimetraderGold, what happened to good mate, rae you currently on the gold sell that's happening right now?
    Size flag
    🎖️SlyBmFx✨
    @Sizelol FVG that shows after choch or bos, works best.
    Yeah mate, I get you. So you prefer the FVG that forms after the CHOCH or BOS rather than just any imbalance..
    sanjeev flag
    EuroTrader flag
    🎖️SlyBmFx✨
    @EuroTraderalways the King 👑 of the market, never doubt and FVG you spot in HTF like 30m to 4hr
    @🎖️SlyBmFx✨yeah exactly, i don't waste my time trying to look for one on the lower timeframe
    Size flag
    🎖️SlyBmFx✨
    @Sizelol FVG that shows after choch or bos, works best.
    Do you enter on the first retrace into that FVG or wait for another confirmation?
    fulltimetrader flag
    我觉得今天做多挺危险,但是等不了4150了
    fulltimetrader flag
    进了
    EuroTrader flag
    🎖️SlyBmFx✨
    @EuroTraderalways the King 👑 of the market, never doubt and FVG you spot in HTF like 30m to 4hr
    @🎖️SlyBmFx✨All I do comes from the higher but the 4H is the strongest for me while playing an intra day
    fulltimetrader flag
    如果4150破位,我又要考虑空单了
    fulltimetrader flag
    今天单边行情的可能性比较高
    EuroTrader flag
    fulltimetrader
    我觉得今天做多挺危险,但是等不了4150了
    @fulltimetraderwell we will know that for sure when the London opens, we will know the direction markets wants to go
    SlowBear ⛅ flag
    ofortitude
    黄金
    @ofortitude nice one, and what is the target like? 4120 is on the table
    SlowBear ⛅ flag
    ofortitude
    我觉得今天做多挺危险,但是等不了4150了
    @ofortitude lol, 😂 it’s very risky, infact good below 4200 is a risky level to anticipates a short term buy unless you wish to ULTRASCALP
    SlowBear ⛅ flag
    sanjeev
    @sanjeev I see and I will call 4275 a potential long term MSS (reversal point)
    fulltimetrader flag
    4150跌破,继续做空
    SlowBear ⛅ flag
    ofortitude
    如果4150破位,我又要考虑空单了
    @ofortitude you should cos you won’t be the only one, gold stays within the range we are holding more shorts
    🎖️SlyBmFx✨ flag
    EuroTrader
    @🎖️SlyBmFx✨yeah exactly, i don't waste my time trying to look for one on the lower timeframe
    @EuroTraderexample pls
    fulltimetrader flag
    先开多单,看能不能撑住
    fulltimetrader flag
    今天做多比较冒险
    Type here...
    Add Symbol or Code

      No matching data

      All
      Recommend
      Stocks
      Cryptocurrencies
      Central Banks
      Trump Updates
      Featured News
      • All
      • Russia-Ukraine Conflict
      • Middle East Flashpoint
      • All
      • Russia-Ukraine Conflict
      • Middle East Flashpoint
      Search
      Products

      Charts Free Forever

      Chats Q&A with Experts
      Screeners Economic Calendar Data Tools
      Membership Features
      Data Warehouse Market Trends Institutional Data Policy Rates Macro

      Market Trends

      Market Sentiment Order Book Forex Correlations

      Top Indicators

      Charts Free Forever
      Markets

      News

      24/7 Analysis Education

      Latest Views

      Latest Update

      Signals

      Copy Rankings Latest Signals Become a signal provider AI Rating
      Contests
      Brokers

      Overview Brokers Assessment Rankings Regulators News Claims
      Broker listing Forex Brokers Comparison Tool Live Spread Comparison Scam
      Q&A Complaint Scam Alert Videos Tips to Detect Scam
      More

      Business
      Events
      Careers About Us Advertising Help Center

      White Label

      Broker API

      Data API

      Web Plug-ins

      Affiliate Program

      Awards Institution Evaluation IB Seminar Salon Event Exhibition
      Vietnam Thailand Singapore Dubai
      Fans Party Investment Sharing Session
      FastBull Summit BrokersView Expo
      Recent Searches
        Top Searches
          Markets
          Analysis
          User
          24/7
          Economic Calendar
          Education
          Data
          • Names
          • Latest
          • Prev

          View All

          No data

          Scan to Download

          Faster Charts, Chat Faster!

          Download
          English
          • English
          • Español
          • العربية
          • Bahasa Indonesia
          • Bahasa Melayu
          • Tiếng Việt
          • ภาษาไทย
          • Français
          • Italiano
          • Türkçe
          • Русский язык
          • 简中
          • 繁中
          Open Account
          Search
          Products
          Charts Free Forever
          Markets
          News
          Signals

          Copy Rankings Latest Signals Become a signal provider AI Rating
          Contests
          Brokers

          Overview Brokers Assessment Rankings Regulators News Claims
          Broker listing Forex Brokers Comparison Tool Live Spread Comparison Scam
          Q&A Complaint Scam Alert Videos Tips to Detect Scam
          More

          Business
          Events
          Careers About Us Advertising Help Center

          White Label

          Broker API

          Data API

          Web Plug-ins

          Affiliate Program

          Awards Institution Evaluation IB Seminar Salon Event Exhibition
          Vietnam Thailand Singapore Dubai
          Fans Party Investment Sharing Session
          FastBull Summit BrokersView Expo

          Stock Split or Real Loss? Reconcile Adjusted Prices, Cost Basis and Options

          zhan chen
          Summary:

          A plunge from 90 to 32 can be a gain after a three-for-one split. Reconcile share units, portfolio value, chart data, fractional shares and adjusted option deliverables before judging the move.

          A share price falls from 90 to 32. An unadjusted comparison reports a 64% collapse. Yet an investor who received three shares for every old share has gained about 6.67%. Before explaining the gap with a market narrative, check whether the two prices measure the same thing. A split changes the unit of ownership; it does not, by itself, create or destroy the business’s value.

          Three records need to agree: shares and acquisition cost in the account, historical prices and volume on the chart, and the units specified in orders or derivative contracts. A mismatch in just one can distort a return, valuation or stop level. The examples below are hypothetical and initially exclude dividends, financing, taxes, fees and other simultaneous corporate actions.

          Stock Split or Real Loss? Reconcile Adjusted Prices, Cost Basis and Options_1

          More shares are not a larger ownership stake

          A company with one million shares at 90 has an equity market value of 90 million. A three-for-one split creates three million shares and a mechanical reference price of 30. Aggregate value is unchanged. An investor’s 100 shares become 300, still 0.01% of the company. The reference price is a value-preserving calculation, not a promised opening trade.

          Keep the earnings denominator consistent, too. Suppose profit for the same comparison period remains three million: earnings per share move from 3 to 1, while price moves from 90 to 30. Both price/earnings ratios are 30. Dividing the new price by the old, unadjusted EPS fabricates a cheap-looking multiple of 10. Actual financial statements also require attention to weighted-average shares and comparative-period adjustments; this static example is not a full reporting calculation.

          A pure split asks existing shareholders for no additional subscription money. A rights issue and its subscription entitlement is a different event. Whether cash enters the business and whether every holder changes proportionately matter more than the headline increase in shares.

          Reconcile the whole position, not just the new price

          An investor owns 100 shares bought at 72, for aggregate acquisition cost of 7,200. At 90, the position is worth 9,000 and has an unrealized gain of 1,800. The split changes per-share cost to 24; it does not reduce aggregate cost to 2,400.

          MeasureBeforeMechanical adjustmentAt market price 32
          Shares100300300
          Price per share903032
          Total cost7,2007,2007,200
          Market value9,0009,0009,600
          Unrealized gain1,8001,8002,400

          The split-spanning price return is 32/(90/3)−1, or about 6.67%. The original position has gained another 600. The apparent −64.44% from 32/90−1 compares different units. Nor is the full 2,400 unrealized gain a one-day profit: 1,800 already existed.

          Account displays can update asynchronously. A new quote may arrive before additional shares appear, or quantities may change before per-share cost does. Check processing times and shares receivable before treating the display as a real loss. Conversely, do not dismiss every discrepancy as a harmless delay. Once processing is complete, unresolved quantities, cash or tax lots require reconciliation.

          Adjust price, volume and valuation on compatible bases

          Pre-split open, high, low and close of 88, 92, 87 and 90 become approximately 29.33, 30.67, 29 and 30 in current-share units. Adjusting only the close leaves candle ranges and volatility measures inconsistent. Moving averages, stop distances and backtests that cross the event need a coherent split factor across their inputs. The artificial gap in an unadjusted history was not an executable crash.

          Volume needs a definition as well. Historical turnover of 600,000 old shares is equivalent to 1.8 million new shares. With outstanding shares changing from one million to three million, turnover remains 60%. This restatement does not mean an extra 1.2 million shares actually traded on the effective date. If the data vendor adjusts price but not share volume, a post-split “tripling of activity” may be a unit artefact. Compare traded value and turnover ratios using matching intervals and share-count definitions.

          Split-adjusted prices are not automatically a dividend-reinvested total-return series. Do not divide a cost record that has already been adjusted a second time. Even a smaller currency spread proves little: 0.03 against 90 and 0.01 against 30 are both about 3.33 basis points. To test a liquidity claim, compare executable spreads, depth and impact for the same notional order, rather than celebrating a cheaper-looking share.

          A reverse split does not repair an economic loss

          In a one-for-20 reverse split, 1,000 shares at 0.80 become 50 shares with a reference price of 16. Both positions are worth 800. If the new shares subsequently trade at 12.80, the position is worth 640: a genuine 20% loss. The large numerical jump from 0.80 to 16 is not wealth creation. Raising the quotation may address a minimum-price issue, but does not itself repair operating cash flow, debt or financing needs.

          Fractional entitlements need their own line. In a separate one-for-ten example, 137 old shares become 13.7 new shares economically. If the specific terms cash out 0.7 share at an assumed 25, the holder receives 13 whole shares plus 17.50. At 25, their combined value is 342.50. Actual cash-in-lieu pricing, expenses, tax treatment and timing depend on the event. A receivable is not immediately spendable cash, and neither permanent fractional ownership nor rounding up can be assumed.

          Old orders and adjusted options require more than a price edit

          A standing limit, stop or alert may be adjusted, cancelled or handled differently under venue rules, order type and broker procedures. Even US order-adjustment provisions have a defined scope; they are not a worldwide promise that every order will be resized correctly. Before submitting a replacement, check the original’s live status, quantity and trigger. Otherwise both orders could remain active. A chart alert is not an exchange order.

          An option is a claim on a specified deliverable, not simply a comparison between two displayed prices. Suppose a one-for-five reverse split takes the stock mechanically from 6 to 30. An old call shows a strike of 10 and a quotation multiplier of 100, giving aggregate exercise payment of 1,000. If the clearing adjustment specifies delivery of 20 new shares with the multiplier unchanged, that stock is worth only 600. The call is not suddenly in the money because 30 exceeds 10; the new stock would need to reach 50 for deliverable value to equal the exercise payment.

          That is an illustration of a possible adjustment, not a universal contract rule. Read the actual notice for symbol, contract count, share and cash deliverables, aggregate exercise amount and effective date. Standard and adjusted contracts with the same displayed strike may coexist. Their quotes are not interchangeable, and a nominal stock holding may not cover the precise delivery obligation.

          An event-day audit that separates units from repricing

          1. Confirm the old-to-new ratio, effective date and first adjusted trading date in issuer and exchange notices. Do not assume the record date is the price-switch date everywhere.
          2. Preserve original share quantities, aggregate cost by lot, unsettled trades and unrealized profit; calculate the expected new units separately.
          3. Reconcile whole shares, fractions, cash-in-lieu and processing times. Explain securities plus receivables, with fees on a separate line.
          4. Align all chart price fields, volume and valuation inputs before measuring the actual return. Avoid double adjustment.
          5. Review live orders, stops, alerts, margin treatment and option deliverables individually; a new symbol is not proof of completed processing.
          6. Compare executable prices with the mechanical reference only after the records agree. Separate concurrent dividends, financing, restructurings and new information from the split factor.

          The useful question is not whether splits are inherently bullish or bearish. It is whether the units reconcile, whether the account-value difference can be explained, and how much the market repriced the company after the mechanical adjustment. Only then does the gap become a meaningful trading observation.

          Risk Warnings and Disclaimers
          You understand and acknowledge that there is a high degree of risk involved in trading. Following any strategies or investment methods may lead to potential losses. The content on the site is provided by our contributors and analysts for information purposes only. You are solely responsible for determining whether any trading assets, securities, strategy, or any other product is suitable for investing based on your own investment objectives and financial situation.
          Add to Favorites
          Share
          FastBull
          Copyright © 2026 FastBull Ltd

          728 RM B 7/F GEE LOK IND BLDG NO 34 HUNG TO RD KWUN TONG KLN HONG KONG

          TelegramInstagramTwitterfacebooklinkedin
          App Store Google Play Android Windows
          Products
          Charts

          Chats

          Q&A with Experts
          Screeners
          Economic Calendar
          Data
          Tools
          Membership
          Features
          Function
          Markets
          Copy Trading
          Latest Signals
          Contests
          24/7
          Analysis
          Education
          Company
          Careers
          About Us
          Contact Us
          Advertising
          Download FastBull
          Help Center
          Feedback
          User Agreement
          Privacy Policy
          Personal Information Protection Statement
          Business

          White Label

          Broker API

          Data API

          Web Plug-ins

          Poster Maker

          Affiliate Program

          Risk Disclosure

          The risk of loss in trading financial instruments such as stocks, FX, commodities, futures, bonds, ETFs and crypto can be substantial. You may sustain a total loss of the funds that you deposit with your broker. Therefore, you should carefully consider whether such trading is suitable for you in light of your circumstances and financial resources.

          No decision to invest should be made without thoroughly conducting due diligence by yourself or consulting with your financial advisors. Our web content might not suit you since we don't know your financial conditions and investment needs. Our financial information might have latency or contain inaccuracy, so you should be fully responsible for any of your trading and investment decisions. The company will not be responsible for your capital loss.

          Without getting permission from the website, you are not allowed to copy the website's graphics, texts, or trademarks. Intellectual property rights in the content or data incorporated into this website belong to its providers and exchange merchants.

          Not Logged In

          Log in to access more features

          Connect Broker
          Become a signal provider
          Help Center
          Customer Service
          Dark Mode
          Price Up/Down Colors

          Log In

          Sign Up

          Position
          Layout
          Fullscreen
          Default to Chart
          The chart page opens by default when you visit fastbull.com