• Trade
  • Markets
  • Copy
  • Contests
  • 24/7
  • Calendar
  • Q&A
  • Chats
Screeners
SYMBOL
LAST
BID
ASK
HIGH
LOW
NET CHG.
%CHG.
SPREAD
SOURCE
SPX
S&P 500 Index
7551.80
7551.80
7551.80
7626.78
7507.78
-33.93
-0.45%
--
--
DJI
Dow Jones Industrial Average
51461.89
51461.89
51461.89
52173.71
51186.68
-631.22
-1.21%
--
--
IXIC
NASDAQ Composite Index
25978.41
25978.41
25978.41
26225.09
25802.96
-3.15
-0.01%
--
--
USDX
US Dollar Index
99.950
99.950
100.030
100.070
99.810
-0.040
-0.04%
--
--
EURUSD
Euro / US Dollar
1.14703
1.14703
1.14710
1.14832
1.14544
+0.00081
+ 0.07%
--
--
GBPUSD
Pound Sterling / US Dollar
1.33664
1.33664
1.33674
1.34059
1.33492
-0.00122
-0.09%
--
--
XAUUSD
Gold / US Dollar
4341.61
4341.61
4342.04
4343.53
4257.39
+77.36
+ 1.81%
--
--
WTI
Light Sweet Crude Oil
95.688
95.688
95.718
97.703
95.605
-1.792
-1.84%
--
--

Community Accounts

Signal Accounts
--
Profit Accounts
--
Loss Accounts
--
View More

Become a signal provider

Sell trading signals to earn additional income

View More

Guide to Copy Trading

Get started with ease and confidence

View More

Signal Accounts for Members

All Signal Accounts

Best Return
  • Best Return
  • Best P/L
  • Best MDD
Past 1W
  • Past 1W
  • Past 1M
  • Past 1Y

All Contests

  • All
  • Recommend
  • Stocks
  • Cryptocurrencies
  • Central Banks
  • Trump Updates
  • Featured News
Top News Only
Share

Director Zheng Shanjie Meets With Luhut, Chairman Of Indonesia's National Economic Council

Share

Russian Defense Ministry: Russian Forces Have Struck A Large Military Data Center In Ukraine

Share

Institution: No Surprises In This Month's Interest Rate Decision; The Next Window For A Bank Of England Rate Hike May Be In November

Share

Institution: Market Pricing For A Bank Of England Rate Hike Could Trigger Counter‑trend Volatility In The Gilt Market

Share

ECB Governing Council Member Rehn: It Is Perfectly Reasonable To Use Common EU Assets To Fund Defense Investment

Share

The Central Bank Of Ukraine May Lower Its GDP Growth Forecast For Ukraine In 2026 To 1.1%-1.2%, Down From The Previous Forecast Of 1.8%

Share

Schroders: No Urgent Need For Bank Of England Rate Hikes, But UK Fiscal Budget Is Key

Share

Sources Indicate That Investment Firm Apollo Is Exploring Options For Dealing With Floating Liquefied Natural Gas (LNG) Infrastructure Operator Energos, Including A Full Or Partial Sale. Potential Buyers Include Abu Dhabi-based XRG, Which May Acquire Up To 50% Of Energos's Stake

Share

According To Sources Cited By Swedish Public Broadcaster PPP, Swedish Prime Minister Ulf Christosson Will Soon Announce His Resignation

Share

ECB Governing Council Member Rehn: It Could Be Said That We Were In A Good Position In Terms Of Inflation, Given The Latest Shocks, But The Signals Are Not The Same Now

Share

Market News: The Argentine Government Has Submitted A Bill To Crack Down On Companies Operating In The Falkland Islands

Share

Bank Of England Announces Cancellation Of Long-term Government Bond Sales Plan

Share

Liang Nan Meets With Assistant Director General Of UAE General Civil Aviation Authority

Share

ECB Governing Council Member Rehn: We Can Reduce Red Tape In The European Banking And Financial Sector, But A Strong Capital Buffer Remains Crucial

Share

Donghai Securities: Uncertainty Remains As To Whether The Federal Reserve Will Initiate A Prolonged, Sequential Rate-Hike Cycle

Share

Bank Of England Holds Rates Steady As Expected, Warns It Will Raise Rates If War With Iran Persists

Share

The Yield On 30-year UK Government Bonds Fell 5.9 Basis Points On The Day, Currently Trading At 5.8003%

Share

Brent Crude Oil Fell More Than 2.00% On The Day, Currently Trading At $100.07 Per Barrel. WTI Crude Oil Fell 1.69% On The Day, Currently Trading At $95.85 Per Barrel

Share

UBS: Rising Fiscal Deficits, Increased Debt Burdens, A Weakening Dollar, And Market Expectations That The Federal Reserve Will Resume Its Accommodative Policy Next Year Should Support Gold, Although Short-term Volatility Is Possible

Share

Central Bank Of Turkey: Global Inflation Faces Upside Risks Due To Commodity Price Volatility

TIME
ACT
FCST
PREV
IMPACT
U.S. Export Price Index YoY (Aug)

A:--

F: --

P: --

USDX
  • USDX
  • XAUUSD
  • XAGUSD
  • WTI
U.S. Import Price Index YoY (Aug)

A:--

F: --

P: --
USDX
  • USDX
  • XAUUSD
  • XAGUSD
  • WTI
U.S. Core Retail Sales MoM (Aug)

A:--

F: --

P: --
USDX
  • USDX
  • XAUUSD
  • XAGUSD
  • WTI
U.S. Retail Sales (Aug)

A:--

F: --

P: --

USDX
  • USDX
  • XAUUSD
  • XAGUSD
  • WTI
U.S. Core Retail Sales (Aug)

A:--

F: --

P: --

USDX
  • USDX
  • XAUUSD
  • XAGUSD
  • WTI
U.S. Commercial Inventory MoM (Jul)

A:--

F: --

P: --
USDX
  • USDX
  • XAUUSD
  • XAGUSD
  • WTI
U.S. NAHB Housing Market Index (Sept)

A:--

F: --

P: --

USDX
  • USDX
  • XAUUSD
  • XAGUSD
  • WTI
U.S. EIA Weekly Crude Oil Imports Changes

A:--

F: --

P: --

WTI
  • WTI
  • XAUUSD
  • XAGUSD
  • USDX
U.S. EIA Weekly Heating Oil Stock Changes

A:--

F: --

P: --

WTI
  • WTI
  • XAUUSD
  • XAGUSD
  • USDX
U.S. EIA Weekly Crude Stocks Change

A:--

F: --

P: --

WTI
  • WTI
  • XAUUSD
  • XAGUSD
  • USDX
U.S. EIA Weekly Crude Demand Projected by Production

A:--

F: --

P: --

WTI
  • WTI
  • XAUUSD
  • XAGUSD
  • USDX
U.S. EIA Weekly Cushing, Oklahoma Crude Oil Stocks Change

A:--

F: --

P: --

WTI
  • WTI
  • XAUUSD
  • XAGUSD
  • USDX
U.S. EIA Weekly Gasoline Stocks Change

A:--

F: --

P: --

WTI
  • WTI
  • XAUUSD
  • XAGUSD
  • USDX
Russia PPI MoM (Aug)

A:--

F: --

P: --

WTI
  • WTI
  • XAUUSD
  • XAGUSD
  • USDX
Russia PPI YoY (Aug)

A:--

F: --

P: --

WTI
  • WTI
  • XAUUSD
  • XAGUSD
  • USDX
U.S. Target Federal Funds Rate Lower Limit (Overnight Reverse Repo Rate)

A:--

F: --

P: --

XAUUSD
  • XAUUSD
  • XAGUSD
  • WTI
  • USDX
U.S. Target Federal Funds Rate Upper Limit (Excess Reserves Ratio)

A:--

F: --

P: --

XAUUSD
  • XAUUSD
  • XAGUSD
  • WTI
  • USDX
FOMC Statement
FOMC Press Conference
Brazil Selic Interest Rate

A:--

F: --

P: --

XAUUSD
  • XAUUSD
  • XAGUSD
  • WTI
  • USDX
Euro Zone HICP Final YoY (Aug)

A:--

F: --

P: --

EURUSD
  • EURUSD
  • XAUUSD
  • XAGUSD
  • WTI
  • USDX
Euro Zone HICP Final MoM (Aug)

A:--

F: --

P: --

EURUSD
  • EURUSD
  • XAUUSD
  • XAGUSD
  • WTI
  • USDX
Euro Zone Core CPI Final MoM (Aug)

A:--

F: --

P: --

EURUSD
  • EURUSD
  • XAUUSD
  • XAGUSD
  • WTI
  • USDX
Euro Zone Core CPI Final YoY (Aug)

A:--

F: --

P: --

EURUSD
  • EURUSD
  • XAUUSD
  • XAGUSD
  • WTI
  • USDX
Euro Zone CPI YoY (Excl. Tobacco) (Aug)

A:--

F: --

P: --

EURUSD
  • EURUSD
  • XAUUSD
  • XAGUSD
  • WTI
  • USDX
U.K. BOE MPC Vote Cut

A:--

F: --

P: --

GBPUSD
  • GBPUSD
  • XAUUSD
  • XAGUSD
  • WTI
  • USDX
U.K. Benchmark Interest Rate

A:--

F: --

P: --

GBPUSD
  • GBPUSD
  • XAUUSD
  • XAGUSD
  • WTI
  • USDX
U.K. BOE MPC Vote Unchanged

A:--

F: --

P: --

GBPUSD
  • GBPUSD
  • XAUUSD
  • XAGUSD
  • WTI
  • USDX
U.K. BOE MPC Vote Hike

A:--

F: --

P: --

GBPUSD
  • GBPUSD
  • XAUUSD
  • XAGUSD
  • WTI
  • USDX
MPC Rate Statement
ECB Chief Economist Lane Speaks
U.S. Weekly Initial Jobless Claims (SA)

--

F: --

P: --

Canada Industrial Product Price Index MoM (Aug)

--

F: --

P: --

U.S. Initial Jobless Claims 4-Week Avg. (SA)

--

F: --

P: --

U.S. Annual New Housing Starts (SA) (Aug)

--

F: --

P: --

U.S. Total Building Permits (SA) (Aug)

--

F: --

P: --

U.S. Weekly Continued Jobless Claims (SA)

--

F: --

P: --

U.S. New Housing Starts Annualized MoM (SA) (Aug)

--

F: --

P: --

Canada Industrial Product Price Index YoY (Aug)

--

F: --

P: --

U.S. Philadelphia Fed Manufacturing Employment Index (Sept)

--

F: --

P: --

U.S. Building Permits MoM (SA) (Aug)

--

F: --

P: --

U.S. Philadelphia Fed Business Activity Index (SA) (Sept)

--

F: --

P: --

U.S. Pending Home Sales Index YoY (Aug)

--

F: --

P: --

U.S. Pending Home Sales Index MoM (SA) (Aug)

--

F: --

P: --

U.S. Pending Home Sales Index (Aug)

--

F: --

P: --

U.S. EIA Weekly Natural Gas Stocks Change

--

F: --

P: --

U.S. 10-Year TIPS Auction Avg. Yield

--

F: --

P: --

Argentina Unemployment Rate (Q2)

--

F: --

P: --

Argentina GDP YoY (Constant Prices) (Q2)

--

F: --

P: --

U.S. Weekly Treasuries Held by Foreign Central Banks

--

F: --

P: --

South Korea PPI MoM (Aug)

--

F: --

P: --

U.K. GfK Consumer Confidence Index (Sept)

--

F: --

P: --

Japan National CPI MoM (Aug)

--

F: --

P: --

Japan National Core CPI YoY (Aug)

--

F: --

P: --

Japan National CPI YoY (Aug)

--

F: --

P: --

Japan CPI MoM

--

F: --

P: --

Japan National CPI MoM (Not SA) (Aug)

--

F: --

P: --

RBA Gov Bullock Speaks
Japan Benchmark Interest Rate

--

F: --

P: --

BOJ Monetary Policy Statement
Germany PPI MoM (Aug)

--

F: --

P: --

Q&A with Experts
    • All
    • Chatrooms
    • Groups
    • Friends
    EuroTrader flag
    SHIZEN
    @EuroTraderThats true, so what's the overall logic that governs this market?
    @SHIZENwell there's no one best way to put this but i can tell you that everything moves from buyers to sellers or from sellers to buyers
    EuroTrader flag
    SHIZEN
    @EuroTraderThats true, so what's the overall logic that governs this market?
    @SHIZENSo at the end of the day, all we do center on demand and supply
    RPGFX flag
    SHIZEN
    @RPGFXyes that's true and but it kind of works in crypto
    @SHIZENFor me, those patterns are only useful as entry criterias when there's a strong direction already
    RPGFX flag
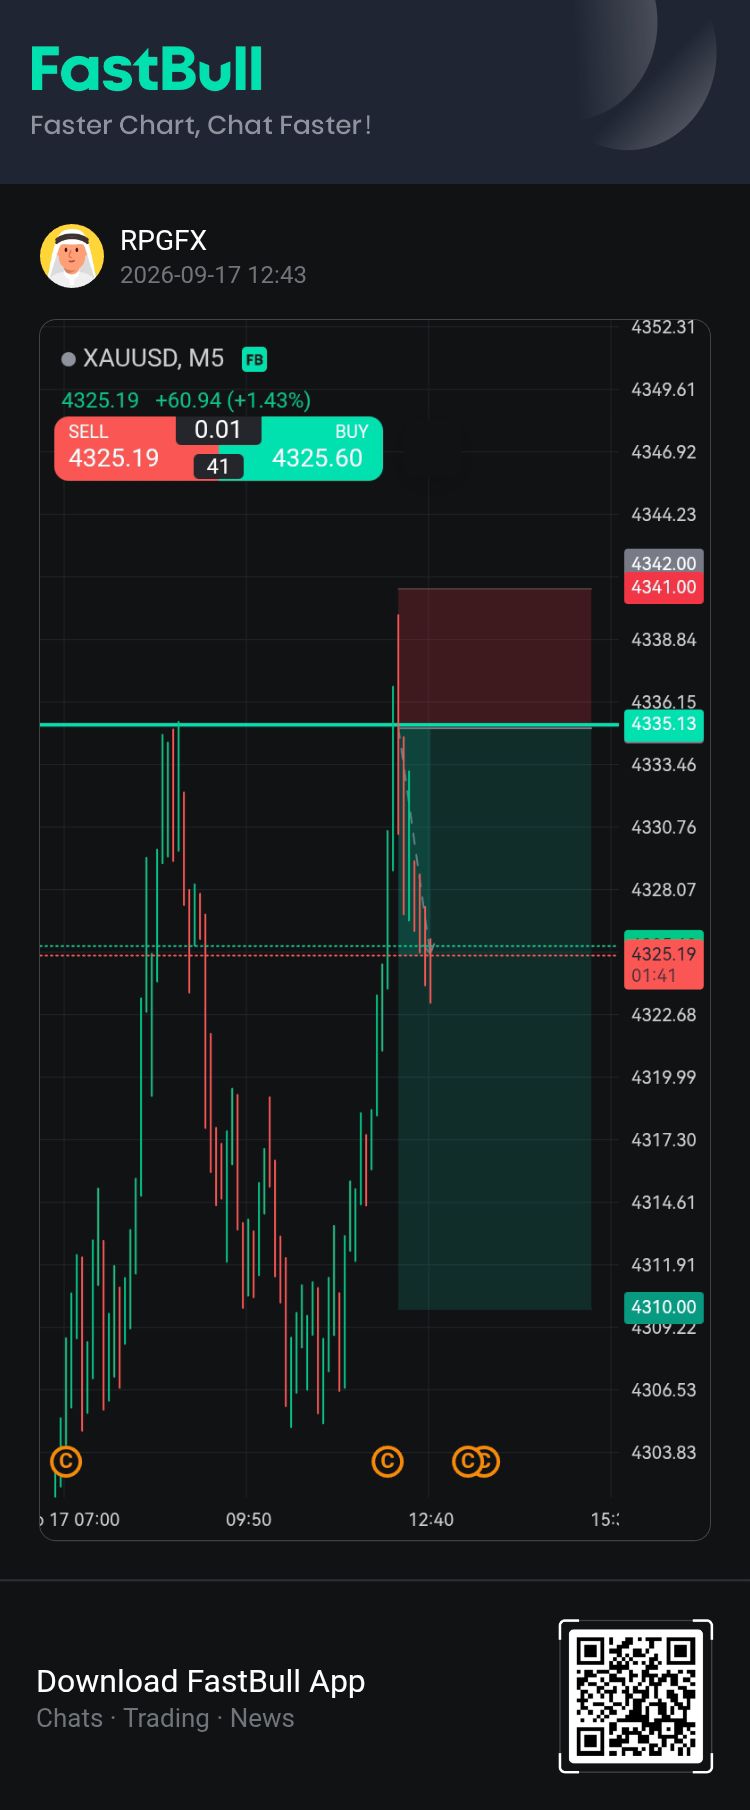
    Meanwhile, gold is currently performing nicely
    RPGFX flag
    EuroTrader flag
    Matthew
    @EuroTraderi wish to be able to see these things
    @Matthewyou have what i told you earlier, you can use coin glass to get this rolling
    SHIZEN flag
    EuroTrader
    @SHIZENwell there's no one best way to put this but i can tell you that everything moves from buyers to sellers or from sellers to buyers
    @EuroTraderokay that's true but to know it on the chart is the problem
    SHIZEN flag
    EuroTrader
    @SHIZENSo at the end of the day, all we do center on demand and supply
    @EuroTraderive heard this too from another trader that it's all demand and supply
    SHIZEN flag
    RPGFX
    @SHIZEN It works partially here too, but it has never been efficient when used alone
    @RPGFXokay so what are you using now sir?
    SlowBear ⛅ flag
    5567310
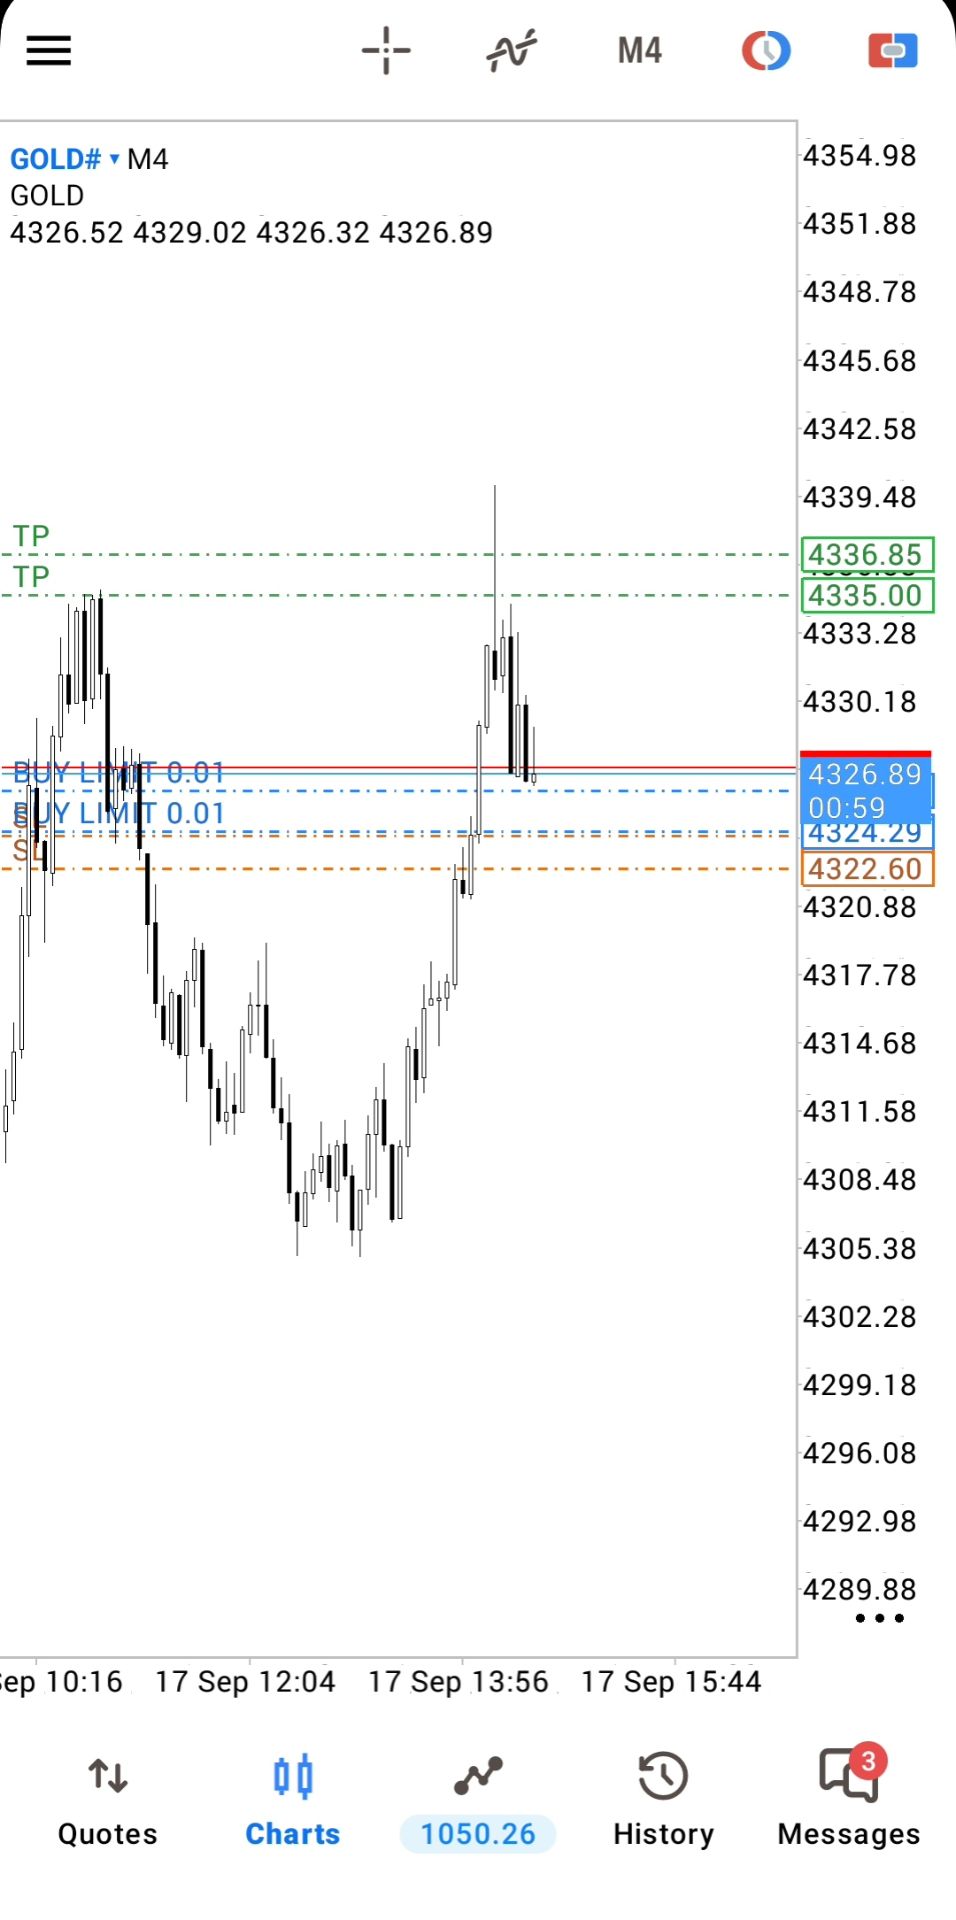
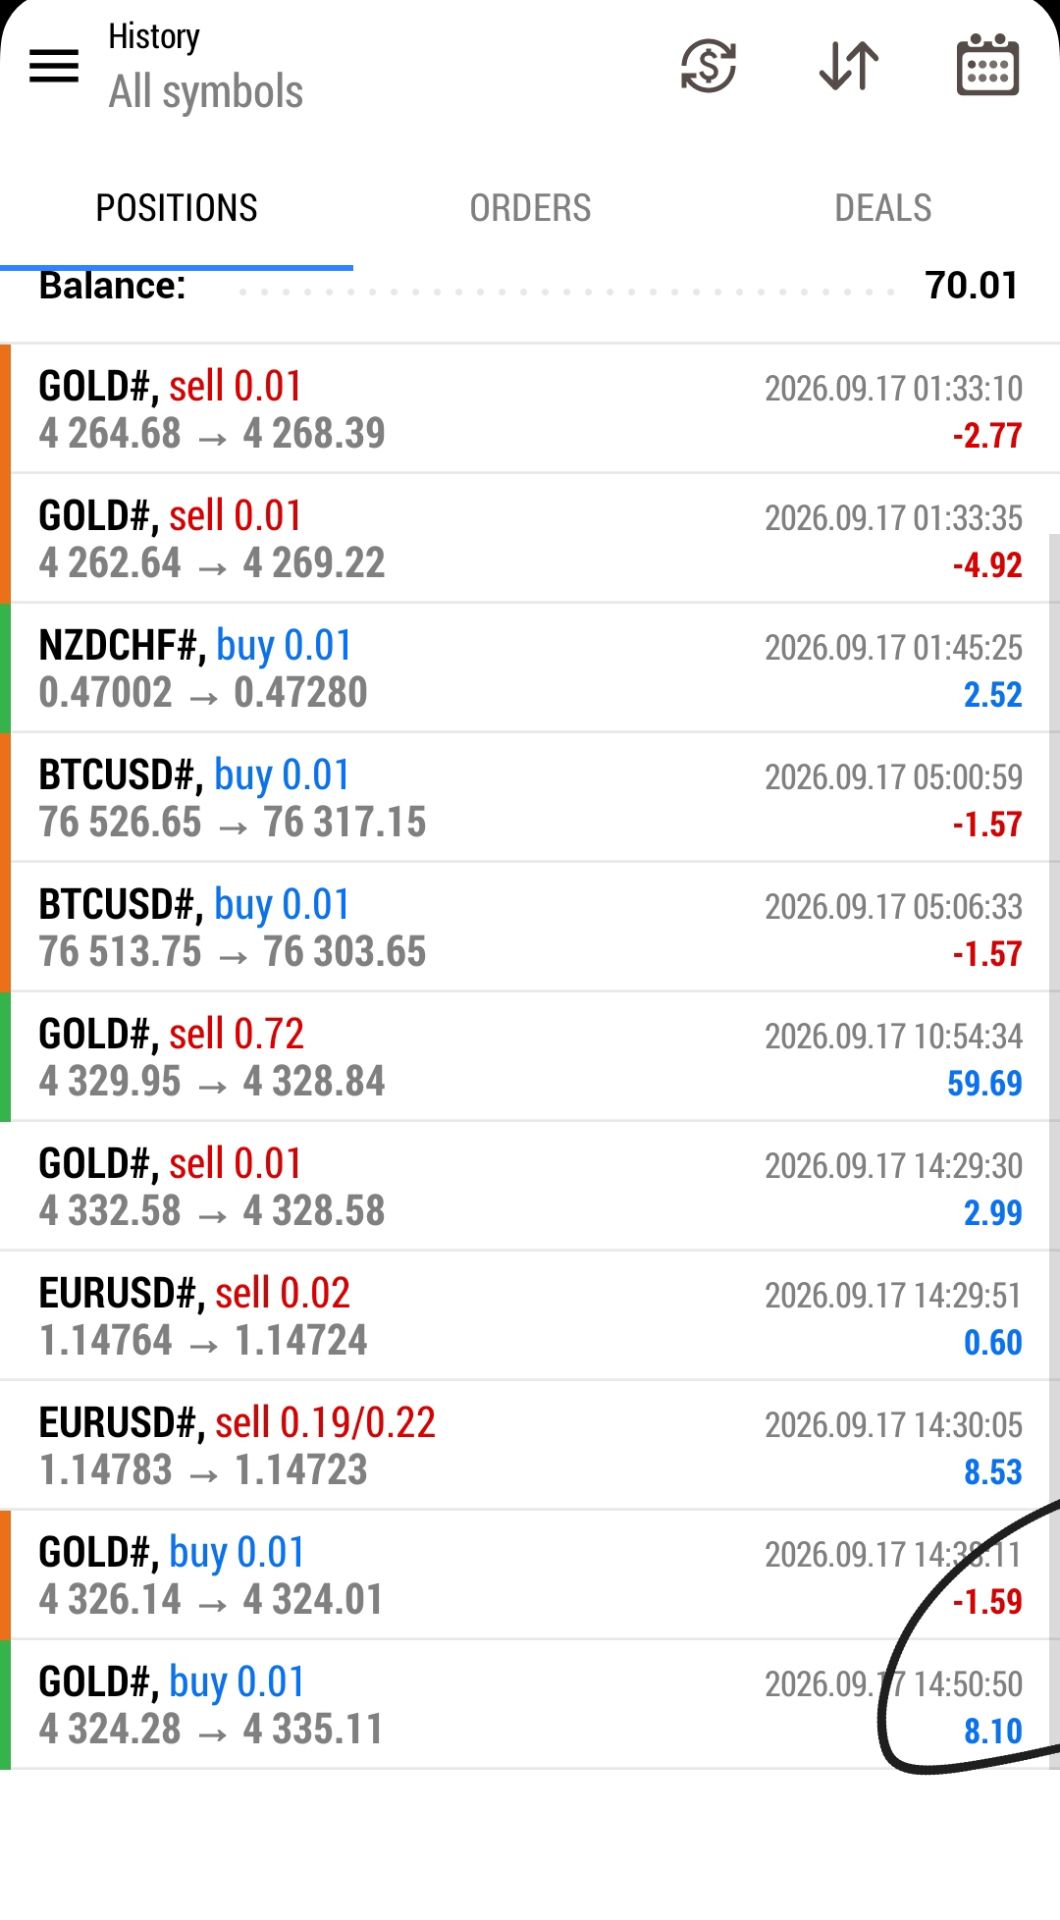
    @SlowBear ⛅Hit TP-1. and still floating + NZDCHF
    @5567310 That is mighty good, wait wht are you now a visitor?
    SlowBear ⛅ flag
    5567310
    @SlowBear ⛅Hit TP-1. and still floating + NZDCHF
    @5567310I wil wait for you to sharw your chart on NZDCHF
    EuroTrader flag
    Matthew
    @EuroTraderso what is the name of the platform you are talking about
    @Matthewwhen you take a look at coin glass to get this liquidity clusters since you dont have access to bookmap too
    Nawhdir flag
    SlowBear ⛅
    @5567310 That is mighty good, wait wht are you now a visitor?
    @SlowBear ⛅fastbull error
    EuroTrader flag
    SHIZEN
    @EuroTraderokay that's true but to know it on the chart is the problem
    @SHIZENWell it's not much a problem if you study it friend
    EuroTrader flag
    SHIZEN
    @EuroTraderive heard this too from another trader that it's all demand and supply
    @SHIZENyeah but one thing that makes it confusing atimes is the liquidity part and human emotions
    Matthew flag
    EuroTrader
    @Matthewwhen you take a look at coin glass to get this liquidity clusters since you dont have access to bookmap too
    @EuroTraderokay thanks
    Matthew flag
    EuroTrader
    @Matthewwhen you take a look at coin glass to get this liquidity clusters since you dont have access to bookmap too
    @EuroTradercan you share the link i checked and dont know where to find it
    Nawhdir flag
    Nawhdir flag
    Nawhdir flag
    01:39
    Type here...
    Add Symbol or Code

      No matching data

      All
      Recommend
      Stocks
      Cryptocurrencies
      Central Banks
      Trump Updates
      Featured News
      • All
      • Russia-Ukraine Conflict
      • Middle East Flashpoint
      • All
      • Russia-Ukraine Conflict
      • Middle East Flashpoint
      Search
      Products

      Charts Free Forever

      Chats Q&A with Experts
      Screeners Economic Calendar Data Tools
      Membership Features
      Data Warehouse Market Trends Institutional Data Policy Rates Macro

      Market Trends

      Market Sentiment Order Book Forex Correlations

      Top Indicators

      Charts Free Forever
      Markets

      News

      24/7 Analysis Education

      Latest Views

      Latest Update

      Signals

      Copy Rankings Latest Signals Become a signal provider AI Rating
      Contests
      Brokers

      Overview Brokers Assessment Rankings Regulators News Claims
      Broker listing Forex Brokers Comparison Tool Live Spread Comparison Scam
      Q&A Complaint Scam Alert Videos Tips to Detect Scam
      More

      Business
      Events
      Careers About Us Advertising Help Center

      White Label

      Broker API

      Data API

      Web Plug-ins

      Affiliate Program

      Awards Institution Evaluation IB Seminar Salon Event Exhibition
      Vietnam Thailand Singapore Dubai
      Fans Party Investment Sharing Session
      FastBull Summit BrokersView Expo
      Recent Searches
        Top Searches
          Markets
          Analysis
          User
          24/7
          Economic Calendar
          Education
          Data
          • Names
          • Latest
          • Prev

          View All

          No data

          Scan to Download

          Faster Charts, Chat Faster!

          Download
          English
          • English
          • Español
          • العربية
          • Bahasa Indonesia
          • Bahasa Melayu
          • Tiếng Việt
          • ภาษาไทย
          • Français
          • Italiano
          • Türkçe
          • Русский язык
          • 简中
          • 繁中
          Open Account
          Search
          Products
          Charts Free Forever
          Markets
          News
          Signals

          Copy Rankings Latest Signals Become a signal provider AI Rating
          Contests
          Brokers

          Overview Brokers Assessment Rankings Regulators News Claims
          Broker listing Forex Brokers Comparison Tool Live Spread Comparison Scam
          Q&A Complaint Scam Alert Videos Tips to Detect Scam
          More

          Business
          Events
          Careers About Us Advertising Help Center

          White Label

          Broker API

          Data API

          Web Plug-ins

          Affiliate Program

          Awards Institution Evaluation IB Seminar Salon Event Exhibition
          Vietnam Thailand Singapore Dubai
          Fans Party Investment Sharing Session
          FastBull Summit BrokersView Expo

          Why a High Risk-Reward Ratio Can Still Lose Money: Win Rate, Expectancy and Position Sizing

          zhan chen
          Summary:

          A high risk-reward ratio does not guarantee profitability. This guide shows how win rate, average win and loss, trading costs and position sizing combine to determine expectancy, with a worked example, break-even thresholds and a practical pre-trade checklist.

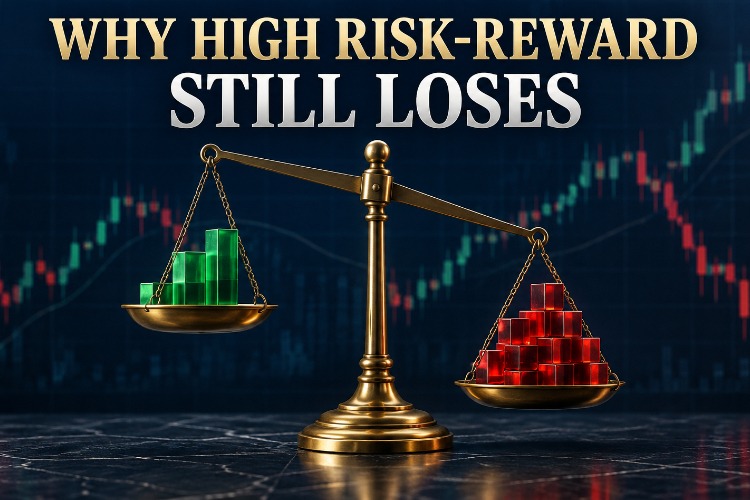
          Key takeaway: The risk-reward ratio is merely the proportion of a single winning trade to a single losing trade; it cannot answer whether a method will be profitable in isolation. What truly determines long-term results is the trade expectancy: the combined effect of win rate, average profit, average loss, transaction costs, and execution bias. Even if the planned target is twice the stop-loss, if the actual win rate is below the break-even point, or winning trades are frequently exited prematurely, the account will still experience continuous drawdowns.
          Why a High Risk-Reward Ratio Can Still Lose Money: Win Rate, Expectancy and Position Sizing_1

          First, separate the three easily confused numbers.

          The "planned risk-reward ratio" comes from the stop-loss and target set before entering the market. For example, being willing to take $1 of risk to target $2 of profit is denoted as 2R. The "actual risk-reward ratio" is the average profit divided by the average loss in the sample. The "expected value of the trade" measures how much R each trade can bring on average in the long run. The three are not equal. Gaps, slippage, staggered profit-taking, trailing stops, and manual intervention can all turn the planned 2R into 1.3R or even lower in the sample.

          If p represents the win rate, W represents the average profit, and L represents the average loss, then:

          Trade expectancy E = p × W − (1 − p) × L − average transaction cost

          Standardizing the average loss as 1R and the average profit as bR, without considering costs, the break-even winning rate is:

          Break-even win rate = 1 ÷ (1 + b)

          Therefore, a win rate of at least 50% is required when the actual risk-reward ratio is 1:1; 1.5:1 corresponds to 40%; 2:1 corresponds to approximately 33.3%; and 3:1 corresponds to 25%. This is only the mathematical break-even point, not the safety line that the strategy should achieve, because costs and execution errors will continue to push the threshold higher.

          A complete calculation example: Why does the 2R objective ultimately only yield an expected value of 0.18R?

          Assuming an account balance of $100,000, the maximum risk per trade is 0.75%, or $750. A stock is planned to be bought at $100, with a stop-loss order placed at $97.50. After adjusting for transaction fees and estimated slippage to $0.10 per share, the true risk per share is $2.60. The acceptable amount should not be calculated as 750 ÷ 2.50, but rather based on the true risk.

          Position size = 750 ÷ 2.60 = 288 shares (rounded down)

          If the target price is $105, and taking into account the same cost of $0.10, the net profit per share is about $4.90. The actual risk-reward ratio is 4.90 ÷ 2.60 ≈ 1.88R, instead of the 2R seen on the chart.

          After reviewing a sufficient number of trades with consistent patterns, it was found that 38% of the trades reached the target, 52% triggered stop-loss orders, and another 10% exited near the cost price but with an average loss of 0.15R. Therefore:

          E = 0.38×1.88 − 0.52×1 − 0.10×0.15 ≈ 0.18R

          This method still has a positive expected value, but its advantage is far less than the intuitive feeling of the "2R target". If the actual win rate drops from 38% to 32%, with other conditions remaining unchanged, the expected value will shrink to about 0.07R; a little more slippage or two failures to stop loss as planned could turn it into a negative value.

          Five reasons why your account is still losing money even though the risk-reward ratio looks high.

          1. Mistaking the target price for the average realized win

          A target is a design input; realized trade outcomes are statistical evidence. Trend strategies may occasionally achieve a 4R (4% return), but many profitable trades only achieve a 0.5R; showing only the best trade will overestimate the long-term advantage.

          2. Underestimating losses beyond the planned stop

          Overnight gaps, insufficient liquidity, slippage of stop-loss orders, and widening spreads can all cause average losses to exceed 1R. This type of deviation is particularly prevalent in forex, gold, and index futures before and after major data releases.

          3. Win rate is not a constant.

          The same set of entry rules can have completely different hit rates during trending, consolidation, and expansion phases of volatility. Applying the win rate of a bull market sample directly to a sideways market is equivalent to hiding environmental changes within the average.

          4. Profits and losses do not occur independently or evenly.

          Even positive expected value strategies can experience consecutive losses. If each trade carries 5% account risk, six consecutive losses will reduce capital by approximately 26.5%; a return of about 36% is needed to recover. Overly large positions can prevent the realization of correct statistical advantages.

          5. The sample is affected by selection bias.

          Only analyzing charts that are "understandable," deleting trades exited prematurely, or using data known only after the fact in backtesting can create falsely high risk-reward ratios. A valid sample must include all signals that conform to the written rules.

          How to apply the risk-reward ratio to real-world decision-making?

          The first step is to standardize the recording method using the denominator R. For each transaction, an initial risk of 1R is defined, and the final result is recorded as +1.4R, -1R, or -0.2R. This allows for comparison of different prices, instruments, and positions on the same scale.

          The second step is to separately analyze bullish, bearish, and market conditions. At least separate trends from ranges, and normal volatility from high volatility. If the advantage exists only in one environment, then trading filters are more important than improving the nominal risk-reward ratio.

          The third step involves reporting four metrics simultaneously: win rate, average profit, average loss, and expected value per trade. These are all essential; in addition, the maximum consecutive loss, maximum drawdown, and profit factor must be included to determine whether the profit path is sustainable.

          The fourth step is to conduct a cost stress test. Increase the spread, commission, and slippage by 25% and 50% respectively, and recalculate the expected values. Strategies that can turn negative results from slight cost changes usually lack sufficient buffer.

          Fifth, use fixed risk to deduce position size. First, determine the stop-loss based on the chart structure, rather than deciding how much to buy. The position size formula is: Tolerable account risk ÷ (Difference between entry price and stop-loss price + unit cost).

          An executable pre-trade checklist

          • Is the stop-loss determined by structural failure, rather than by trying to achieve a nice 2R?
          • Is the target price supported by liquidity, previous highs and lows, or volatility?
          • Is the actual average profit or loss being used, or the planned value per trade?
          • Have spreads, commissions, slippage, and overnight costs been factored in?
          • Does the current market environment align with the statistical sample?
          • After six consecutive losses, is the account drawdown still within an acceptable range?

          The correct use of the risk/reward ratio is not to replace judgment, but to put entry, exit, and position sizing into the same probabilistic framework. Only by first verifying positive expected value, and then controlling individual risk and drawdown path, can a "good opportunity" on the chart be transformed into sustainable trading results.

          Risk Warnings and Disclaimers
          You understand and acknowledge that there is a high degree of risk involved in trading. Following any strategies or investment methods may lead to potential losses. The content on the site is provided by our contributors and analysts for information purposes only. You are solely responsible for determining whether any trading assets, securities, strategy, or any other product is suitable for investing based on your own investment objectives and financial situation.
          Add to Favorites
          Share
          FastBull
          Copyright © 2026 FastBull Ltd

          728 RM B 7/F GEE LOK IND BLDG NO 34 HUNG TO RD KWUN TONG KLN HONG KONG

          TelegramInstagramTwitterfacebooklinkedin
          App Store Google Play Android Windows
          Products
          Charts

          Chats

          Q&A with Experts
          Screeners
          Economic Calendar
          Data
          Tools
          Membership
          Features
          Function
          Markets
          Copy Trading
          Latest Signals
          Contests
          24/7
          Analysis
          Education
          Company
          Careers
          About Us
          Contact Us
          Advertising
          Download FastBull
          Help Center
          Feedback
          User Agreement
          Privacy Policy
          Personal Information Protection Statement
          Business

          White Label

          Broker API

          Data API

          Web Plug-ins

          Poster Maker

          Affiliate Program

          Risk Disclosure

          The risk of loss in trading financial instruments such as stocks, FX, commodities, futures, bonds, ETFs and crypto can be substantial. You may sustain a total loss of the funds that you deposit with your broker. Therefore, you should carefully consider whether such trading is suitable for you in light of your circumstances and financial resources.

          No decision to invest should be made without thoroughly conducting due diligence by yourself or consulting with your financial advisors. Our web content might not suit you since we don't know your financial conditions and investment needs. Our financial information might have latency or contain inaccuracy, so you should be fully responsible for any of your trading and investment decisions. The company will not be responsible for your capital loss.

          Without getting permission from the website, you are not allowed to copy the website's graphics, texts, or trademarks. Intellectual property rights in the content or data incorporated into this website belong to its providers and exchange merchants.

          Not Logged In

          Log in to access more features

          Connect Broker
          Become a signal provider
          Help Center
          Customer Service
          Dark Mode
          Price Up/Down Colors

          Log In

          Sign Up

          Position
          Layout
          Fullscreen
          Default to Chart
          The chart page opens by default when you visit fastbull.com