


- USDJPY
- XAUUSD
- XAGUSD
- WTI


Markets
Analysis
User
24/7
Economic Calendar
Education
Data
- Names
- Latest
- Prev















Taking 40% off at 1R changes the result of the whole forex trade. Reconcile quantities, realised profit, the remaining stop and costs, then compare exit rules on the same price paths.
A final target at three times the initial stop distance does not make a partially closed trade a 3R winner. Once some units leave early, each exit must be weighted by its share of the original position. The last price on the chart describes the remaining units, not the entire trade.
Partial profit-taking exchanges some participation in a later trend for a smaller position during a reversal. Whether that exchange improves results depends on the paths that occur, the stop rule and the costs. A cash profit booked at the first exit is not enough to answer the question.
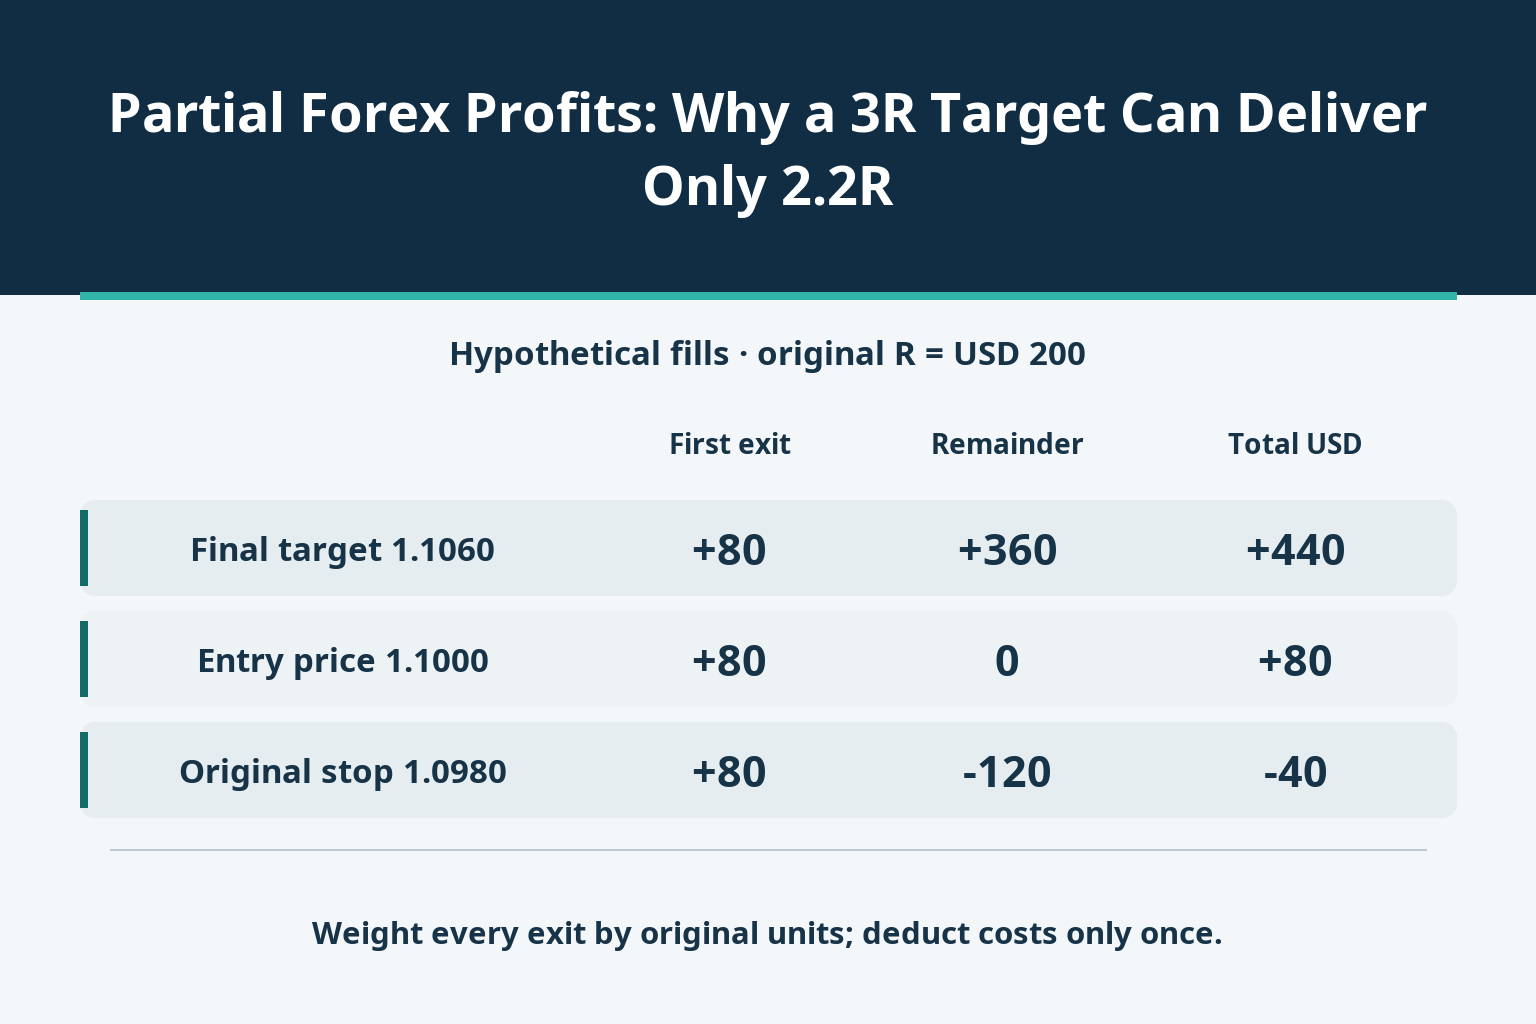
Consider a hypothetical USD account buying 100,000 EUR/USD units at an actual fill of 1.1000. The planned initial stop is 1.0980. Under linear price P/L, the initial price-distance risk is 100,000×0.0020=200 USD. Call this amount 1R throughout the trade. It excludes explicit fees and any execution beyond the planned stop.
Assume 40,000 units are actually sold at 1.1020. That slice earns 40,000×0.0020=80 USD, or 0.4R of the original trade. There are 60,000 units left. A price rise of 1R has not booked 1R on the entire initial quantity.
For a single entry, gross P/L after all exits is the sum of each closed quantity multiplied by its exit price minus the entry price. Divide that sum by the original 200 USD to report the whole-trade R multiple. Do not silently change the denominator to the risk on the smaller remaining position.
The following endings are independent scenarios after the same first exit. All exit prices are hypothetical actual fills, not promises that an order triggers and fills at a chosen level.
| Remainder fill | First 40,000, USD | Last 60,000, USD | Whole trade, USD / R |
|---|---|---|---|
| 1.1060 | +80 | +360 | +440 / 2.2R |
| 1.1000 | +80 | 0 | +80 / 0.4R |
| 1.0980 | +80 | −120 | −40 / −0.2R |
At 1.1060, the remaining 60,000 units earn 360 USD. Add the first 80 and the total is 440 USD, or 2.2R. Holding all 100,000 units to that price would have earned 600 USD, or 3R. The early exit gives up 160 USD in this particular outcome.
If the remainder exits at the entry price, its own gross P/L is zero but the complete trade still has the first 80 USD. If it exits at the original stop, it loses 120 USD: the complete trade is down 40 USD despite the earlier profitable exit. “I have already taken profit” does not mean the whole trade can no longer lose.
Write every instruction in units as well as a percentage. Closing 30% of the original 100,000 units removes 30,000. Closing 50% of the 70,000 remaining units removes another 35,000, not another 50,000. The residual is 35,000. Percentages of original size and percentages of current size are different schedules.
Volume increments and minimum residual sizes can prevent an exact intended fraction. Recalculate the weights from executed quantities, including a partial fill, rather than retaining the requested 40% in the spreadsheet. If the entry itself consists of several prices, reconcile the matching lots or the account’s recorded entry basis before applying a weighted exit calculation.
Nor is a new opposite order necessarily a reduction. Account position accounting can leave a separate opposite trade open instead of closing the intended ticket. Confirm the position identifier, closed volume and remaining volume in the execution record, then check the size of any remaining protective orders.
For a controlled hypothetical comparison, keep the initial stop unchanged for both methods. Out of 100 paths, suppose 40 hit the stop before the first target, 35 reach 1R and then reverse to the original stop, and 25 continue to 3R. These are invented counts for a calculation, not an estimated win rate.
| Hypothetical path | Trades | Scale out, USD each | Hold full size, USD each |
|---|---|---|---|
| Stop before first target | 40 | −200 | −200 |
| 1R then original stop | 35 | −40 | −200 |
| 1R then 3R target | 25 | +440 | +600 |
Scaling out produces 40×(−200)+35×(−40)+25×440=1,600 USD gross across 100 trades, or 0.08R per trade. Holding the entire quantity gives 40×(−200)+35×(−200)+25×600=0. With an assumed total explicit cost of 8 USD per completed trade for either method, the respective net averages are 0.04R and −0.04R. Real cost totals may differ.
The advantage comes from the selected path mix. After the first target, an early 40% exit improves the original-stop reversal outcome by 160 USD but reduces the final-target outcome by the same amount. If those two conditional outcomes are equally likely, their gross advantage cancels in this model. More continuations can favour holding. A different stop, trailing rule or target creates different paths and requires a fresh comparison.
Moving the remaining stop to the entry price changes the strategy; it is not an accounting adjustment to the original-stop comparison. It can alter which later paths survive to the final target. A backtest that credits both the safer stop and the original continuation rate without replaying prices is mixing two systems.
Using actual fill prices already incorporates their bid–ask and slippage effects relative to any reference price. Do not subtract an estimated spread again from that same execution P/L. Add only the commission, financing, conversion charges and other adjustments not already included in the reported result. Check the statement’s definitions before adding them.
The 8 USD cost assumption changes the three completed outcomes to 432, 72 and −48 USD. It is an illustrative input, not a broker fee schedule. Multiple exits need not raise total proportional commission when total traded volume is unchanged, but minimum per-order fees, different execution conditions and holding times can change the bill.
Keep one row per complete trade with its original quantity, entry fills, original stop and R amount. Under it record each exit’s time, requested and filled units, price, realised P/L and allocated costs. The sum of closed units plus the live residual must reconcile to the relevant entry quantity, after any documented additions.
Separate booked P/L from the mark-to-market of units still open. Compare complete trades under identical entry signals, common price data and clearly specified exit rules; include trades that never reach the first profit target. Record mean net R, loss size, drawdowns and the number of paths, rather than treating a higher percentage of profitable partial tickets as a higher trade win rate.
Before relying on the result, test changed costs, missed or partial fills, different continuation frequencies and the effect of moving the residual stop. Link the original R amount to a defined account-risk budget. Partial profit-taking is a change in the distribution of outcomes; the ledger and the path comparison determine whether that change serves the stated objective.

728 RM B 7/F GEE LOK IND BLDG NO 34 HUNG TO RD KWUN TONG KLN HONG KONG


The risk of loss in trading financial instruments such as stocks, FX, commodities, futures, bonds, ETFs and crypto can be substantial. You may sustain a total loss of the funds that you deposit with your broker. Therefore, you should carefully consider whether such trading is suitable for you in light of your circumstances and financial resources.
No decision to invest should be made without thoroughly conducting due diligence by yourself or consulting with your financial advisors. Our web content might not suit you since we don't know your financial conditions and investment needs. Our financial information might have latency or contain inaccuracy, so you should be fully responsible for any of your trading and investment decisions. The company will not be responsible for your capital loss.
Without getting permission from the website, you are not allowed to copy the website's graphics, texts, or trademarks. Intellectual property rights in the content or data incorporated into this website belong to its providers and exchange merchants.
Not Logged In
Log in to access more features


Log In
Sign Up


