


- USDJPY
- XAUUSD
- XAGUSD
- WTI



Markets
Analysis
User
24/7
Economic Calendar
Education
Data
- Names
- Latest
- Prev









A balance chart can show a 10% drawdown while investment performance falls 32.5%. Rebuild the unit-value path, handle cash-flow timing and calculate recovery and remaining risk room.
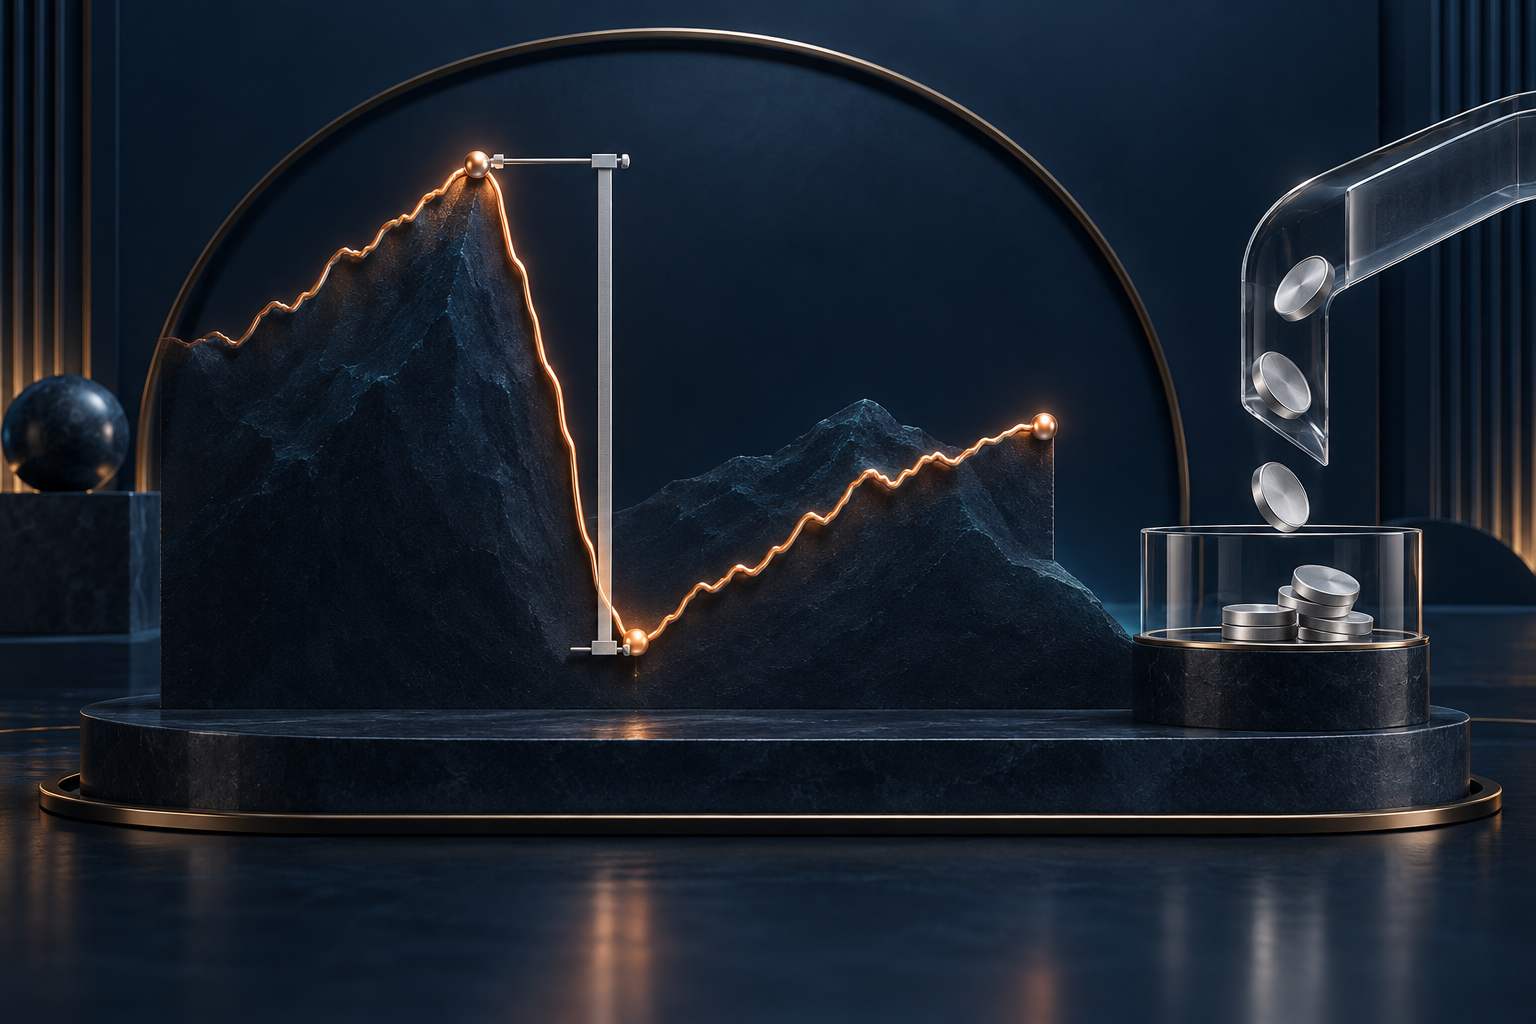
A new account high can be funded by a deposit, not earned by the portfolio. In the example below, a closing-balance chart reports a maximum drawdown of 10%. Strip out the external cash flow and the investment path suffered a 32.5% drawdown. Before comparing strategies, separate new capital from performance and measure each decline against a peak that actually came before it.
Maximum drawdown is not the same as the loss since inception, and it is not a ceiling on future losses. The number depends on what is marked to market, how cash flows are treated and when observations are taken. A precise-looking percentage is not meaningful until those choices are clear.
Use consistently valued account equity: cash, marked positions or open profit and loss, and relevant accrued costs and liabilities. A closed-trade balance can look stable while an open position carries a substantial loss. That distinction is particularly important in leveraged forex and futures accounts.
One way to neutralise external flows is to unitise the account. Divide starting equity by an arbitrary starting unit value. Issue accounting units for a deposit, or cancel them for a withdrawal, at the unit value immediately before the transfer. The transfer changes the number of units, not their value. These are analytical units, not legal fund shares.
For a positive unit-value series U, keep a running high H covering observations up to and including the current point. Drawdown magnitude is 1−U/H; maximum drawdown is its largest value. Some charts show drawdowns as negative numbers instead. Either convention works if labelled consistently. Do not measure an earlier trough against a high that occurred later.
Consider this hypothetical account in a single currency. Equity includes open-position valuations and applicable costs. The exact values immediately before and after the transfer are known; currency translation is excluded. Start with 100,000 of equity and assign a unit value of 100, creating 1,000 accounting units.
| Observation | Equity | Units | Unit value | Drawdown |
|---|---|---|---|---|
| Start | 100,000 | 1,000 | 100 | 0% |
| Day 1 close | 120,000 | 1,000 | 120 | 0% |
| Day 2, before deposit | 90,000 | 1,000 | 90 | 25% |
| Day 2, after 90,000 deposit | 180,000 | 2,000 | 90 | 25% |
| Day 3 close | 162,000 | 2,000 | 81 | 32.5% |
The deposit buys 90,000/90 = 1,000 additional units. Equity doubles, but the unit value stays at 90. A subsequent 10% decline takes that value to 81. The peak-to-trough loss is 1−81/120 = 32.5%, while the cumulative flow-adjusted return from the initial unit value is −19%. They answer different questions, so neither number contradicts the other.
Now use only post-flow closing account balances: 100,000, 120,000, 180,000 and 162,000. That series shows a maximum drawdown of just 10%. It excludes the day-two pre-deposit valuation of 90,000 and treats contributed capital as a new performance high. The arithmetic is correct for the wrong input series.
Withdrawals can distort the result in the opposite direction. Replace the deposit with a withdrawal of 45,000 at a unit value of 90. The account retains 500 units worth 45,000. After the same subsequent 10% loss, equity is 40,500 and each unit is worth 81. The raw fall from 120,000 is 66.25%; the investment drawdown remains 32.5%.
If a flow C occurs at the very end of a period and ending equity E includes it, the period return is (E−C)/starting equity−1. If it occurs at the beginning, the return is E/(starting equity+C)−1. Deposits are positive C and withdrawals negative.
Start with 100,000, add 100,000 and finish with 210,000. An end-period deposit implies a 10% investment return; a beginning-period deposit implies 5%. Knowing only that the money arrived that day cannot identify the correct answer. For an intraday flow, value the account at the transfer, calculate the return on each side and compound the subperiod returns. Without that valuation, disclose an approximation rather than claiming an exact time-weighted result.
A security purchase inside the account is not an external flow. A dividend retained in the account is investment income, not a deposit. Transaction and financing costs belong in net performance; classifying them as withdrawals merely to neutralise their effect inflates results. Adjusting for the transfer also does not remove the genuine subsequent effect of holding more cash or changing leverage after new money arrives.
Recovering from 81 to the old unit-value peak of 120 requires 120/81−1, or approximately 48.1481%. With 2,000 units and no further cash flows, equity would have to rise from 162,000 to 240,000. Returning only to the initial unit value of 100 needs 23.4568%. Restoring a high-water mark, recovering initial unit value and breaking even on actual cash invested are different targets.
Suppose, purely for illustration, an account has a pre-agreed risk review at a 35% drawdown. With a peak of 120, that level is 78. From the current 81, another 3/81 = 3.7037% decline reaches it. The gap between drawdown readings is 2.5 percentage points, not another 2.5% loss on current equity. A deposit does not reset the unit-value high. Nor is the review threshold a universally safe limit or a guaranteed exit price.
Closing observations can miss intraday losses. Taking a subset of an otherwise identical, positive valuation series cannot reveal a larger maximum drawdown than the complete series. That comparison fails if the two reports use different currencies, marks or fee treatment. Label a month-end drawdown as month-end; do not present it as a measure of intraday stress.
Record the peak date, trough date and first subsequent recovery to the old high. Maximum drawdown measures depth. Time underwater includes the recovery phase after the trough. If recovery has not occurred by the end of the sample, mark it as unrecovered rather than treating the final observation as a recovery date. Two paths with identical total returns may have very different drawdowns.
This unit-value method assumes positive equity, usable valuations and reinvested performance. Zero or negative equity, stale marks, and fixed-notional programmes that do not reinvest require separate treatment. A historical worst loss also cannot replace a gap, liquidity or margin stress test. An account can run short of usable collateral before its selected review level is reached.
A leveraged product adds another layer. Its own daily compounding is separate from deposits into the investor’s account. The worked guide to daily-reset leveraged ETF returns explains why a flat benchmark need not restore a fund’s value. Cash-flow adjustment explains a different trap: a larger account balance need not mean that investment losses have been recovered.

728 RM B 7/F GEE LOK IND BLDG NO 34 HUNG TO RD KWUN TONG KLN HONG KONG





The risk of loss in trading financial instruments such as stocks, FX, commodities, futures, bonds, ETFs and crypto can be substantial. You may sustain a total loss of the funds that you deposit with your broker. Therefore, you should carefully consider whether such trading is suitable for you in light of your circumstances and financial resources.
No decision to invest should be made without thoroughly conducting due diligence by yourself or consulting with your financial advisors. Our web content might not suit you since we don't know your financial conditions and investment needs. Our financial information might have latency or contain inaccuracy, so you should be fully responsible for any of your trading and investment decisions. The company will not be responsible for your capital loss.
Without getting permission from the website, you are not allowed to copy the website's graphics, texts, or trademarks. Intellectual property rights in the content or data incorporated into this website belong to its providers and exchange merchants.
Not Logged In
Log in to access more features


Log In
Sign Up


