


- XAUUSD
- XAGUSD
- WTI
- USDX


Markets
Analysis
User
24/7
Economic Calendar
Education
Data
- Names
- Latest
- Prev











A price of 350 can sit above one trendline and below another without either quote being wrong. Rebuild the two lines from the same anchors, compare the arithmetic, and choose a chart scale before testing a breakout.
A breakout that disappears when the price axis changes is a warning about the measurement rule, not evidence that the market has changed its mind. A linear chart gives equal space to equal price differences; a logarithmic chart gives equal space to equal price ratios. Neither is universally more accurate. The useful question is whether the analysis concerns an absolute move or a proportional rate of growth—and whether the trendline was defined consistently before the signal appeared.
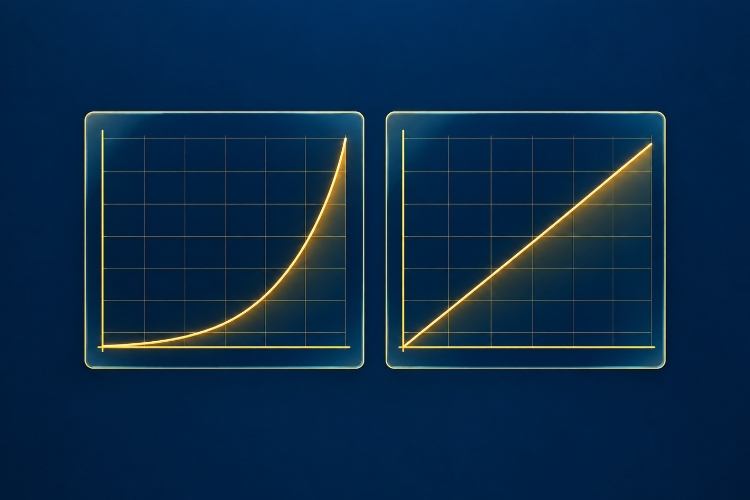
On a linear axis, a rise from 100 to 200 occupies the same vertical distance as a rise from 300 to 400: both add 100 price units. Yet their returns are 100% and 33.33%. On a log axis, the equal-distance pair is 100 to 200 and 200 to 400, because both double the price. This preserves the visibility of earlier percentage moves when a chart spans a wide price range.
That distinction also prevents a common misunderstanding. A move from 100 to 200 followed by a return to 100 covers equal distances up and down on a log chart. The simple returns are still +100% and −50%, not equal percentages. A reciprocal price ratio reverses the logarithmic distance; it does not make the arithmetic returns symmetrical. No display setting changes the prices at which a position was opened or closed.
Consider hypothetical prices, with time measured in equally spaced bars. Two anchors have already been identified: price 100 at bar 0 and price 200 at bar 10. Draw a straight line through them separately in each coordinate system, then extend it beyond bar 10. This is a definition of two lines, not a claim that every charting tool automatically redraws objects this way when its display scale changes.
For the linear line, the price increases by 10 units per bar: P(t) = 100 + 10t. For the log line, the price ratio is constant: P(t) = 100 × 2^(t/10). The latter multiplies the price by about 1.071773 per bar, equivalent to roughly 7.1773% compounded—not a simple 10% each bar.
| Bar | Linear line | Log line | Hypothetical close |
|---|---|---|---|
| 10 | 200 | 200 | 200 |
| 15 | 250 | 282.8427 | 260 |
| 20 | 300 | 400 | 350 |
At bar 15, a close of 260 is 4% above the linear line but about 8.08% below the log line. At bar 20, 350 is 16.67% above 300 and 12.5% below 400. The conflicting classifications come from different benchmark paths. There has been no change in the quoted price. Calling either observation a tradable breakout also requires a previously specified crossing rule, the preceding price path and execution assumptions.
Both anchors must be knowable before the observation being tested. If an analyst discovers the second turning point only after several later bars, the test cannot begin at bar 10 merely because the chart labels that low there. Using a future swing point to classify an earlier crossing adds look-ahead bias even when the formula is correct.
Use proportional comparisons when the task is to compare growth across very different price levels. A log view is especially informative when a positive-priced asset has multiplied in value, because a large late-period cash move otherwise dominates the picture. A long time horizon alone is not the decisive test: a long history confined to a narrow price band may look similar on both scales.
For a question about an absolute price distance, a linear view is often the more direct representation. A fixed five-point move is five points, although its cash impact still depends on contract size and position size. In a narrow range the two displays are locally close because ln(1 + r) is approximately r for small returns. That approximation deteriorates as the proportional move grows.
Changing scale after a line has failed, simply to recover the preferred signal, changes the method after seeing the outcome. Specify the scale with the anchor-selection rule and test the combination. A result that survives several reasonable specifications may be more robust, but robustness is not proof of a profitable strategy.
A horizontal level at 200 remains 200 on either display. A sloping line reconstructed as straight in each coordinate system generally assigns different intermediate and projected prices. A screen angle such as 45 degrees is even less portable: stretching the window, changing its height or altering the visible date range can change the angle without changing a single observation. Compare a numerical rate per bar, not the apparent steepness.
Three operations should stay separate: changing the display scale, rebasing a series to a starting value or percentage, and adjusting historical data for corporate actions or contract rolls. A percentage display needs an explicit base date. A total-return series needs a reinvestment convention. Neither follows automatically from selecting a log axis.
The same applies to indicators. A simple moving average calculated from the original prices remains an arithmetic average when plotted on a log axis. Calculating the average of log prices and exponentiating it would instead produce a geometric average. Those are different calculations, so check the indicator definition rather than inferring it from the axis.
The ordinary logarithm of a price requires P > 0. A zero or negative observation cannot be silently omitted to make a chart look tidy. In futures, inspect both the actual contract and the historical adjustment method: a back-adjusted continuous series can contain nonpositive values even when the corresponding individual contract prices were positive. The distinction between continuous futures charts and tradable contracts is therefore part of choosing a valid scale.
Adding a constant to every price is not a neutral repair. It changes price ratios and therefore the log trendline. Use a display valid for the data, identify the adjustment convention and do not compare its line to a differently constructed series as if they were interchangeable.
First freeze the instrument, contract or adjustment convention, bar interval, session and time zone. Next record the two anchor prices, their bar numbers and the date on which each anchor became identifiable. For anchors A and B at t0 and t1, calculate the linear path as A + (B − A) × (t − t0)/(t1 − t0); calculate the log path as A × (B/A)^((t − t0)/(t1 − t0)), provided A and B are positive.
Then compare the same completed bar with the numerical line level. Define whether a crossing needs a close beyond the line, a buffer or a subsequent confirmation; do not invent that condition after the event. Finally separate a chart classification from a trading result by checking spread, slippage, position size and a fresh sample. If the two scales disagree, the honest conclusion is that the signal depends on the growth assumption—not that the preferred chart has revealed the true price.

728 RM B 7/F GEE LOK IND BLDG NO 34 HUNG TO RD KWUN TONG KLN HONG KONG





The risk of loss in trading financial instruments such as stocks, FX, commodities, futures, bonds, ETFs and crypto can be substantial. You may sustain a total loss of the funds that you deposit with your broker. Therefore, you should carefully consider whether such trading is suitable for you in light of your circumstances and financial resources.
No decision to invest should be made without thoroughly conducting due diligence by yourself or consulting with your financial advisors. Our web content might not suit you since we don't know your financial conditions and investment needs. Our financial information might have latency or contain inaccuracy, so you should be fully responsible for any of your trading and investment decisions. The company will not be responsible for your capital loss.
Without getting permission from the website, you are not allowed to copy the website's graphics, texts, or trademarks. Intellectual property rights in the content or data incorporated into this website belong to its providers and exchange merchants.
Not Logged In
Log in to access more features


Log In
Sign Up


