• Trade
  • Markets
  • Copy
  • Contests
  • 24/7
  • Calendar
  • Q&A
  • Chats
Screeners
SYMBOL
LAST
BID
ASK
HIGH
LOW
NET CHG.
%CHG.
SPREAD
SOURCE
SPX
S&P 500 Index
7659.44
7659.44
7659.44
7756.84
7631.77
-84.62
-1.09%
--
--
DJI
Dow Jones Industrial Average
52002.41
52002.41
52002.41
52582.32
51847.94
-175.28
-0.34%
--
--
IXIC
NASDAQ Composite Index
26140.02
26140.02
26140.02
26674.66
26023.10
-572.99
-2.14%
--
--
USDX
US Dollar Index
101.590
101.590
101.670
101.860
101.350
-0.150
-0.15%
--
--
EURUSD
Euro / US Dollar
1.12378
1.12378
1.12410
1.12691
1.12077
+0.00176
+ 0.16%
--
--
GBPUSD
Pound Sterling / US Dollar
1.33269
1.33269
1.33316
1.33712
1.32608
+0.00516
+ 0.39%
--
--
XAUUSD
Gold / US Dollar
4165.81
4165.81
4166.25
4198.65
4146.99
-5.39
-0.13%
--
--
WTI
Light Sweet Crude Oil
98.882
98.882
98.912
99.253
95.209
+2.794
+ 2.91%
--
--

Community Accounts

Signal Accounts
--
Profit Accounts
--
Loss Accounts
--
View More

Become a signal provider

Sell trading signals to earn additional income

View More

Guide to Copy Trading

Get started with ease and confidence

View More

Signal Accounts for Members

All Signal Accounts

Best Return
  • Best Return
  • Best P/L
  • Best MDD
Past 1W
  • Past 1W
  • Past 1M
  • Past 1Y

All Contests

  • All
  • Recommend
  • Stocks
  • Cryptocurrencies
  • Central Banks
  • Trump Updates
  • Featured News
Top News Only
Share

ECB Governing Council Member Nagel: The Fight Against Inflation Is Not Over

Share

According To Japan's KYODO News, Sources Revealed That Raising Corporate Tax Rates May Be One Of The Options For Japan To Increase Defense Spending

Share

XPeng Motors: The XPeng GX Has Already Received More Than 3,000 Orders In The Middle East Region, Even Before Its Overseas Price Has Been Announced

Share

When Asked About The Russian Official's Walkout During His Speech, International Monetary And Financial Committee Chairman Aljudan Said That All Members Supported The Chairman's Statement

Share

When Asked If He Was Being Made A Scapegoat, Zelensky Remained Silent

Share

Pan Gongsheng, Governor Of China's Central Bank, Met With Central Bank Governors From Relevant Countries

Share

International Monetary Fund (IMF) Managing Director Kristalina Georgieva: Member Countries Discussed The Cracks In Economic Resilience As Energy And Fiscal Buffers Are Running Out

Share

IMF Managing Director Kristalina Georgieva: Stubborn Inflation And Rising Interest Rates Are Exacerbating Already High Debt Servicing Pressures In Countries

Share

IMF Managing Director Kristalina Georgieva: Central Banks Should Focus Highly On Maintaining Price Stability

Share

ECB Governing Council Member Rehn: The Effects Of A Second Round Of Inflation May Be Quietly Creeping In

Share

IMF Managing Director Kristalina Georgieva: We Are Working To Expand The Poverty Reduction And Growth Trust Fund, Which Provides Loans To Low-income Countries

Share

IMF Managing Director Kristalina Georgieva: We Believe That Many Low-income Countries Do Not Need To Make Major Adjustments

Share

ECB Governing Council Member Rehn: Monetary Policy Will Remain Prudent

Share

IMF Managing Director Kristalina Georgieva: The IMF Has Lowered Its Growth Forecast For The Entire Middle East And North Africa Region By 2%

Share

IMF Managing Director Kristalina Georgieva: Without Reforms And Expanded Buffers, The Effects Of The War Would Be Far More Severe; Iraq Has Requested A Loan Program, And We Will Provide Iraq With Financial And Policy Support

Share

IMF Managing Director Kristalina Georgieva: I Am Confident That We Will Successfully Reach An Agreement On A Plan For Lebanon

Share

The Iranian Islamic Revolutionary Guard Corps Navy Issued A Statement Saying That A Supertanker Carrying More Than 2 Million Barrels Of Crude Oil, Attempting To Pass Through An Unauthorized Channel In The Strait Of Hormuz, Struck A Mine, Causing A Violent Explosion And A Serious Fire

Share

Iranian Media Reported That The Iranian Revolutionary Guard Stated That An Oil Tanker Caught Fire After Striking A Mine In The Strait Of Hormuz

Share

The Collective Security Treaty Organization (CSTO) Is Conducting Joint Exercises In Belarus

Share

According To Dyukov, Head Of Gazprom's Oil Company, The Company Plans To Increase Its Oil Supply Via The Northern Sea Route By 35% By 2026

TIME
ACT
FCST
PREV
IMPACT
U.S. EIA Weekly Crude Demand Projected by Production

A:--

F: --

P: --

WTI
  • WTI
  • XAUUSD
  • XAGUSD
  • USDX
U.S. EIA Weekly Gasoline Stocks Change

A:--

F: --

P: --

WTI
  • WTI
  • XAUUSD
  • XAGUSD
  • USDX
U.S. Weekly Treasuries Held by Foreign Central Banks

A:--

F: --

P: --

USDX
  • USDX
  • XAUUSD
  • XAGUSD
  • WTI
FOMC Member Hammack Speaks
South Korea Unemployment Rate (SA) (Sept)

A:--

F: --

P: --

XAUUSD
  • XAUUSD
  • XAGUSD
  • WTI
US President Trump delivered a speech
BOE Gov Bailey Speaks
BOC Gov Macklem Speaks
Euro Zone CPI YoY (Excl. Tobacco) (Sept)

A:--

F: --

P: --

EURUSD
  • EURUSD
  • XAUUSD
  • XAGUSD
  • WTI
  • USDX
Canada Existing Home Sales MoM (Sept)

A:--

F: --

P: --

USDCAD
  • USDCAD
  • XAUUSD
  • XAGUSD
  • WTI
  • USDX
Euro Zone Core CPI Final MoM (Sept)

A:--

F: --

P: --

EURUSD
  • EURUSD
  • XAUUSD
  • XAGUSD
  • WTI
  • USDX
Euro Zone Core CPI Final YoY (Sept)

A:--

F: --

P: --

EURUSD
  • EURUSD
  • XAUUSD
  • XAGUSD
  • WTI
  • USDX
Euro Zone Trade Balance (Not SA) (Aug)

A:--

F: --

P: --
EURUSD
  • EURUSD
  • XAUUSD
  • XAGUSD
  • WTI
  • USDX
Euro Zone HICP Final YoY (Sept)

A:--

F: --

P: --

EURUSD
  • EURUSD
  • XAUUSD
  • XAGUSD
  • WTI
  • USDX
Euro Zone HICP Final MoM (Sept)

A:--

F: --

P: --

EURUSD
  • EURUSD
  • XAUUSD
  • XAGUSD
  • WTI
  • USDX
Euro Zone Trade Balance (SA) (Aug)

A:--

F: --

P: --

EURUSD
  • EURUSD
  • XAUUSD
  • XAGUSD
  • WTI
  • USDX
India Deposit Gowth YoY

A:--

F: --

P: --

XAUUSD
  • XAUUSD
  • XAGUSD
  • WTI
  • USDX
Canada New Housing Starts (Sept)

A:--

F: --

P: --

USDCAD
  • USDCAD
  • XAUUSD
  • XAGUSD
  • WTI
  • USDX
U.S. Export Price Index MoM (Sept)

A:--

F: --

P: --
USDX
  • USDX
  • XAUUSD
  • XAGUSD
  • WTI
U.S. Import Price Index YoY (Sept)

A:--

F: --

P: --
USDX
  • USDX
  • XAUUSD
  • XAGUSD
  • WTI
U.S. Import Price Index MoM (Sept)

A:--

F: --

P: --
USDX
  • USDX
  • XAUUSD
  • XAGUSD
  • WTI
U.S. Export Price Index YoY (Sept)

A:--

F: --

P: --

USDX
  • USDX
  • XAUUSD
  • XAGUSD
  • WTI
Saudi Arabia Crude Oil Production

A:--

F: --

P: --

WTI
  • WTI
  • XAUUSD
  • XAGUSD
  • USDX
U.S. Manufacturing Output MoM (SA) (Sept)

A:--

F: --

P: --
USDX
  • USDX
  • XAUUSD
  • XAGUSD
  • WTI
U.S. Industrial Output MoM (SA) (Sept)

A:--

F: --

P: --
USDX
  • USDX
  • XAUUSD
  • XAGUSD
  • WTI
U.S. Capacity Utilization MoM (SA) (Sept)

A:--

F: --

P: --
WTI
  • WTI
  • XAUUSD
  • XAGUSD
  • USDX
U.S. Manufacturing Capacity Utilization (Sept)

A:--

F: --

P: --

USDX
  • USDX
  • XAUUSD
  • XAGUSD
  • WTI
U.S. Industrial Output YoY (Sept)

A:--

F: --

P: --

USDX
  • USDX
  • XAUUSD
  • XAGUSD
  • WTI
U.S. Weekly Total Oil Rig Count

A:--

F: --

P: --

WTI
  • WTI
  • XAUUSD
  • XAGUSD
  • USDX
U.S. Weekly Total Rig Count

A:--

F: --

P: --

WTI
  • WTI
  • XAUUSD
  • XAGUSD
  • USDX
BOE Gov Bailey Speaks
U.K. Rightmove House Price Index YoY (Oct)

--

F: --

P: --

China, Mainland Industrial Output YoY (YTD) (Sept)

--

F: --

P: --

China, Mainland GDP YoY (YTD) (Q3)

--

F: --

P: --

China, Mainland GDP YoY (Q3)

--

F: --

P: --

China, Mainland GDP (Q3)

--

F: --

P: --

China, Mainland GDP QoQ (SA) (Q3)

--

F: --

P: --

China, Mainland Urban Area Unemployment Rate (Sept)

--

F: --

P: --

Canada National Economic Confidence Index

--

F: --

P: --

Canada Trimmed CPI YoY (SA) (Sept)

--

F: --

P: --

Canada Core CPI YoY (Sept)

--

F: --

P: --

Canada CPI MoM (Sept)

--

F: --

P: --

Canada Core CPI MoM (Sept)

--

F: --

P: --

Canada CPI YoY (Sept)

--

F: --

P: --

U.S. NAHB Housing Market Index (Oct)

--

F: --

P: --

Argentina Trade Balance (Sept)

--

F: --

P: --

China, Mainland 1-Year Loan Prime Rate (LPR)

--

F: --

P: --

China, Mainland 5-Year Loan Prime Rate

--

F: --

P: --

U.K. 3-Month ILO Unemployment Rate (Aug)

--

F: --

P: --

U.K. Unemployment Rate (Sept)

--

F: --

P: --

U.K. Unemployment Claimant Count (Sept)

--

F: --

P: --

U.K. 3-Month ILO Employment Change (Aug)

--

F: --

P: --

U.K. Average Weekly Earnings (3-Month Average, Excluding Bonuses) YoY (Aug)

--

F: --

P: --

U.K. Average Weekly Earnings (3-Month Average, Including Bonuses) YoY (Aug)

--

F: --

P: --

Germany PPI MoM (Sept)

--

F: --

P: --

Germany PPI YoY (Sept)

--

F: --

P: --

Euro Zone Current Account (SA) (Aug)

--

F: --

P: --

Euro Zone Current Account (Not SA) (Aug)

--

F: --

P: --

Germany ZEW Current Conditions Index (Oct)

--

F: --

P: --

Euro Zone ZEW Economic Sentiment Index (Oct)

--

F: --

P: --

Germany ZEW Economic Sentiment Index (Oct)

--

F: --

P: --

Q&A with Experts
    • All
    • Chatrooms
    • Groups
    • Friends
    5830146 flag
    I'm Professional trader
    Luminoux flag
    5830146
    I need Trader Friends👭👬
    @Visitor5830146you're welcome
    Nguyễn Thi flag
    5830146
    I'm Professional trader
    @5830146show pnl 6 tháng xem đi bạn
    RPGFX flag
    Nguyễn Thi
    @5830146show pnl 6 tháng xem đi bạn
    @Nguyễn Thi lol 😂 You already know he won't have that to show
    RPGFX flag
    Nguyễn Thi
    @5830146show pnl 6 tháng xem đi bạn
    He will only show one screenshot of whee he multilayered one trade and made 5 pips profits @Nguyễn Thi
    RPGFX flag
    5830146
    hi
    @Visitor5830146 Hello, how are you doing today?
    RPGFX flag
    5830146
    I need Trader Friends👭👬
    @Visitor5830146By being here you are already friends with thousands of traders all over the world (across the globe)
    RPGFX flag
    5830146
    I'm Professional trader
    @Visitor5830146We all are also professional traders
    Ashok Sen flag
    hi
    AftaaB KhaaN🔻🔺🔻🇵🇰 flag
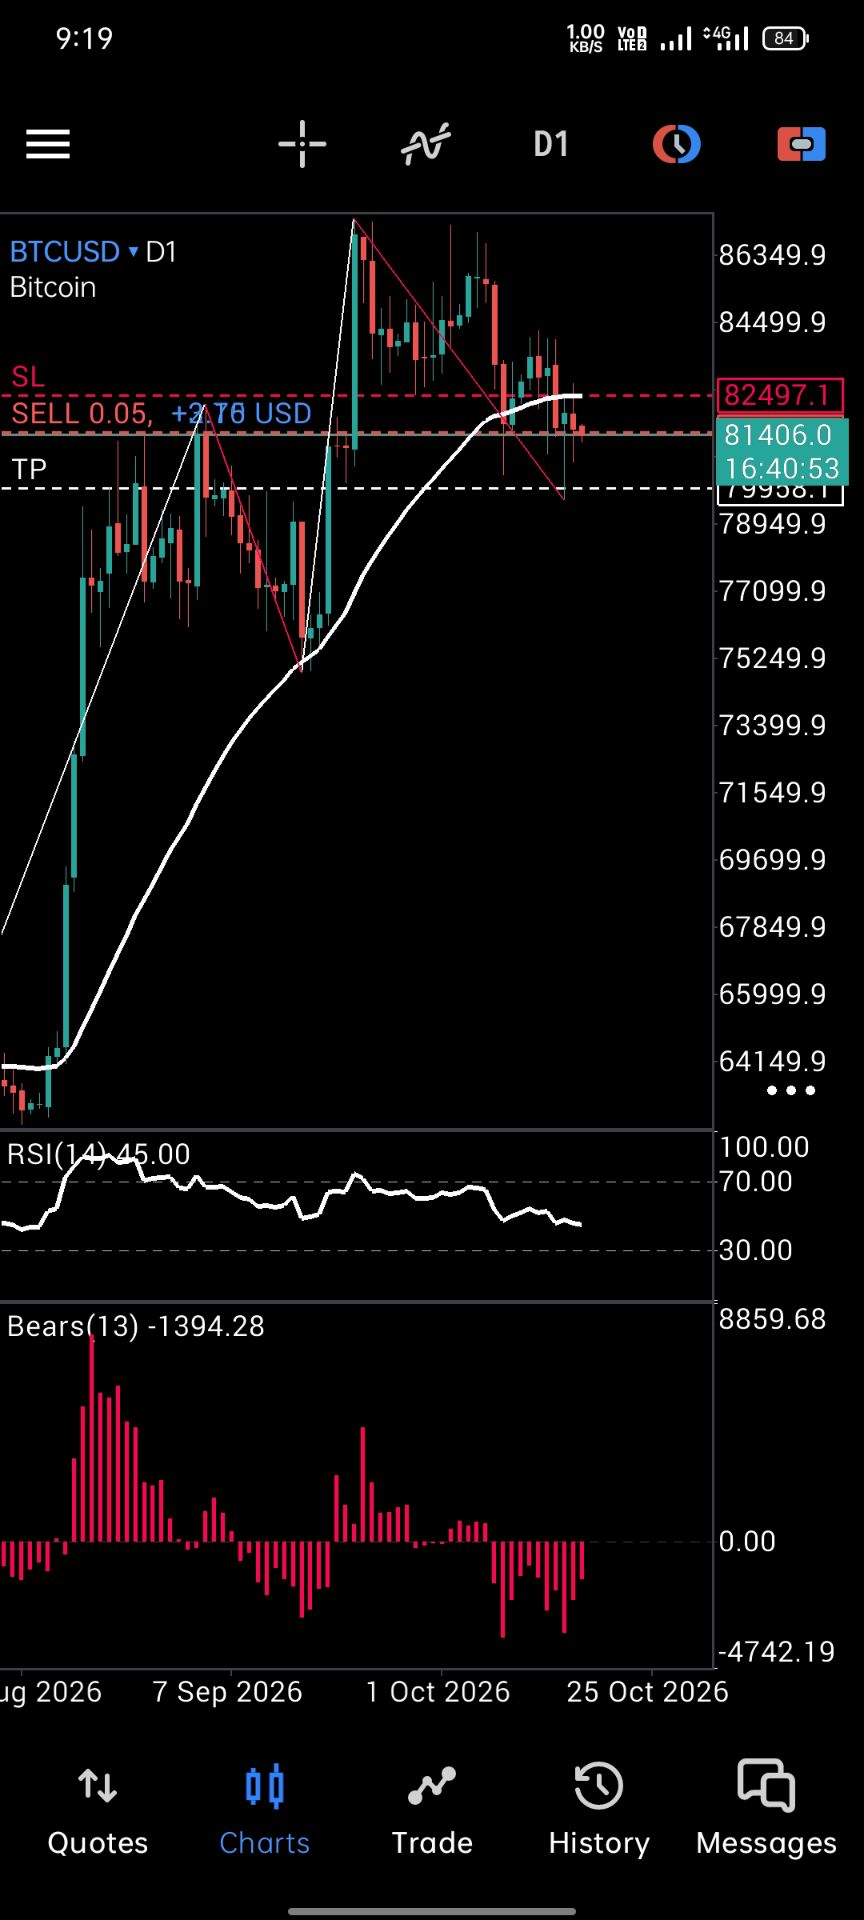
    Tell me if my TP and SL are placed correctly?
    AftaaB KhaaN🔻🔺🔻🇵🇰 flag
    RPGFX flag
    Ashok Sen
    hi
    @Ashok Sen Hello brother, how are you doing today?
    RPGFX flag
    Ashok Sen
    hi
    What is the current update with that your 300k my forex funds account?@Ashok Sen
    RPGFX flag
    AftaaB KhaaN🔻🔺🔻🇵🇰
    @AftaaB KhaaN🔻🔺🔻🇵🇰 You did the analysis so you are in the best place to know where is your correct tp and SL
    RPGFX flag
    AftaaB KhaaN🔻🔺🔻🇵🇰
    I see that you are working with a 1:1 risk to reward ratio @AftaaB KhaaN🔻🔺🔻🇵🇰
    john flag
    AftaaB KhaaN🔻🔺🔻🇵🇰
    @AftaaB KhaaN🔻🔺🔻🇵🇰this seems like 1:2 risk reward ratio right ?
    5819216 flag
    AftaaB KhaaN🔻🔺🔻🇵🇰 flag
    RPGFX
    @AftaaB KhaaN🔻🔺🔻🇵🇰 You did the analysis so you are in the best place to know where is your correct tp and SL
    @RPGFXThanks brother
    AftaaB KhaaN🔻🔺🔻🇵🇰 flag
    john
    @AftaaB KhaaN🔻🔺🔻🇵🇰this seems like 1:2 risk reward ratio right ?
    @john@johnYes brother
    Osaghae Cephas flag
    gm guys..
    Type here...
    Add Symbol or Code

      No matching data

      All
      Recommend
      Stocks
      Cryptocurrencies
      Central Banks
      Trump Updates
      Featured News
      • All
      • Russia-Ukraine Conflict
      • Middle East Flashpoint
      • All
      • Russia-Ukraine Conflict
      • Middle East Flashpoint
      Search
      Products

      Charts Free Forever

      Chats Q&A with Experts
      Screeners Economic Calendar Data Tools
      Membership Features
      Data Warehouse Market Trends Institutional Data Policy Rates Macro

      Market Trends

      Market Sentiment Order Book Forex Correlations

      Top Indicators

      Charts Free Forever
      Markets

      News

      24/7 Analysis Education

      Latest Views

      Latest Update

      Signals

      Copy Rankings Latest Signals Become a signal provider AI Rating
      Contests
      Brokers

      Overview Brokers Assessment Rankings Regulators News Claims
      Broker listing Forex Brokers Comparison Tool Live Spread Comparison Scam
      Q&A Complaint Scam Alert Videos Tips to Detect Scam
      More

      Business
      Events
      Careers About Us Advertising Help Center

      White Label

      Broker API

      Data API

      Web Plug-ins

      Affiliate Program

      Awards Institution Evaluation IB Seminar Salon Event Exhibition
      Vietnam Thailand Singapore Dubai
      Fans Party Investment Sharing Session
      FastBull Summit BrokersView Expo
      Recent Searches
        Top Searches
          Markets
          Analysis
          User
          24/7
          Economic Calendar
          Education
          Data
          • Names
          • Latest
          • Prev

          View All

          No data

          Scan to Download

          Faster Charts, Chat Faster!

          Download
          English
          • English
          • Español
          • العربية
          • Bahasa Indonesia
          • Bahasa Melayu
          • Tiếng Việt
          • ภาษาไทย
          • Français
          • Italiano
          • Türkçe
          • Русский язык
          • 简中
          • 繁中
          Open Account
          Search
          Products
          Charts Free Forever
          Markets
          News
          Signals

          Copy Rankings Latest Signals Become a signal provider AI Rating
          Contests
          Brokers

          Overview Brokers Assessment Rankings Regulators News Claims
          Broker listing Forex Brokers Comparison Tool Live Spread Comparison Scam
          Q&A Complaint Scam Alert Videos Tips to Detect Scam
          More

          Business
          Events
          Careers About Us Advertising Help Center

          White Label

          Broker API

          Data API

          Web Plug-ins

          Affiliate Program

          Awards Institution Evaluation IB Seminar Salon Event Exhibition
          Vietnam Thailand Singapore Dubai
          Fans Party Investment Sharing Session
          FastBull Summit BrokersView Expo

          Gross vs Net Revenue: Why Margins and EV/Sales Can Mislead

          zhan chen
          Summary:

          A 100% gross margin can leave the same operating profit as a 20% margin. Reconcile principal and agent revenue, test fee compression and separate changes in business mix before comparing stock valuations.

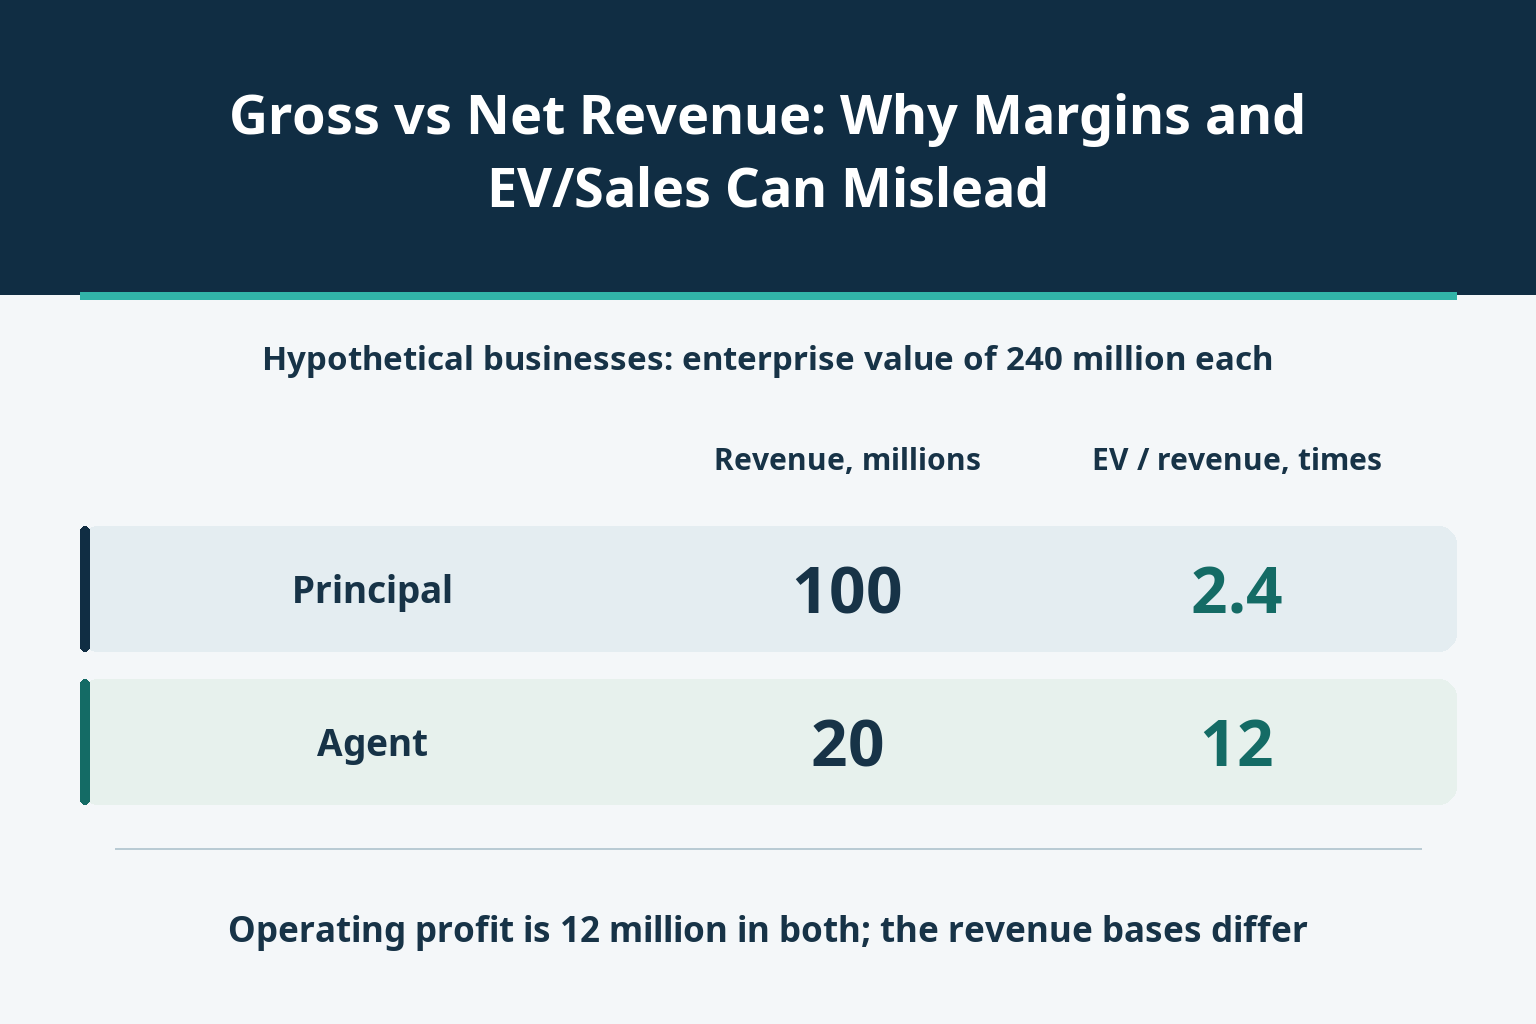
          A company reporting a 100% gross margin is not necessarily keeping more money than one reporting 20%. In the example below, each earns 20 million before other operating expenses and 12 million afterwards. Yet their enterprise-value-to-revenue multiples are 12 times and 2.4 times. Ranking them by either headline would confuse the revenue denominator with the economics.

          The useful distinction is between gross revenue earned as a principal and fee revenue earned as an agent. First establish what the company has promised to deliver. Then reconcile the transaction amount, the income retained and the costs needed to earn it. Only after that can revenue growth or a valuation multiple support a comparison.
          Gross vs Net Revenue: Why Margins and EV/Sales Can Mislead_1

          Who controls the promised product before the customer receives it?

          Under the IFRS 15 framework, the assessment concerns a specified good or service. A principal controls it before transfer to the customer; an agent arranges for another party to provide it. The principal recognises the relevant gross consideration as revenue, while the agent recognises its fee or commission. A company cannot choose whichever presentation makes its growth or margins look better.

          Responsibility for fulfilling the promise, inventory risk and pricing discretion can help establish control. They are evidence, not a three-box vote. Sending the invoice, collecting the customer's money or describing the business as a platform does not settle the question by itself. Different promises within the same company can require different conclusions.

          For an investor, the starting documents are the revenue policy, the description of performance obligations and significant judgements. If they do not establish the relevant facts, a ratio cannot fill the gap. A comparison may need to remain inconclusive rather than force every business onto a presumed net basis.

          Follow 100 of customer spending through two different businesses

          Consider two hypothetical businesses whose different contract facts support their respective principal and agent classifications. All amounts are millions of the same currency and cover the same reporting period. Each handles 100 of end-customer transaction value; 80 is a purchase cost or an amount passed to the supplier. Each retains 20 before other operating expenses of 8.

          To isolate the denominator, the agent has no additional cost of sales in this model. Taxes, refunds, financing, timing differences and other costs are excluded. These are not two optional accounting treatments for one unchanged contract, and the assumptions do not establish equal business risk.

          MeasurePrincipal businessAgent business
          End-customer transaction value, millions100100
          Reported revenue, millions10020
          Cost of sales, millions800
          Gross profit, millions2020
          Gross margin20%100%
          Operating profit, millions1212
          Operating margin12%60%
          Assumed enterprise value, millions240240
          Enterprise value / revenue, times2.412
          Enterprise value / operating profit, times2020

          The principal's gross margin is 20/100, or 20%. The agent's is 20/20, or 100%. Both have gross profit of 20 and operating profit of 12. Their operating margins are also different—12% and 60%—because revenue remains the denominator.

          The agent's 100% figure is a consequence of the deliberately simplified cost structure, not a rule for agency businesses. An actual agent may incur direct fulfilment or other costs. Equally, the 20 retained here is an analytical subtotal: it is neither net income nor free cash flow and should not be relabelled as a universal accounting measure called “net revenue”.

          A lower revenue multiple need not mean a cheaper business

          Give each business an enterprise value of 240 at the same valuation date. This is an input for the comparison, not a finding that the businesses deserve the same value. Dividing by reported revenue produces 240/100 = 2.4 times for the principal and 240/20 = 12 times for the agent. The fivefold gap does not come from a difference in the assumed operating profit.

          Dividing by operating profit produces 240/12 = 20 times in each case. That removes this particular revenue-base mismatch, but does not finish the valuation. Capital expenditure, working capital, reinvestment needs, growth and contractual exposure can justify different values even when current operating profit matches. Nor is operating profit interchangeable with EBITDA, net income or distributable cash.

          The numerator needs its own consistent scope. Reconciling enterprise value with market capitalisation and net debt avoids mixing an operating valuation with an equity-only measure. Here the separate question is whether the revenue beneath that numerator describes the same economic activity. Use the same reporting window and consolidation perimeter, and identify historical versus forecast denominators explicitly.

          Separate a presentation difference from a shrinking fee

          Now keep the agency basis unchanged. Let G be the consistently defined transaction value, t the fee revenue divided by G, and O the other operating expenses. With the same simplified cost assumptions, revenue is G × t and operating profit is G × t − O.

          Suppose transaction value rises from 100 to 120 while the fee ratio falls from 20% to 15%. Revenue falls from 20 to 18. With expenses still 8, operating profit falls from 12 to 10: a decline of one-sixth, approximately 16.666667%, despite 20% growth in transaction value. There is no gross-to-net accounting switch in this case. The business is retaining less income from each unit of activity.

          Separate scenarioTransaction value, millionsFee revenue / transaction valueReported revenue, millionsOther operating expenses, millionsOperating profit, millions
          Starting case10020%20812
          Transaction value rises 20%; fee ratio falls to 15%12015%18810
          Preserve profit; expenses remain 81201/6 ≈ 16.666667%20812
          Preserve profit; expenses rise to 1012011/60 ≈ 18.333333%221012

          To preserve the original operating profit of 12, the required fee ratio is t = (12 + O) / G. At transaction value of 120 and expenses of 8, that is exactly one-sixth, approximately 16.666667%. If expenses instead rise to 10, the threshold becomes 22/120, or 11/60, approximately 18.333333%. The table uses the exact fractions for its money amounts; the displayed percentages are rounded.

          A ratio above the relevant threshold improves profit beyond 12; equality merely preserves it. Avoid confusing that hurdle with avoiding a loss: at G = 120 and O = 8, zero operating profit requires only 8/120, or approximately 6.666667%. Neither percentage is an industry benchmark. Both depend on the stated transaction value and cost structure.

          Business mix can halve revenue without halving profit

          A third, separate example combines genuinely different principal and agency arrangements. Hold total transaction value at 100, the amount retained before other expenses at 20% in both activities, and total other expenses at 8. Let a be the principal activity's share of transaction value.

          Reported revenue is 100a + 20(1 − a), or 20 + 80a. Reported cost of sales is 80a. Gross profit is therefore 20 and operating profit 12 throughout this simplified mix experiment.

          If the principal share falls from 75% to 25%, reported revenue falls from 80 to 40. Gross margin rises from 25% to 50%, and operating margin from 15% to 30%. Revenue has halved and the margins have doubled, but neither gross profit nor operating profit has improved. This is a change in the mix of different activities, not permission to change the accounting for an unchanged contract.

          The real-world test is whether transaction value, retention and cost assumptions actually hold. A shift in contracts may change returns, inventory, credit exposure and funding needs. Without a sufficient segment or transaction bridge, do not manufacture a “like-for-like” growth number by subtracting an estimated supplier share from all reported revenue.

          Revenue retained is not cash available to shareholders

          Receiving 100 into a bank account while owing 80 to a supplier does not make all 100 available for distribution. Conversely, reporting 20 of revenue does not establish that 20 has been collected or is unrestricted cash. Collection timing, settlement obligations and refunds need their own reconciliation. The principal–agent revenue assessment is not, by itself, a rule for net presentation in the cash flow statement.

          Comparability also fails if one company includes taxes, shipping or cancelled orders in its transaction metric while another excludes them. A disclosed “take rate” may divide a different income measure by a different activity measure. Reproduce the definitions before interpreting a change. Discounts, subsidies and customer incentives also need consistent treatment rather than an assumed universal deduction.

          Even matched gross profit can conceal cost-classification differences. Staff, technology and fulfilment charges may sit in different lines. An agency model may use less inventory but still face customer, supplier, operational or contractual risk. Higher margins are evidence to investigate, not proof of a stronger business or wrongdoing.

          Build a comparison that survives the next results release

          1. Identify the specific goods or services and the disclosed control judgement. Separate activities with different roles instead of assigning the whole company one permanent label.
          2. Bridge end-customer activity to reported revenue using the company's definitions. Record taxes, refunds, exclusions, currency, period and any missing supplier or fee information.
          3. Reconcile revenue to gross profit and operating profit on a common cost and consolidation basis. Keep amounts alongside percentages so denominator changes remain visible.
          4. Test the explanation with fixed-basis scenarios. Calculate how much fee compression, cost growth or business-mix change would preserve or reduce the profit being compared.
          5. Match valuation dates and numerator scope, then document the evidence that would change the conclusion. If the disclosures cannot support a bridge, mark the comparison unresolved and update it when new information arrives.

          A useful conclusion states what changed: a reporting denominator, the mix of distinct activities, or the income earned after costs. “Twelve times revenue is expensive” and “100% gross margin is superior” skip that distinction. The more defensible comparison follows the contract, the amounts and the profit they can actually support.

          Risk Warnings and Disclaimers
          You understand and acknowledge that there is a high degree of risk involved in trading. Following any strategies or investment methods may lead to potential losses. The content on the site is provided by our contributors and analysts for information purposes only. You are solely responsible for determining whether any trading assets, securities, strategy, or any other product is suitable for investing based on your own investment objectives and financial situation.
          Add to Favorites
          Share
          FastBull
          Copyright © 2026 FastBull Ltd

          728 RM B 7/F GEE LOK IND BLDG NO 34 HUNG TO RD KWUN TONG KLN HONG KONG

          TelegramInstagramTwitterfacebooklinkedin
          App Store Google Play Android Windows
          Products
          Charts

          Chats

          Q&A with Experts
          Screeners
          Economic Calendar
          Data
          Tools
          Membership
          Features
          Function
          Markets
          Copy Trading
          Latest Signals
          Contests
          24/7
          Analysis
          Education
          Company
          Careers
          About Us
          Contact Us
          Advertising
          Download FastBull
          Help Center
          Feedback
          User Agreement
          Privacy Policy
          Personal Information Protection Statement
          Business

          White Label

          Broker API

          Data API

          Web Plug-ins

          Poster Maker

          Affiliate Program

          Risk Disclosure

          The risk of loss in trading financial instruments such as stocks, FX, commodities, futures, bonds, ETFs and crypto can be substantial. You may sustain a total loss of the funds that you deposit with your broker. Therefore, you should carefully consider whether such trading is suitable for you in light of your circumstances and financial resources.

          No decision to invest should be made without thoroughly conducting due diligence by yourself or consulting with your financial advisors. Our web content might not suit you since we don't know your financial conditions and investment needs. Our financial information might have latency or contain inaccuracy, so you should be fully responsible for any of your trading and investment decisions. The company will not be responsible for your capital loss.

          Without getting permission from the website, you are not allowed to copy the website's graphics, texts, or trademarks. Intellectual property rights in the content or data incorporated into this website belong to its providers and exchange merchants.

          Not Logged In

          Log in to access more features

          Connect Broker
          Become a signal provider
          Help Center
          Customer Service
          Dark Mode
          Price Up/Down Colors

          Log In

          Sign Up

          Position
          Layout
          Fullscreen
          Default to Chart
          The chart page opens by default when you visit fastbull.com