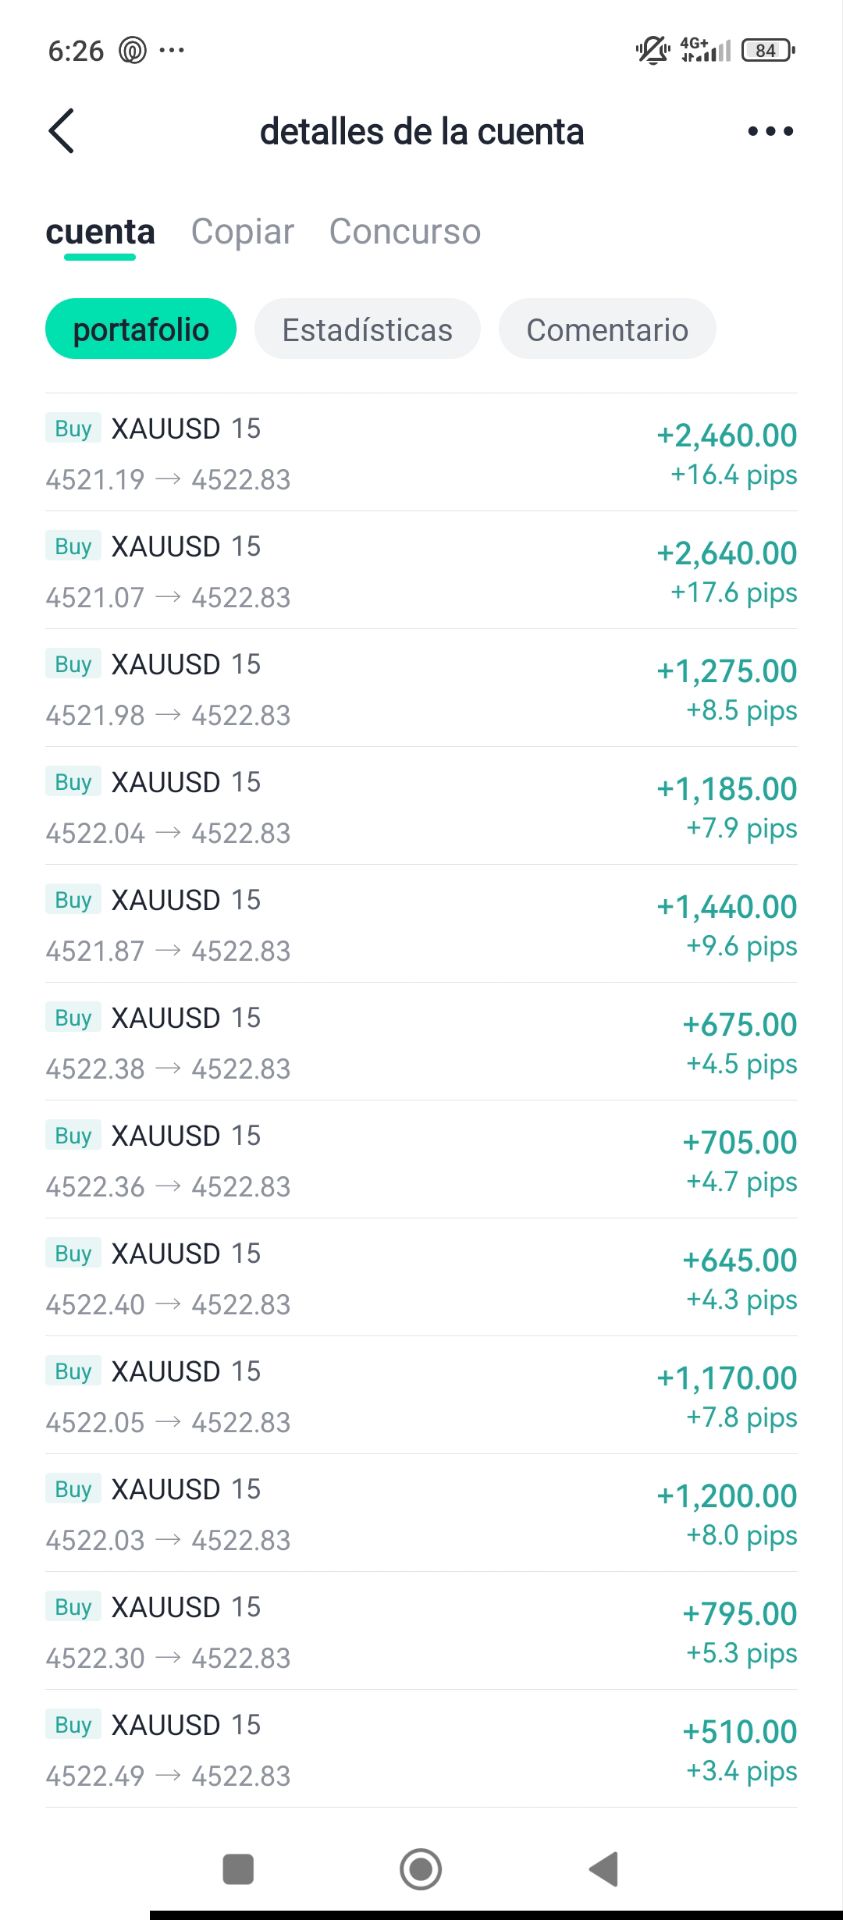
• Trade
  • Markets
  • Copy
  • Contests
  • 24/7
  • Calendar
  • Q&A
  • Chats
Screeners
SYMBOL
LAST
BID
ASK
HIGH
LOW
NET CHG.
%CHG.
SPREAD
SOURCE
SPX
S&P 500 Index
7192.83
7192.83
7192.83
7244.55
7175.02
-37.29
-0.52%
--
--
DJI
Dow Jones Industrial Average
49015.83
49015.83
49015.83
49441.43
48913.06
-483.43
-0.98%
--
--
IXIC
NASDAQ Composite Index
24995.43
24995.43
24995.43
25210.47
24913.12
-119.00
-0.47%
--
--
USDX
US Dollar Index
98.310
98.310
98.390
98.370
97.790
+0.300
+ 0.31%
--
--
EURUSD
Euro / US Dollar
1.16903
1.16903
1.16912
1.17489
1.16841
-0.00271
-0.23%
--
--
GBPUSD
Pound Sterling / US Dollar
1.35286
1.35286
1.35297
1.36029
1.35120
-0.00432
-0.32%
--
--
XAUUSD
Gold / US Dollar
4514.24
4514.24
4514.65
4629.29
4500.93
-100.12
-2.17%
--
--
WTI
Light Sweet Crude Oil
102.349
102.349
102.379
103.845
96.577
+2.839
+ 2.85%
--
--

Community Accounts

Signal Accounts
--
Profit Accounts
--
Loss Accounts
--
View More

Become a signal provider

Sell trading signals to earn additional income

View More

Guide to Copy Trading

Get started with ease and confidence

View More

Signal Accounts for Members

All Signal Accounts

Best Return
  • Best Return
  • Best P/L
  • Best MDD
Past 1W
  • Past 1W
  • Past 1M
  • Past 1Y

All Contests

  • All
  • Recommend
  • Stocks
  • Cryptocurrencies
  • Central Banks
  • Trump Updates
  • Featured News
Top News Only
Share

Italian Economy Minister: Italy Calls On The EU To Impose A Windfall Profits Tax On The Energy Sector

Share

Turkish President Recep Tayyip Erdoğan: Despite Changes In The Global Situation, Our Fight Against Inflation Has Not Been Relaxed In The Slightest

Share

U.S. Central Command Commander General Brad Cooper: Iran Has Used Cruise Missiles To Strike Merchant Ships And U.S. Warships

Share

General Brad Cooper, Commander Of U.S. Central Command: Iran Attempted To Disrupt Merchant Ships By Firing On Them, But Failed. The U.S. Has Destroyed Six Small Iranian Vessels That Attempted To Interfere With Merchant Navigation. It Is Strongly Recommended That Iranian Forces Maintain A Sufficient Distance From U.S. Military Assets. The U.S. Military Blockade Of Iran Has Been More Effective Than Expected

Share

According To Flight Tracking Platform FlightRadar24, Amid Reports Of Attacks In The Region, Several Flights Originally Scheduled To Fly To The UAE Are Being Diverted To Muscat, The Capital Of Oman

Share

Fitch Ratings: Despite Tariffs, Capital Goods Related To Artificial Intelligence Are Driving U.S. Imports To Remain High

Share

Zelenskyy Calls On Europe To Participate In Ukraine-Russia Talks

Share

German Vice Chancellor: The EU Will Retaliate If The U.S. Imposes Additional Tariffs

Share

The Media Office In Fujairah, UAE, Reported That Three Indian Citizens Sustained Minor Injuries In An Iranian Drone Strike On The Fujairah Oil Complex

Share

Ukrainian President Zelensky: A One-day Ceasefire With Russia Is Not An Option

Share

The New Zealand Dollar Fell 0.50% Against The US Dollar (NZD/USD) On The Day, Currently Trading At 0.5869

Share

The Australian Dollar Fell 0.50% Against The US Dollar On The Day, Currently Trading At 0.7164

Share

The China Earthquake Networks Center Officially Reported That A 5.5-magnitude Earthquake Occurred In Mexico (16.60 Degrees North Latitude, 98.05 Degrees West Longitude) At 23:19 On May 4, With A Focal Depth Of 10 Kilometers

Share

Market Reports: Multiple Aircraft Were Seen Circling Above The UAE After Iran Launched Missile And Drone Attacks

Share

Mexico’s National Seismological Service Released A Preliminary Report On The 4th, Saying That A Magnitude 6 Earthquake Struck The Southern State Of Oaxaca That Day, And The Tremors Were Felt In The Capital, Mexico City

Share

The Foreign Ministers Of Iran And Algeria Spoke By Phone To Discuss The Latest Situation In The Region

Share

The Iranian Army Commander-in-Chief Stated: "US Destroyers, Relying On Their Radar Silence, Assumed They Were Approaching The Strait Of Hormuz; But Our Response Was A Full-scale Attack. Cruise Missiles And Combat Drones Were Launched. Security In This Region Is A Red Line For Iran."

Share

US 3-Month Treasury Bill Auction As Of May 4 - Bid-to-Cover Ratio 2.76, Previous Value 3.09

Share

A Car Rammed Into A Crowd In Leipzig, Germany

Share

[UAE: Air Defense System Currently Addressing Missile Threat From Iran] May 4th, The UAE Ministry Of Defense Reported That 4 Cruise Missiles From The Direction Of Iran Were Detected, With 3 Of Them Successfully Intercepted In The Territorial Waters And The Other 1 Falling Into The Sea. Additionally, A Fire Broke Out At The UAE's Fujairah Oil Industry Zone Due To An Iranian Drone Attack

TIME
ACT
FCST
PREV
IMPACT
U.S. ISM Manufacturing New Orders Index (Apr)

A:--

F: --

P: --

USDX
  • USDX
  • XAUUSD
  • XAGUSD
  • WTI
U.S. ISM Manufacturing Employment Index (Apr)

A:--

F: --

P: --

USDX
  • USDX
  • XAUUSD
  • XAGUSD
  • WTI
U.S. ISM Output Index (Apr)

A:--

F: --

P: --

USDX
  • USDX
  • XAUUSD
  • XAGUSD
  • WTI
U.S. ISM Inventories Index (Apr)

A:--

F: --

P: --

USDX
  • USDX
  • XAUUSD
  • XAGUSD
  • WTI
U.S. Weekly Total Oil Rig Count

A:--

F: --

P: --

WTI
  • WTI
  • XAUUSD
  • XAGUSD
  • USDX
U.S. Weekly Total Rig Count

A:--

F: --

P: --

WTI
  • WTI
  • XAUUSD
  • XAGUSD
  • USDX
Turkey Trade Balance (Apr)

A:--

F: --

P: --

XAUUSD
  • XAUUSD
  • XAGUSD
  • WTI
  • USDX
Indonesia IHS Markit Manufacturing PMI (Apr)

A:--

F: --

P: --

XAUUSD
  • XAUUSD
  • XAGUSD
  • WTI
  • USDX
South Korea IHS Markit Manufacturing PMI (SA) (Apr)

A:--

F: --

P: --

XAUUSD
  • XAUUSD
  • XAGUSD
  • WTI
  • USDX
Australia Private Building Permits MoM (SA) (Mar)

A:--

F: --

P: --

AUDUSD
  • AUDUSD
  • XAUUSD
  • XAGUSD
  • WTI
  • USDX
Australia Building Permits YoY (SA) (Mar)

A:--

F: --

P: --

AUDUSD
  • AUDUSD
  • XAUUSD
  • XAGUSD
  • WTI
  • USDX
Australia Building Permits MoM (SA) (Mar)

A:--

F: --

P: --
AUDUSD
  • AUDUSD
  • XAUUSD
  • XAGUSD
  • WTI
  • USDX
Indonesia Trade Balance (Mar)

A:--

F: --

P: --

XAUUSD
  • XAUUSD
  • XAGUSD
  • WTI
  • USDX
Indonesia Inflation Rate YoY (Apr)

A:--

F: --

P: --

XAUUSD
  • XAUUSD
  • XAGUSD
  • WTI
  • USDX
Indonesia Core Inflation YoY (Apr)

A:--

F: --

P: --

XAUUSD
  • XAUUSD
  • XAGUSD
  • WTI
  • USDX
India HSBC Manufacturing PMI Final (Apr)

A:--

F: --

P: --

XAUUSD
  • XAUUSD
  • XAGUSD
  • WTI
  • USDX
Russia IHS Markit Manufacturing PMI (Apr)

A:--

F: --

P: --

WTI
  • WTI
  • XAUUSD
  • XAGUSD
  • USDX
Turkey Manufacturing PMI (Apr)

A:--

F: --

P: --

XAUUSD
  • XAUUSD
  • XAGUSD
  • WTI
  • USDX
Turkey PPI YoY (Apr)

A:--

F: --

P: --

XAUUSD
  • XAUUSD
  • XAGUSD
  • WTI
  • USDX
Turkey CPI YoY (Apr)

A:--

F: --

P: --

XAUUSD
  • XAUUSD
  • XAGUSD
  • WTI
  • USDX
Italy Manufacturing PMI (SA) (Apr)

A:--

F: --

P: --

EURUSD
  • EURUSD
  • XAUUSD
  • XAGUSD
  • WTI
  • USDX
Turkey Trade Balance (Apr)

A:--

F: --

P: --

XAUUSD
  • XAUUSD
  • XAGUSD
  • WTI
  • USDX
Euro Zone Sentix Investor Confidence Index (May)

A:--

F: --

P: --

EURUSD
  • EURUSD
  • XAUUSD
  • XAGUSD
  • WTI
  • USDX
South Africa Manufacturing PMI (Apr)

A:--

F: --

P: --

XAUUSD
  • XAUUSD
  • XAGUSD
  • WTI
  • USDX
Canada National Economic Confidence Index

A:--

F: --

P: --

USDCAD
  • USDCAD
  • XAUUSD
  • XAGUSD
  • WTI
  • USDX
Brazil IHS Markit Manufacturing PMI (Apr)

A:--

F: --

P: --

XAUUSD
  • XAUUSD
  • XAGUSD
  • WTI
  • USDX
U.S. Factory Orders MoM (Excl. Transport) (Mar)

A:--

F: --

P: --
USDX
  • USDX
  • XAUUSD
  • XAGUSD
  • WTI
U.S. Factory Orders MoM (Mar)

A:--

F: --

P: --
USDX
  • USDX
  • XAUUSD
  • XAGUSD
  • WTI
U.S. Factory Orders MoM (Excl. Defense) (Mar)

A:--

F: --

P: --

USDX
  • USDX
  • XAUUSD
  • XAGUSD
  • WTI
Mexico Manufacturing PMI (Apr)

A:--

F: --

P: --

XAUUSD
  • XAUUSD
  • XAGUSD
  • WTI
  • USDX
New York Federal Reserve President Williams delivered a speech.
Bank of Canada Governor Macklem and Senior Deputy Governor Rogers attended a parliamentary hearing.
Indonesia GDP YoY (Q1)

--

F: --

P: --

Saudi Arabia IHS Markit Composite PMI (Apr)

--

F: --

P: --

Australia Overnight (Borrowing) Key Rate

--

F: --

P: --

RBA Rate Statement
RBA Press Conference
Canada Trade Balance (SA) (Mar)

--

F: --

P: --

U.S. Trade Balance (Mar)

--

F: --

P: --

U.S. Exports (Mar)

--

F: --

P: --

Canada Imports (SA) (Mar)

--

F: --

P: --

Canada Exports (SA) (Mar)

--

F: --

P: --

U.S. Weekly Redbook Index YoY

--

F: --

P: --

U.S. ISM Non-Manufacturing New Orders Index (Apr)

--

F: --

P: --

U.S. ISM Non-Manufacturing Price Index (Apr)

--

F: --

P: --

U.S. New Home Sales Annualized MoM (Mar)

--

F: --

P: --

U.S. ISM Non-Manufacturing Employment Index (Apr)

--

F: --

P: --

U.S. Annual Total New Home Sales (Mar)

--

F: --

P: --

U.S. ISM Non-Manufacturing Inventories Index (Apr)

--

F: --

P: --

U.S. ISM Non-Manufacturing PMI (Apr)

--

F: --

P: --

U.S. JOLTS Job Openings (SA) (Mar)

--

F: --

P: --

U.S. API Weekly Crude Oil Stocks

--

F: --

P: --

U.S. API Weekly Cushing Crude Oil Stocks

--

F: --

P: --

U.S. API Weekly Gasoline Stocks

--

F: --

P: --

U.S. API Weekly Refined Oil Stocks

--

F: --

P: --

South Korea CPI YoY (Apr)

--

F: --

P: --

China, Mainland Caixin Services PMI (Apr)

--

F: --

P: --

China, Mainland Caixin Composite PMI (Apr)

--

F: --

P: --

India IHS Markit Composite PMI (Apr)

--

F: --

P: --

India HSBC Services PMI Final (Apr)

--

F: --

P: --

Russia IHS Markit Services PMI (Apr)

--

F: --

P: --

Q&A with Experts
    • All
    • Chatrooms
    • Groups
    • Friends
    Size flag
    I mainly focus on gold, BTC, and major currency pairs.@Aster
    Nawhdir Øt flag
    apapun yang terjadi, masa bodo
    4273699 flag
    vous me conseiller d 'investir sur quoi les freres
    Huynh Thao flag
    SlowBear ⛅
    @horus Well i am seeing that 60pips rebound lets see how much rebound we get before the market close today
    @SlowBear ⛅phục hồi để giảm phá 4500 về 4490
    SlowBear ⛅ flag
    JOSHUA
    @SlowBear ⛅Guessing game, gambling expert😂
    @JOSHUAWell some people can see into tomorrow though so that might be it
    USER_ERROR flag
    Rsi dalam Tf 15 sudah terlalu jenuh di angka 20 pada stock emas
    Aster flag
    Size
    I mainly focus on gold, BTC, and major currency pairs.@Aster
    @Size I was trading Gold for a year and it made me lose 41 funded accounts so i switched to nq and its way much better
    Size flag
    Huynh Thao
    @Sizevàng muống tăng có thẻ là cuối tuần
    true bro, anything can happen by the end of the week, depends on demand and supply..
    horus flag
    SlowBear ⛅
    @horus Well i am seeing that 60pips rebound lets see how much rebound we get before the market close today
    @SlowBear ⛅vale lo vas a tener Bro
    Size flag
    Let’s see how price actually reacts instead of guessing early..@Huynh Thao
    4178802 flag
    tomorrow Nifty axpayri ...up ya dawon ??...
    JOSHUA flag
    Size
    Market doesn’t always continue one direction straight, it can also retrace before deciding..@Huynh Thao
    @SizeIf it does as he expects, then all will be C/2 and suffering from depression 🤣
    Nawhdir Øt flag
    4178802
    tomorrow Nifty axpayri ...up ya dawon ??...
    @Pengunjung4178802jay sri ram ?
    Size flag
    Aster
    @Size I was trading Gold for a year and it made me lose 41 funded accounts so i switched to nq and its way much better
    @AsterDamn bro, 41 funded accounts is rough..
    4178802 flag
    4178802
    tomorrow Nifty axpayri ...up ya dawon ??...
    tell me pls all
    4273717 flag
    chui nouveau
    horus flag
    Size flag
    But at least you adapted and found what works better for you.@Aster
    SlowBear ⛅ flag
    horus
    @SlowBear ⛅vale lo vas a tener Bro
    @horus Well i am not holding my breath bro, if it happens fine if not i will see everyone tomorrow!
    Size flag
    If NQ suits your style more, then that’s what matters, consistency beats forcing a market that doesn’t fit you..@Aster
    Type here...
    Add Symbol or Code

      No matching data

      All
      Recommend
      Stocks
      Cryptocurrencies
      Central Banks
      Trump Updates
      Featured News
      • All
      • Russia-Ukraine Conflict
      • Middle East Flashpoint
      • All
      • Russia-Ukraine Conflict
      • Middle East Flashpoint
      Search
      Products

      Charts Free Forever

      Chats Q&A with Experts
      Screeners Economic Calendar Data Tools
      Membership Features
      Data Warehouse Market Trends Institutional Data Policy Rates Macro

      Market Trends

      Market Sentiment Order Book Forex Correlations

      Top Indicators

      Charts Free Forever
      Markets

      News

      24/7 Analysis Education

      Latest Views

      Latest Update

      Signals

      Copy Rankings Latest Signals Become a signal provider AI Rating
      Contests
      Brokers

      Overview Brokers Assessment Rankings Regulators News Claims
      Broker listing Forex Brokers Comparison Tool Live Spread Comparison Scam
      Q&A Complaint Scam Alert Videos Tips to Detect Scam
      More

      Business
      Events
      Careers About Us Advertising Help Center

      White Label

      Broker API

      Data API

      Web Plug-ins

      Affiliate Program

      Awards Institution Evaluation IB Seminar Salon Event Exhibition
      Vietnam Thailand Singapore Dubai
      Fans Party Investment Sharing Session
      FastBull Summit BrokersView Expo
      Recent Searches
        Top Searches
          Markets
          Analysis
          User
          24/7
          Economic Calendar
          Education
          Data
          • Names
          • Latest
          • Prev

          View All

          No data

          Scan to Download

          Faster Charts, Chat Faster!

          Download App
          English
          • English
          • Español
          • العربية
          • Bahasa Indonesia
          • Bahasa Melayu
          • Tiếng Việt
          • ภาษาไทย
          • Français
          • Italiano
          • Türkçe
          • Русский язык
          • 简中
          • 繁中
          Open Account
          Search
          Products
          Charts Free Forever
          Markets
          News
          Signals

          Copy Rankings Latest Signals Become a signal provider AI Rating
          Contests
          Brokers

          Overview Brokers Assessment Rankings Regulators News Claims
          Broker listing Forex Brokers Comparison Tool Live Spread Comparison Scam
          Q&A Complaint Scam Alert Videos Tips to Detect Scam
          More

          Business
          Events
          Careers About Us Advertising Help Center

          White Label

          Broker API

          Data API

          Web Plug-ins

          Affiliate Program

          Awards Institution Evaluation IB Seminar Salon Event Exhibition
          Vietnam Thailand Singapore Dubai
          Fans Party Investment Sharing Session
          FastBull Summit BrokersView Expo

          Fundamental Analysis of Stocks for Long Term Investment: Key Metrics

          zhan chen
          Summary:

          Beyond market noise: Master the fundamental analysis of stocks for long term investment to evaluate corporate health and identify enduring market leaders.

          Mastering the fundamental analysis of stocks for long term investment is essential for building lasting wealth. For serious investors, looking past daily market noise to evaluate true business health is what separates speculation from strategy. This guide breaks down the critical financial metrics, qualitative factors, and valuation techniques needed to identify tomorrow's market leaders.

          Fundamental Analysis of Stocks for Long Term Investment: Key Metrics

          What Makes Fundamental Analysis the Right Approach for Long-Term Stock Investing?

          Short-term stock prices are driven by headlines, macroeconomic panics, and shifting investor sentiment. However, over a timeline of five to ten years, a stock’s price almost always follows the trajectory of its underlying corporate earnings and cash flows. Fundamental analysis anchors your portfolio in economic reality rather than market psychology.

          By treating a stock as a fractional ownership stake in a real business, you shift your focus to what truly matters. You look for resilient balance sheets, expanding market share, and strong leadership. This disciplined approach is exactly how professionals filter out the noise to identify the best undervalued stocks to buy now.

          Which Financial Metrics Actually Predict Long-Term Stock Performance?

          How Do You Use P/E, EV/EBITDA, and PEG Ratios Without Overpaying for a Stock?

          The Price-to-Earnings (P/E) ratio is the most common valuation metric, but it tells an incomplete story if a company's earnings are stagnant. EV/EBITDA is often a better alternative for comparing companies across different capital structures, as it factors in a firm's debt and cash levels.

          To avoid overpaying for the best growth stocks to buy now, seasoned investors look to the PEG ratio (Price/Earnings to Growth). Popularized by legendary investor Peter Lynch, the PEG ratio divides the P/E multiple by the expected earnings growth rate. A PEG ratio near 1.0 typically suggests a stock is fairly valued relative to its growth potential.

          What Do Revenue Growth, Profit Margins, and Earnings Trends Tell You?

          A business cannot grow its earnings indefinitely by simply cutting costs; eventually, it needs top-line revenue growth. Consistent revenue growth indicates that a company's products remain in high demand within its target market.

          Simultaneously, expanding profit margins prove that a company possesses pricing power and operating leverage. When revenue grows and margins expand, earnings per share (EPS) accelerate. Tracking these trends over multiple quarters helps you verify that a company’s growth is sustainable and fundamentally sound.

          Why Do Return on Invested Capital (ROIC) and Debt-to-Equity Matter for Long-Term Holders?

          Return on Invested Capital (ROIC) measures how effectively a management team uses the capital it raises to generate profits. According to a comprehensive long-term study by McKinsey, a company's ROIC tends to remain highly stable over decades and is a primary driver of lasting shareholder value. Businesses that consistently generate an ROIC higher than their cost of capital compound wealth at exceptional rates.

          Debt-to-Equity, on the other hand, acts as a critical risk gauge. Companies with heavy debt burdens may look profitable during economic booms but can face bankruptcy during recessions. A low debt-to-equity ratio ensures the company has the financial flexibility to survive downturns and reinvest in operations.

          How Do You Read Free Cash Flow to Judge a Company's Real Financial Health?

          Net income is an accounting construct that can be legally manipulated through depreciation schedules and non-cash accruals. Free Cash Flow (FCF) strips away the accounting noise, revealing the actual cash a business generates after covering its operating expenses and capital expenditures.

          If you are searching for the best dividend stocks to buy now, FCF is the ultimate litmus test. A company can only sustain and grow its dividend payouts, buy back shares, or acquire competitors if it generates robust, positive free cash flow. A business showing growing earnings but shrinking FCF is a major red flag.

          How Do You Evaluate a Business Beyond the Numbers?

          What Does a Durable Competitive Advantage Look Like in Practice?

          Numbers reflect past performance, but a "moat" protects future returns. A durable competitive advantage ensures that rivals cannot easily steal a company's market share or erode its profit margins.

          Moats come in several forms:

          • Brand Power: Consumers pay a premium simply for the brand name.
          • Switching Costs: It is too expensive or disruptive for customers to leave for a competitor.
          • Network Effects: The product becomes more valuable as more people use it.
          • Cost Advantages: Superior scale or proprietary technology allows the company to produce goods cheaper than rivals.

          How Do Management Quality and Capital Allocation Decisions Affect Long-Term Returns?

          A company's executive team acts as the steward of shareholder capital. Their primary job is capital allocation—deciding whether to reinvest in the business, pay dividends, repurchase shares, or make acquisitions. Poor capital allocation can destroy a fundamentally sound business.

          Investors should look for management teams with significant insider ownership, as this aligns their interests with shareholders. Additionally, reviewing historical earnings calls and annual reports will reveal if management is transparent about their failures or if they routinely blame macroeconomic factors for poor performance.

          How Do You Decide If a Stock Is Worth Buying at Its Current Price?

          What Is Intrinsic Value and How Do You Estimate It Without a Finance Degree?

          Intrinsic value is the absolute true worth of a business, based on the total cash it will generate over its lifetime, discounted back to today's dollars. While institutional analysts use complex Discounted Cash Flow (DCF) models, everyday investors can estimate value using simpler multiples.

          By comparing a company's current PEG ratio, Price-to-FCF, and historical P/E averages against its peers, you can quickly gauge if a stock is trading below its historical norm. This pragmatic approach is highly effective for discovering the best cheap stocks to buy now without getting lost in academic spreadsheets.

          How Do You Apply a Margin of Safety When Building a Long-Term Position?

          The concept of a "margin of safety" was introduced by Benjamin Graham, the father of value investing. It is the mathematical gap between a stock's intrinsic value and its current market price. Because no valuation model is perfect, this gap acts as a buffer against unforeseen economic shocks or calculation errors.

          If a stock's intrinsic value is estimated at $100, buying it at $75 provides a 25% margin of safety. This conservative principle ensures that even if your growth assumptions are overly optimistic, your risk of permanent capital loss remains severely limited.

          What Are the Biggest Mistakes Investors Make When Using Fundamental Analysis?

          Even experienced investors can fall into analytical traps if they let emotions or shortcuts dictate their strategy. The most devastating mistake is confusing a permanently declining business with a market bargain.

          Rather than doing independent research, many amateurs search for the best stocks to buy now reddit threads, crowdsourcing their financial decisions. Relying on social media sentiment directly contradicts the core principles of objective fundamental analysis.

          Common MistakeWhy It Destroys ValueThe Better Approach
          Buying "Value Traps"A low P/E ratio often means the core business is shrinking.Insist on positive revenue growth and stable free cash flow.
          Ignoring the Balance SheetHigh earnings mean nothing if debt forces bankruptcy.Always check the debt-to-equity ratio and cash reserves.
          Chasing Unprofitable GrowthScaling revenue without cash flow leads to share dilution.Demand a clear path to profitability and sustainable ROIC.
          Overpaying for Great CompaniesA fantastic business is a terrible investment at the wrong price.Always demand a margin of safety based on intrinsic value.

          FAQs about fundamental analysis of stocks for long term investment

          What are the most important financial ratios for long-term investing?

          Return on Invested Capital (ROIC), Free Cash Flow yield, and the PEG ratio are the most critical metrics. They effectively highlight a company's management efficiency, actual cash generation, and valuation relative to its growth.

          How to analyse stocks for long-term investment?

          Start by assessing the company's financial statements to ensure growing revenues, positive free cash flow, and manageable debt. Next, evaluate qualitative factors like durable competitive advantages and management competence before calculating intrinsic value.

          Is fundamental analysis good for long term?

          Yes, fundamental analysis is universally considered the most reliable method for long-term investing. It focuses entirely on underlying business health and real economic value rather than short-term price fluctuations.

          How to identify undervalued stocks using fundamental analysis?

          Estimate the company's intrinsic value based on future cash flows and compare it to the current market share price. A stock is considered undervalued if it trades with a significant margin of safety below this estimated true worth.

          Conclusion

          Applying the fundamental analysis of stocks for long term investment transforms you from a market speculator into a disciplined business owner. By focusing on sustainable free cash flows, durable competitive advantages, and a strict margin of safety, you can build a resilient portfolio designed to compound wealth steadily over the decades.

          Risk Warnings and Disclaimers
          You understand and acknowledge that there is a high degree of risk involved in trading. Following any strategies or investment methods may lead to potential losses. The content on the site is provided by our contributors and analysts for information purposes only. You are solely responsible for determining whether any trading assets, securities, strategy, or any other product is suitable for investing based on your own investment objectives and financial situation.
          Add to Favorites
          Share
          FastBull
          Copyright © 2026 FastBull Ltd

          728 RM B 7/F GEE LOK IND BLDG NO 34 HUNG TO RD KWUN TONG KLN HONG KONG

          TelegramInstagramTwitterfacebooklinkedin
          App Store Google Play Google Play
          Products
          Charts

          Chats

          Q&A with Experts
          Screeners
          Economic Calendar
          Data
          Tools
          Membership
          Features
          Function
          Markets
          Copy Trading
          Latest Signals
          Contests
          24/7
          Analysis
          Education
          Company
          Careers
          About Us
          Contact Us
          Advertising
          Help Center
          Feedback
          User Agreement
          Privacy Policy
          Personal Information Protection Statement
          Business

          White Label

          Broker API

          Data API

          Web Plug-ins

          Poster Maker

          Affiliate Program

          Risk Disclosure

          The risk of loss in trading financial instruments such as stocks, FX, commodities, futures, bonds, ETFs and crypto can be substantial. You may sustain a total loss of the funds that you deposit with your broker. Therefore, you should carefully consider whether such trading is suitable for you in light of your circumstances and financial resources.

          No decision to invest should be made without thoroughly conducting due diligence by yourself or consulting with your financial advisors. Our web content might not suit you since we don't know your financial conditions and investment needs. Our financial information might have latency or contain inaccuracy, so you should be fully responsible for any of your trading and investment decisions. The company will not be responsible for your capital loss.

          Without getting permission from the website, you are not allowed to copy the website's graphics, texts, or trademarks. Intellectual property rights in the content or data incorporated into this website belong to its providers and exchange merchants.

          Not Logged In

          Log in to access more features

          Connect Broker
          Become a signal provider
          Help Center
          Customer Service
          Dark Mode
          Price Up/Down Colors

          Log In

          Sign Up

          Position
          Layout
          Fullscreen
          Default to Chart
          The chart page opens by default when you visit fastbull.com